Hi,
(This is different ask of a previous question with a new dataset and accompanying Power BI file to cover a lower level of detail for drill-down to week level, and not only to month level. The solutions offered previously could not accommodate the week-level drill-down.)
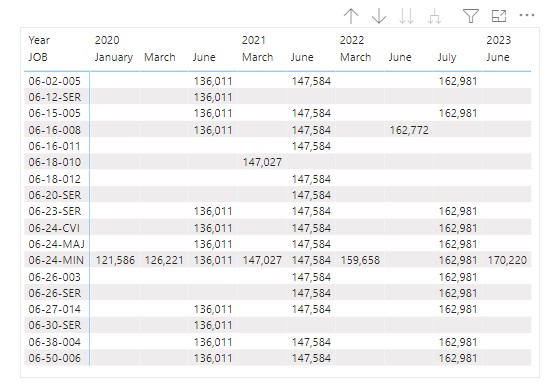
For each vehicle many jobs are performed at various mileage intervals. Each time a job is performed, the mileage (Meter KM) is captured. Below in the table you can see the mileage when different jobs in the JOB column were performed at various dates for one selected vehicle. (There are of course many more vehicles.)
Question: I don’t want to display the actual mileage when each job was performed as you can see in the below table, but rather the difference between each value (km) and its previous value (km) for each job. This is to see clearly the interval in which the jobs were performed. This means e.g. for the first Job 06-02-005, 2021 June should not display147,584, but rather (147,584-136,011)= 11,573, and 2022 July should not display the 162,981, but rather (162,981-147,584=) 15,397.
**
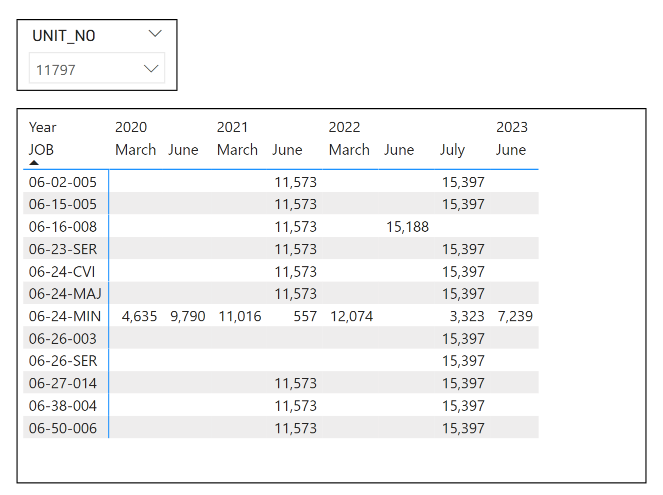
The aim is to see something like the below, but with the option to drill down to at least week level.
All the data is captured in the same WO_JOBS table. Here is sample data from this table.
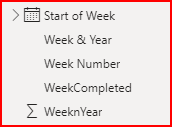
The data captured in Power BI is here with a Melissa’s extended date table.
PLEASE NOTE: the interval between the various jobs differs. Some happen every two weeks, others once a year, and everything in between. The DAX should allow display/drill-down to week level, and not only month level. (Jobs ending with BIW are bi-weekly jobs.)
One would typically filter on a specific vehicle to monitor service intervals for its many jobs.
With thanks,
William