Deneb Workout 05 - Bullet Chart with Custom Legend

Difficulty Rating: 4 out of 5


A bullet chart can be used as an alternative to a grouped bar chart; instead of varying the Y-position, one instead varies the bar width. Deneb/Vega-Lite can be used to easily create such a bullet chart.

Goals
Using the simple supplied dataset, produce a bullet chart Deneb visual in Power BI that:
• consists of 3 overlapping bar marks
• includes a transform block with in-visual calculations to extend the dataset with ratios
• includes custom tooltips displaying all data values and ratios regardless of hover position
• colours the bars using the first, fifth, and eighth colours defined in the current Power BI theme
• includes a custom legend using the first, fifth, and eighth colours defined in the current Power BI theme
• includes a title block with subtitle

Submission
Load the supplied data file into a new Power BI file, create your solution, and reply to this post. Upload a screenshot of your solution along with the Deneb/Vega-Lite JSON code used. Please format your JSON code and blur it or place it in a hidden section.

Period
This workout will be released on Monday April 17, 2023, and the author’s solution will be posted on Sunday April 23, 2023.

Greg
Deneb Workout 05 - Data - Financial Performance by Department.xlsx (9.0 KB)

1 Like

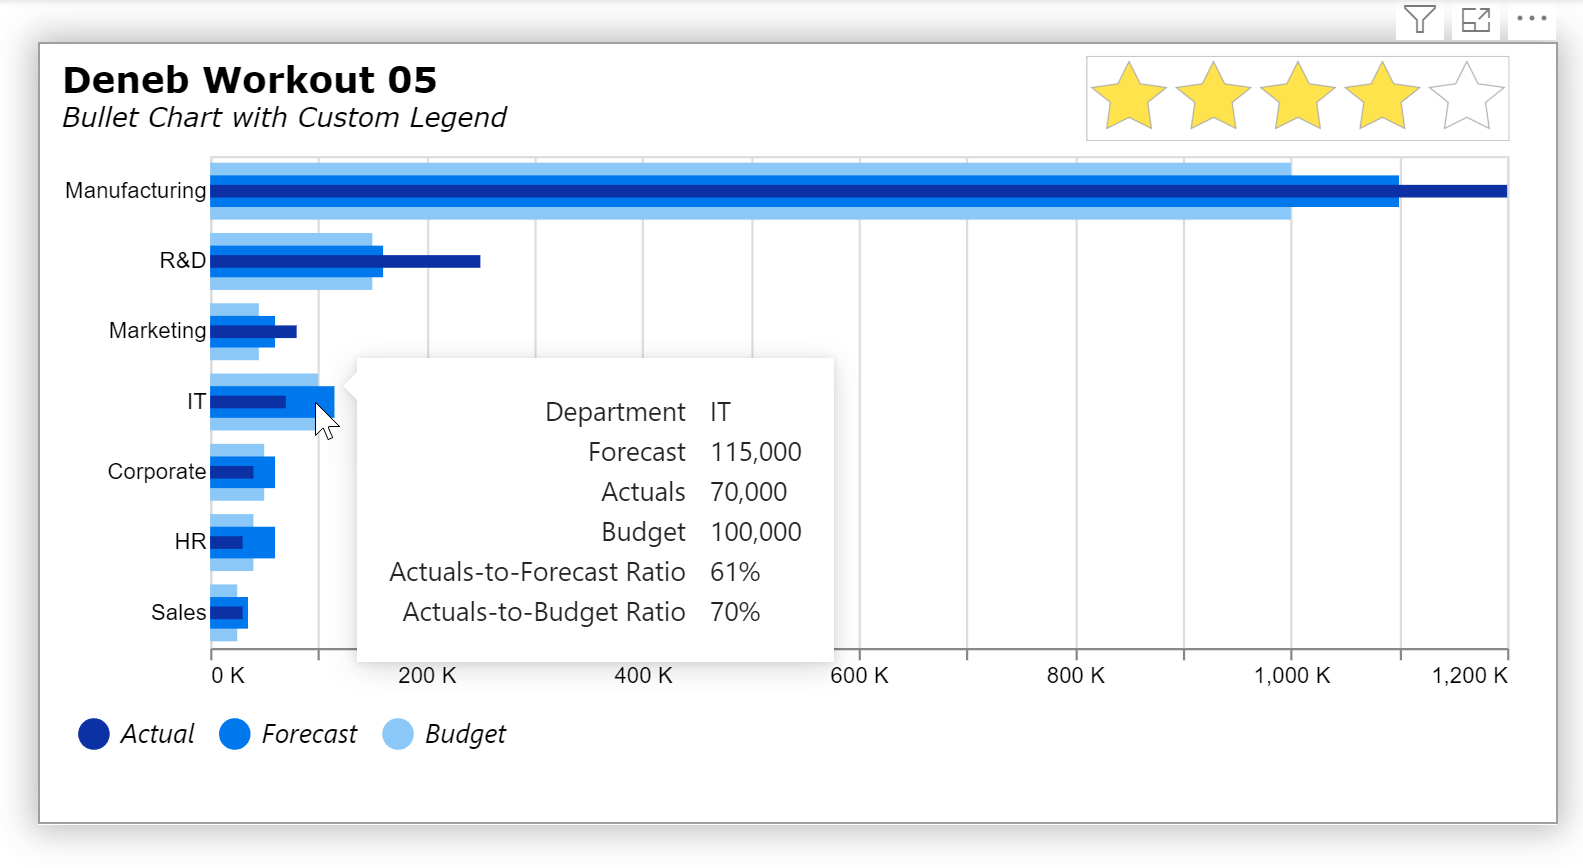
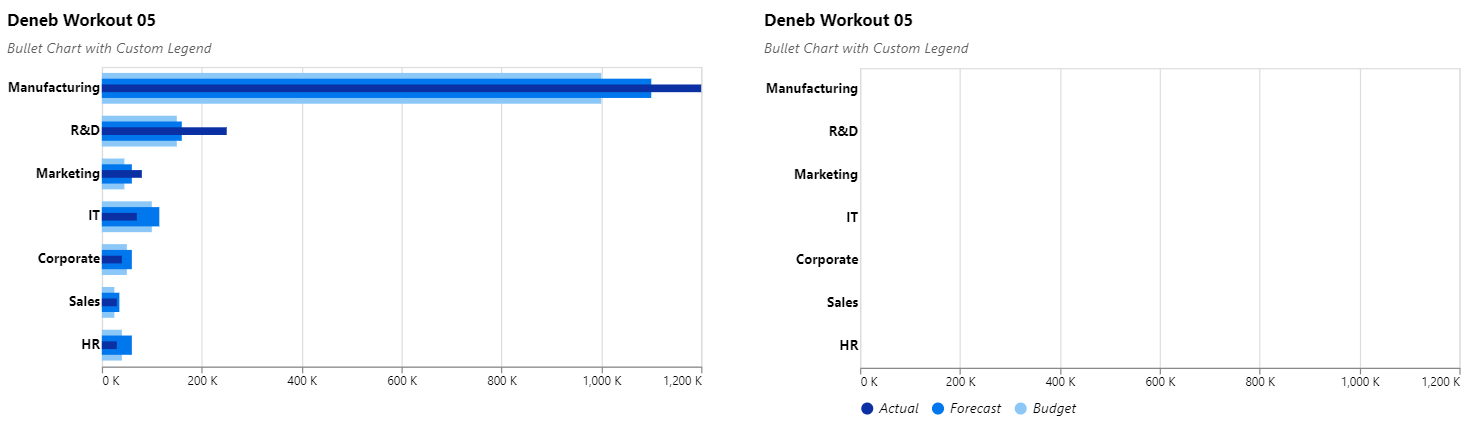
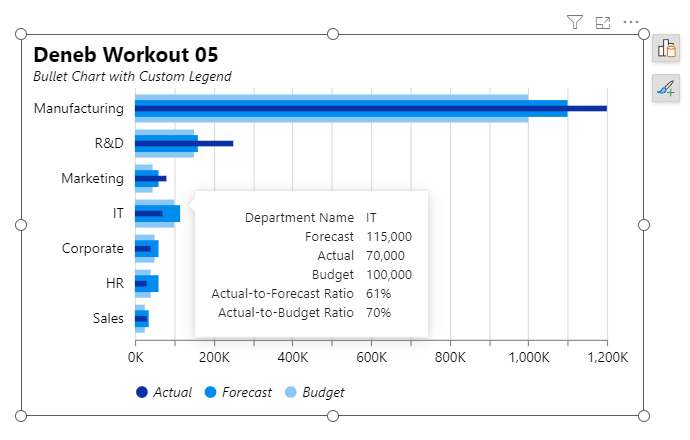
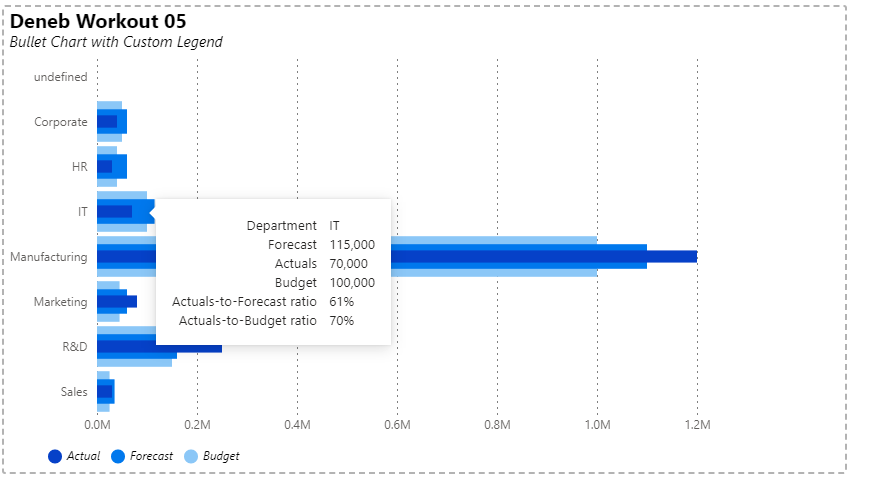
The bullet chart is straightforward. The custom legend is straightforward. Combining the two is challenging. And, so far, it’s eaten my lunch: when vconcat-ing the the two I lose the bullet chart:

I’m looking foreward to seeing how this is worked out.

{
  "title": {
    "anchor": "start",
    "align": "left",
    "offset": 10,
    "color": "black",
    "text": "Deneb Workout 05",
    "font": "Segoe UI",
    "fontSize": 14,
    "fontWeight": "bold",
    "fontStyle": "normal",
    "subtitle": "Bullet Chart with Custom Legend",
    "subtitleFont": "Segoe UI",
    "subtitleFontSize": 12,
    "subtitleFontWeight": "normal",
    "subtitleFontStyle": "italic",
    "subtitleColor": "#605E5C",
    "subtitlePadding": 10
  },
  "height": 250,
  "width": 500,
  "data": {"name": "dataset"},
  "transform": [
    {
      "calculate": "datum['Actuals Amount'] / datum['Forecast Amount']",
      "as": "Actuals-to-Forecast Ratio"
    },
    {
      "calculate": "datum['Actuals Amount'] / datum['Budget Amount']",
      "as": "Actuals-to-Budget Ratio"
    }
  ],
  "params": [
    {
      "name": "widthBudget",
      "value": 0.8
    },
    {
      "name": "widthActual",
      "value": 0.2
    },
    {
      "name": "widthForecast",
      "value": 0.5
    }
  ],
  "encoding": {
    "y": {
      "field": "Department Name",
      "type": "nominal",
      "sort": {
        "op": "sum",
        "field": "Actuals Amount",
        "order": "descending"
      },
      "axis": {
        "ticks": false,
        "grid": false,
        "domain": false,
        "labelColor": "black",
        "labelFontSize": 11,
        "labelFontWeight": "bold"
      }
    }
  },
  "layer": [
    {
      "description": "Budget Amount",
      "mark": {
        "type": "bar",
        "tooltip": true,
        "size": {
          "expr": "bandwidth('y') * widthBudget"
        }
      },
      "encoding": {
        "x": {
          "field": "Budget Amount",
          "type": "quantitative",
          "axis": {
            "format": "#,##0,. K",
            "formatType": "pbiFormat"
          }
        },
        "color": {
          "value": {
            "expr": "pbiColor(0)"
          }
        },
        "tooltip": [
          {"field": "Department Name"},
          {
            "field": "Forecast Amount",
            "format": "$,0.",
            "formatType": "pbiFormat"
          },
          {
            "field": "Actuals Amount",
            "format": "$,0.",
            "formatType": "pbiFormat"
          },
          {
            "field": "Budget Amount",
            "format": "$,0.",
            "formatType": "pbiFormat"
          },
          {
            "field": "Actuals-to-Forecast Ratio",
            "format": ".0%"
          },
          {
            "field": "Actuals-to-Budget Ratio",
            "format": ".0%"
          }
        ]
      }
    },
    {
      "description": "Forecast Amount",
      "mark": {
        "type": "bar",
        "tooltip": true,
        "size": {
          "expr": "bandwidth('y') * widthForecast"
        }
      },
      "encoding": {
        "x": {
          "field": "Forecast Amount",
          "type": "quantitative",
          "axis": {
            "format": "#,##0,. K",
            "formatType": "pbiFormat"
          }
        },
        "color": {
          "value": {
            "expr": "pbiColor(4)"
          }
        },
        "tooltip": [
          {"field": "Department Name"},
          {
            "field": "Forecast Amount",
            "format": "$,0.",
            "formatType": "pbiFormat"
          },
          {
            "field": "Actuals Amount",
            "format": "$,0.",
            "formatType": "pbiFormat"
          },
          {
            "field": "Budget Amount",
            "format": "$,0.",
            "formatType": "pbiFormat"
          },
          {
            "field": "Actuals-to-Forecast Ratio",
            "format": ".0%"
          },
          {
            "field": "Actuals-to-Budget Ratio",
            "format": ".0%"
          }
        ]
      }
    },
    {
      "description": "Actuals Amount",
      "mark": {
        "type": "bar",
        "tooltip": true,
        "size": {
          "expr": "bandwidth('y') * widthActual"
        }
      },
      "encoding": {
        "x": {
          "field": "Actuals Amount",
          "type": "quantitative",
          "axis": {
            "format": "#,##0,. K",
            "formatType": "pbiFormat"
          }
        },
        "color": {
          "value": {
            "expr": "pbiColor(7)"
          }
        },
        "tooltip": [
          {"field": "Department Name"},
          {
            "field": "Forecast Amount",
            "format": "$,0.",
            "formatType": "pbiFormat"
          },
          {
            "field": "Actuals Amount",
            "format": "$,0.",
            "formatType": "pbiFormat"
          },
          {
            "field": "Budget Amount",
            "format": "$,0.",
            "formatType": "pbiFormat"
          },
          {
            "field": "Actuals-to-Forecast Ratio",
            "format": ".0%"
          },
          {
            "field": "Actuals-to-Budget Ratio",
            "format": ".0%"
          }
        ]
      }
    }
  ]
}

and with the custom legend:

{
  "title": {
    "anchor": "start",
    "align": "left",
    "offset": 10,
    "color": "black",
    "text": "Deneb Workout 05",
    "font": "Segoe UI",
    "fontSize": 14,
    "fontWeight": "bold",
    "fontStyle": "normal",
    "subtitle": "Bullet Chart with Custom Legend",
    "subtitleFont": "Segoe UI",
    "subtitleFontSize": 12,
    "subtitleFontWeight": "normal",
    "subtitleFontStyle": "italic",
    "subtitleColor": "#605E5C",
    "subtitlePadding": 10
  },
  "data": {"name": "dataset"},
  "transform": [
    {
      "calculate": "datum['Actuals Amount'] / datum['Forecast Amount']",
      "as": "Actuals-to-Forecast Ratio"
    },
    {
      "calculate": "datum['Actuals Amount'] / datum['Budget Amount']",
      "as": "Actuals-to-Budget Ratio"
    }
  ],
  "params": [
    {
      "name": "widthBudget",
      "value": 0.8
    },
    {
      "name": "widthActual",
      "value": 0.2
    },
    {
      "name": "widthForecast",
      "value": 0.5
    }
  ],
  "vconcat": [
    {
      "height": 250,
      "width": 500,
      "encoding": {
        "y": {
          "field": "Department Name",
          "type": "nominal",
          "sort": {
            "op": "sum",
            "field": "Actuals Amount",
            "order": "descending"
          },
          "axis": {
            "ticks": false,
            "grid": false,
            "domain": false,
            "labelColor": "black",
            "labelFontSize": 11,
            "labelFontWeight": "bold"
          }
        }
      },
      "layer": [
        {
          "description": "Budget Amount",
          "mark": {
            "type": "bar",
            "tooltip": true,
            "size": {
              "expr": "bandwidth('y') * widthBudget"
            }
          },
          "encoding": {
            "x": {
              "field": "Budget Amount",
              "type": "quantitative",
              "axis": {
                "format": "#,##0,. K",
                "formatType": "pbiFormat"
              }
            },
            "color": {
              "value": {
                "expr": "pbiColor(0)"
              },
              "legend": {
                "symbolSize": 0,
                "symbolType": "circle"
              }
            },
            "tooltip": [
              {
                "field": "Department Name"
              },
              {
                "field": "Forecast Amount",
                "format": "$,0.",
                "formatType": "pbiFormat"
              },
              {
                "field": "Actuals Amount",
                "format": "$,0.",
                "formatType": "pbiFormat"
              },
              {
                "field": "Budget Amount",
                "format": "$,0.",
                "formatType": "pbiFormat"
              },
              {
                "field": "Actuals-to-Forecast Ratio",
                "format": ".0%"
              },
              {
                "field": "Actuals-to-Budget Ratio",
                "format": ".0%"
              }
            ]
          }
        },
        {
          "description": "Forecast Amount",
          "mark": {
            "type": "bar",
            "tooltip": true,
            "size": {
              "expr": "bandwidth('y') * widthForecast"
            }
          },
          "encoding": {
            "x": {
              "field": "Forecast Amount",
              "type": "quantitative",
              "axis": {
                "format": "#,##0,. K",
                "formatType": "pbiFormat"
              }
            },
            "color": {
              "value": {
                "expr": "pbiColor(4)"
              },
              "legend": {
                "symbolSize": 0,
                "symbolType": "circle"
              }
            },
            "tooltip": [
              {
                "field": "Department Name"
              },
              {
                "field": "Forecast Amount",
                "format": "$,0.",
                "formatType": "pbiFormat"
              },
              {
                "field": "Actuals Amount",
                "format": "$,0.",
                "formatType": "pbiFormat"
              },
              {
                "field": "Budget Amount",
                "format": "$,0.",
                "formatType": "pbiFormat"
              },
              {
                "field": "Actuals-to-Forecast Ratio",
                "format": ".0%"
              },
              {
                "field": "Actuals-to-Budget Ratio",
                "format": ".0%"
              }
            ]
          }
        },
        {
          "description": "Actuals Amount",
          "mark": {
            "type": "bar",
            "tooltip": true,
            "size": {
              "expr": "bandwidth('y') * widthActual"
            }
          },
          "encoding": {
            "x": {
              "field": "Actuals Amount",
              "type": "quantitative",
              "axis": {
                "format": "#,##0,. K",
                "formatType": "pbiFormat"
              }
            },
            "color": {
              "value": {
                "expr": "pbiColor(7)"
              },
              "legend": {
                "symbolSize": 0,
                "symbolType": "circle"
              }
            },
            "tooltip": [
              {
                "field": "Department Name"
              },
              {
                "field": "Forecast Amount",
                "format": "$,0.",
                "formatType": "pbiFormat"
              },
              {
                "field": "Actuals Amount",
                "format": "$,0.",
                "formatType": "pbiFormat"
              },
              {
                "field": "Budget Amount",
                "format": "$,0.",
                "formatType": "pbiFormat"
              },
              {
                "field": "Actuals-to-Forecast Ratio",
                "format": ".0%"
              },
              {
                "field": "Actuals-to-Budget Ratio",
                "format": ".0%"
              }
            ]
          }
        }
      ]
    },
    {
      "height": 20,
      "width": 500,
      "data": {
        "values": [
          {
            "legend_id": 3,
            "legend_size": 1,
            "legend_label": "Actual"
          },
          {
            "legend_id": 2,
            "legend_size": 1,
            "legend_label": "Forecast"
          },
          {
            "legend_id": 1,
            "legend_size": 1,
            "legend_label": "Budget"
          }
        ]
      },
      "mark": {
        "type": "arc",
        "radius": 0
      },
      "encoding": {
        "theta": {
          "field": "legend_size",
          "type": "nominal"
        },
        "color": {
          "field": "legend_label",
          "type": "nominal",
          "scale": {
            "domain": [
              "Actual",
              "Forecast",
              "Budget"
            ],
            "range": [
              {"expr": "pbiColor(7)"},
              {"expr": "pbiColor(4)"},
              {"expr": "pbiColor(0)"}
            ]
          },
          "legend": {
            "orient": "bottom",
            "direction": "horizontal",
            "title": null,
            "offset": -30,
            "labelColor": "black",
            "labelFont": "Segoe UI",
            "labelFontSize": 12,
            "labelFontStyle": "italic",
            "symbolSize": 100,
            "symbolType": "circle"
          }
        }
      }
    }
  ]
}

I had a bit of time to try this week - hope it’s OK!

I wanted to try this with a single mark, which is also hopefully OK… :sweat_smile:. I also wanted to give the new pbiFormat changes in 1.5 a try (to auto-format the axis labels to thousands).

image

Spec + config as follows:

  "data": {"name": "dataset"},
  "title": {
    "anchor": "start",
    "text": "Deneb Workout 05",
    "fontSize": 18,
    "subtitle": "Bullet Chart with Custom Legend",
    "subtitleFontStyle": "italic"
  },
  "transform": [
    {
      "calculate": "datum['Actual'] / datum['Forecast']",
      "as": "a2f_ratio"
    },
    {
      "calculate": "datum['Actual'] / datum['Budget']",
      "as": "a2b_ratio"
    },
    {
      "fold": [
        "Actual",
        "Forecast",
        "Budget"
      ],
      "as": ["category", "measure"]
    },
    {
      "window": [
        {
          "op": "row_number",
          "as": "category_order"
        }
      ],
      "groupby": ["__row__"]
    }
  ],
  "mark": {
    "type": "bar",
    "tooltip": true
  },
  "encoding": {
    "x": {
      "field": "measure",
      "type": "quantitative",
      "stack": false,
      "axis": {
        "title": null,
        "labelExpr": "pbiFormat(datum.value, '#,0', {value: 1000})"
      }
    },
    "y": {
      "field": "Department Name",
      "scale": {"padding": 0.2},
      "sort": {
        "op": "sum",
        "field": "Actual",
        "order": "descending"
      },
      "axis": {"title": null}
    },
    "size": {
      "field": "category_order",
      "sort": {
        "field": "category_order"
      },
      "legend": null,
      "scale": {
        "range": [
          {
            "expr": "bandwidth('y') * 0.2"
          },
          {"expr": "bandwidth('y')"}
        ]
      }
    },
    "order": {
      "field": "category_order",
      "sort": "descending"
    },
    "color": {
      "field": "category",
      "scale": {
        "range": [
          {"expr": "pbiColor(0)"},
          {"expr": "pbiColor(4)"},
          {"expr": "pbiColor(7)"}
        ]
      },
      "sort": null,
      "legend": {
        "orient": "bottom",
        "title": null
      }
    },
    "tooltip": [
      {"field": "Department Name"},
      {
        "field": "Forecast",
        "format": "#,0",
        "formatType": "pbiFormat"
      },
      {
        "field": "Actual",
        "format": "#,0",
        "formatType": "pbiFormat"
      },
      {
        "field": "Budget",
        "format": "#,0",
        "formatType": "pbiFormat"
      },
      {
        "field": "a2f_ratio",
        "title": "Actual-to-Forecast Ratio",
        "format": "0%",
        "formatType": "pbiFormat"
      },
      {
        "field": "a2b_ratio",
        "title": "Actual-to-Budget Ratio",
        "format": "0%",
        "formatType": "pbiFormat"
      }
    ]
  },
  "config": {
    "view": {"stroke": "transparent"},
    "font": "Segoe UI",
    "axis": {
      "ticks": false,
      "grid": false,
      "domain": false,
      "labelFontSize": 12
    },
    "axisQuantitative": {
      "grid": true,
      "ticks": true,
      "domain": true,
      "labelFlush": false
    },
    "axisX": {"labelPadding": 5},
    "axisY": {"labelPadding": 10},
    "legend": {
      "labelFont": "Segoe UI",
      "labelFontSize": 12,
      "labelFontStyle": "italic",
      "symbolType": "circle"
    }
  }
}

EDNA Deneb Workout 05 - DM-P.pbix (1.3 MB)

4 Likes

The creator/guru/expert gives a masterclass! Thanks so much for your contribution and effort … absolutely (of course) a single visual is OK; better in fact, as part of my motivation for this workout was to illustrate what had to be done (at least what I thought had to be done) to get a legend to appear when using multiple measures. Now I see another, cleaner method. Thanks @dm-p!

1 Like

Hello, I really wanted to give this a try! And I spent more time than I care to admit to try and solve it :wink:
I relied heavily on the great video Creating a Bullet Chart Custom Visual Using Deneb for Power BI, and for the legend on Deneb Custom Legends.
But still I could not reproduce everything as I wanted.
In particular, the additional mark layered for the legend created an undefined data point that appears on the chart and I cannot understand how to get rid of. And this also makes the sort property unusable… Also, I struggle with the D3 axis format - I tried to have it the same as the example with xxx k but could not get there.
Last but not least, I could not figure out how to get the dash grid set to solid without altering my code - I set the property to [1,1] but it provokes a series of alterations and the tooltip gets reverted to something close to “content”.

Anyway, with all this… here is what I could do. Thanks for the excellent exercise!!!

I am really curious to see the other solutions!!! :slight_smile:

Here’s the code:

Spec

{
“width”: 600,
“height”: {“step”: 45},
“title”: {
“anchor”: “start”,
“text”: “Deneb Workout 05”,
“fontSize”: 20,
“fontWeight”: “bold”,
“subtitle”: “Bullet Chart with Custom Legend”,
“subtitleFontSize”: 15,
“subtitleFontStyle”: “italic”
},
“data”: {“name”: “dataset”},
“params”: [
{
“name”: “sizeActual”,
“value”: 0.3
},
{“name”: “sizeBudget”, “value”: 1},
{
“name”: “sizeForecast”,
“value”: 0.6
}
],
“transform”: [
{
“calculate”: “datum[‘Sum of Actuals Amount’] / datum[‘Sum of Forecast Amount’]”,
“as”: “Actual_To_Forecast_Ratio”
},
{
“calculate”: “datum[‘Sum of Actuals Amount’] / datum[‘Sum of Budget Amount’]”,
“as”: “Actual_To_Budget_Ratio”
}
],
“layer”: [
{
“name”: “LEGEND”,
“data”: {
“values”: [
{
“legend_id”: 1,
“legend_size”: 1,
“legend_label”: “Actual”
},
{
“legend_id”: 2,
“legend_size”: 1,
“legend_label”: “Forecast”
},
{
“legend_id”: 3,
“legend_size”: 1,
“legend_label”: “Budget”
}
]
},
“mark”: {
“type”: “bar”,
“opacity”: 0
},
“encoding”: {
“color”: {
“field”: “legend_label”,
“type”: “nominal”,
“scale”: {
“domain”: [
“Actual”,
“Forecast”,
“Budget”
],
“range”: [
{“expr”: “pbiColor(6)”},
{“expr”: “pbiColor(4)”},
{“expr”: “pbiColor(0)”}
]
},
“legend”: {
“orient”: “bottom-left”,
“direction”: “horizontal”,
“title”: null,
“offset”: -50,
“labelColor”: “black”,
“labelFont”: “Segoe UI”,
“labelFontSize”: 12,
“labelFontStyle”: “italic”,
“symbolSize”: 200,
“symbolType”: “circle”
}
}
}
},
{
“layer”: [
{
“mark”: {
“type”: “bar”,
“opacity”: 0.3,
“tooltip”: true,
“size”: {
“expr”: " bandwidth(‘y’)*sizeBudget"
}
},
“encoding”: {
“x”: {
“field”: “Sum of Budget Amount”
},
“color”: {
“value”: {
“expr”: “pbiColor(0)”
}
}
}
},
{
“mark”: {
“type”: “bar”,
“tooltip”: true,
“size”: {
“expr”: " bandwidth(‘y’)*sizeBudget"
}
},
“encoding”: {
“x”: {
“field”: “Sum of Budget Amount__highlight”
},
“color”: {
“value”: {
“expr”: “pbiColor(0)”
}
},
“opacity”: {
“condition”: {
“test”: {
“field”: “selected”,
“equal”: “off”
},
“value”: 0
},
“value”: 1
}
}
},
{
“mark”: {
“type”: “bar”,
“opacity”: 0.3,
“tooltip”: true,
“size”: {
“expr”: " bandwidth(‘y’)*sizeForecast"
}
},
“encoding”: {
“x”: {
“field”: “Sum of Forecast Amount”
},
“color”: {
“value”: {
“expr”: “pbiColor(4)”
}
}
}
},
{
“mark”: {
“type”: “bar”,
“tooltip”: true,
“size”: {
“expr”: " bandwidth(‘y’)*sizeForecast"
}
},
“encoding”: {
“x”: {
“field”: “Sum of Forecast Amount__highlight”
},
“color”: {
“value”: {
“expr”: “pbiColor(4)”
}
},
“opacity”: {
“condition”: {
“test”: {
“field”: “selected”,
“equal”: “off”
},
“value”: 0
},
“value”: 1
}
}
},
{
“mark”: {
“type”: “bar”,
“opacity”: 0.3,
“tooltip”: true,
“size”: {
“expr”: " bandwidth(‘y’)*sizeActual"
}
},
“encoding”: {
“x”: {
“field”: “Sum of Actuals Amount”
},
“color”: {
“value”: {
“expr”: “pbiColor(6)”
}
}
}
},
{
“mark”: {
“type”: “bar”,
“tooltip”: {
“content”: “data”
},
“size”: {
“expr”: " bandwidth(‘y’)*sizeActual"
}
},
“encoding”: {
“x”: {
“field”: “Sum of Actuals Amount__highlight”
},
“opacity”: {
“condition”: {
“test”: {
“field”: “selected”,
“equal”: “off”
},
“value”: 0
},
“value”: 1
},
“color”: {
“value”: {
“expr”: “pbiColor(6)”
}
}
}
}
]
}
],
“encoding”: {
“y”: {
“field”: “Department Name”,
“type”: “nominal”,
“title”: “”,
“sort”: {
“field”: “Sum of Actuals Amount”,
“order”: “descending”
}
},
“x”: {
“type”: “quantitative”,
“axis”: {
“title”: “”,
“format”: “s”,
“grid”: true,
“tickCount”: 8,
“gridColor”: “black”
}
},
“tooltip”: [
{
“field”: “Department Name”,
“title”: “Department”
},
{
“field”: “Sum of Forecast Amount”,
“title”: “Forecast”,
“format”: “,”
},
{
“field”: “Sum of Actuals Amount”,
“title”: “Actuals”,
“format”: “,”
},
{
“field”: “Sum of Budget Amount”,
“title”: “Budget”,
“format”: “,”
},
{
“field”: “Actual_To_Forecast_Ratio”,
“title”: “Actuals-to-Forecast ratio”,
“format”: “.0%”
},
{
“field”: “Actual_To_Budget_Ratio”,
“title”: “Actuals-to-Budget ratio”,
“format”: “.0%”
}
]
}
}

2 Likes

Here’s my solution to this workout, where I used several Deneb/Vega-Lite features, including:
General:
• title block complete with subtitle
• used a vconcat block to concatenate vertically a bullet chart (layered bar chart) and a legend (arc chart)

Bar Chart:
• used a transform block to extend the dataset by performing in-visual calculations to calculate the A2F and A2B ratios
• used shared Y-encoding block (outside the layer block) to allow alignment of the marks withing the layer (more below)
• used a layer block with 3 BAR marks of varying colour and height, 1 each for actuals, forecast, and budget
• used the Deneb extension of Vega-Lite to access the 1st, 5th, and 8th colours of the current Power BI theme
• used a custom tooltip for each bar presenting actuals, forecast, budget, A2F ration, and A2B ratios, all with Power BI formatting

Legend:
• used a custom data block with hard-coded values for the legend items
• used an ARC mark (set the radius to zero to display only the legend)
• set the legend to display horizontally, to use circle symbols, and italic label font; adjusted the legend X-Y position to suit

Here’s the code:

{
  "title": {
    "anchor": "start",
    "align": "left",
    "offset": 10,
    "text": "Deneb Workout 05",
    "font": "Verdana",
    "fontSize": 16,
    "fontWeight": "bold",
    "fontStyle": "normal",
    "subtitle": "Bullet Chart with Custom Legend",
    "subtitleFont": "Verdana",
    "subtitleFontSize": 12,
    "subtitleFontWeight": "normal",
    "subtitleFontStyle": "italic"
  },
  "data": {"name": "dataset"},
  "vconcat": [
    {
      "name": "BULLET_CHART",
      "height": 220,
      "width": 580,
      "transform": [
        {
          "calculate": "datum['Actuals Amount'] / datum['Forecast Amount']",
          "as": "Actuals-to-Forecast Ratio"
        },
        {
          "calculate": "datum['Actuals Amount'] / datum['Budget Amount']",
          "as": "Actuals-to-Budget Ratio"
        }
      ],
      "encoding": {
        "y": {
          "field": "Department Name",
          "type": "ordinal",
          "title": null,
          "sort": {
            "op": "sum",
            "field": "Actuals Amount",
            "order": "descending"
          },
          "axis": {
            "ticks": false,
            "domain": false
          }
        },
        "x": {
          "type": "quantitative",
          "title": null,
          "axis": {
            "format": "#,##0,. K",
            "formatType": "pbiFormat"
          }
        }
      },
      "layer": [
        {
          "name": "BUDGET",
          "mark": {
            "type": "bar",
            "tooltip": true,
            "color": {
              "expr": "pbiColor(0)"
            },
            "height": {"band": 0.9}
          },
          "encoding": {
            "x": {
              "field": "Budget Amount"
            },
            "tooltip": [
              {
                "field": "Department Name",
                "title": "Department"
              },
              {
                "field": "Budget Amount",
                "title": "Budget",
                "formatType": "pbiFormat",
                "format": "#,##0."
              },
              {
                "field": "Actuals Amount",
                "title": "Actuals",
                "formatType": "pbiFormat",
                "format": "#,##0."
              },
              {
                "field": "Forecast Amount",
                "title": "Forecast",
                "formatType": "pbiFormat",
                "format": "#,##0."
              },
              {
                "field": "Actuals-to-Forecast Ratio",
                "format": "#%",
                "formatType": "pbiFormat"
              },
              {
                "field": "Actuals-to-Budget Ratio",
                "format": "#%",
                "formatType": "pbiFormat"
              }
            ]
          }
        },
        {
          "name": "FORECAST",
          "mark": {
            "type": "bar",
            "tooltip": true,
            "color": {
              "expr": "pbiColor(4)"
            },
            "height": {"band": 0.5}
          },
          "encoding": {
            "x": {
              "field": "Forecast Amount"
            },
            "tooltip": [
              {
                "field": "Department Name",
                "title": "Department"
              },
              {
                "field": "Forecast Amount",
                "title": "Forecast",
                "formatType": "pbiFormat",
                "format": "#,##0."
              },
              {
                "field": "Actuals Amount",
                "title": "Actuals",
                "formatType": "pbiFormat",
                "format": "#,##0."
              },
              {
                "field": "Budget Amount",
                "title": "Budget",
                "formatType": "pbiFormat",
                "format": "#,##0."
              },
              {
                "field": "Actuals-to-Forecast Ratio",
                "format": "#%",
                "formatType": "pbiFormat"
              },
              {
                "field": "Actuals-to-Budget Ratio",
                "format": "#%",
                "formatType": "pbiFormat"
              }
            ]
          }
        },
        {
          "name": "ACTUALS",
          "mark": {
            "type": "bar",
            "tooltip": true,
            "color": {
              "expr": "pbiColor(7)"
            },
            "height": {"band": 0.2}
          },
          "encoding": {
            "x": {
              "field": "Actuals Amount"
            },
            "tooltip": [
              {
                "field": "Department Name",
                "title": "Department"
              },
              {
                "field": "Actuals Amount",
                "title": "Actuals",
                "formatType": "pbiFormat",
                "format": "#,##0."
              },
              {
                "field": "Forecast Amount",
                "title": "Forecast",
                "formatType": "pbiFormat",
                "format": "#,##0."
              },
              {
                "field": "Budget Amount",
                "title": "Budget",
                "formatType": "pbiFormat",
                "format": "#,##0."
              },
              {
                "field": "Actuals-to-Forecast Ratio",
                "format": "#%",
                "formatType": "pbiFormat"
              },
              {
                "field": "Actuals-to-Budget Ratio",
                "format": "#%",
                "formatType": "pbiFormat"
              }
            ]
          }
        }
      ]
    },
    {
      "name": "LEGEND",
      "height": 20,
      "width": 580,
      "data": {
        "values": [
          {
            "legend_id": 1,
            "legend_size": 1,
            "legend_label": "Actual"
          },
          {
            "legend_id": 2,
            "legend_size": 1,
            "legend_label": "Forecast"
          },
          {
            "legend_id": 3,
            "legend_size": 1,
            "legend_label": "Budget"
          }
        ]
      },
      "mark": {
        "type": "arc",
        "radius": 0
      },
      "encoding": {
        "theta": {
          "field": "legend_size",
          "type": "quantitative"
        },
        "color": {
          "field": "legend_label",
          "type": "nominal",
          "scale": {
            "domain": [
              "Actual",
              "Forecast",
              "Budget"
            ],
            "range": [
              {"expr": "pbiColor(7)"},
              {"expr": "pbiColor(4)"},
              {"expr": "pbiColor(0)"}
            ]
          },
          "legend": {
            "direction": "horizontal",
            "title": null,
            "orient": "none",
            "legendX": -60,
            "legendY": 250,
            "labelColor": "black",
            "labelFont": "Segoe UI",
            "labelFontSize": 12,
            "labelFontStyle": "italic",
            "symbolSize": 200,
            "symbolType": "circle"
          }
        }
      }
    }
  ]
}

Congratulations to all who participated, and good luck.
Greg
Deneb Workout 05 - Bullet Chart with Custom Legend.pbix (1.4 MB)