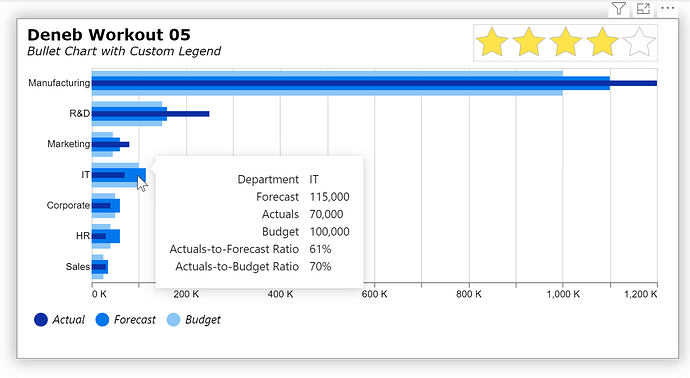
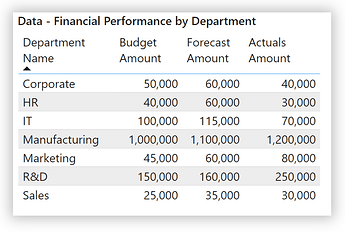
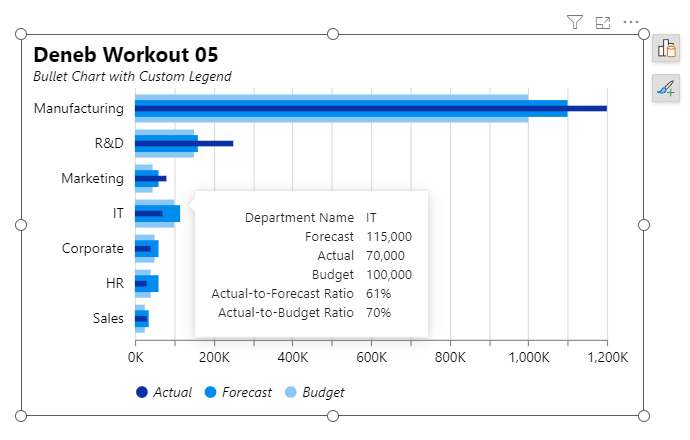
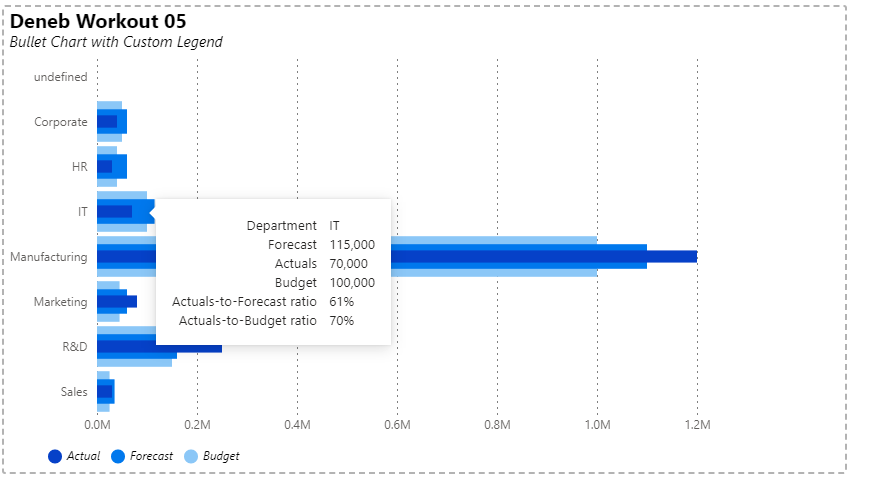
The bullet chart is straightforward. The custom legend is straightforward. Combining the two is challenging. And, so far, it’s eaten my lunch: when vconcat-ing the the two I lose the bullet chart:
I’m looking foreward to seeing how this is worked out.
{
  "title": {
    "anchor": "start",
    "align": "left",
    "offset": 10,
    "color": "black",
    "text": "Deneb Workout 05",
    "font": "Segoe UI",
    "fontSize": 14,
    "fontWeight": "bold",
    "fontStyle": "normal",
    "subtitle": "Bullet Chart with Custom Legend",
    "subtitleFont": "Segoe UI",
    "subtitleFontSize": 12,
    "subtitleFontWeight": "normal",
    "subtitleFontStyle": "italic",
    "subtitleColor": "#605E5C",
    "subtitlePadding": 10
  },
  "height": 250,
  "width": 500,
  "data": {"name": "dataset"},
  "transform": [
    {
      "calculate": "datum['Actuals Amount'] / datum['Forecast Amount']",
      "as": "Actuals-to-Forecast Ratio"
    },
    {
      "calculate": "datum['Actuals Amount'] / datum['Budget Amount']",
      "as": "Actuals-to-Budget Ratio"
    }
  ],
  "params": [
    {
      "name": "widthBudget",
      "value": 0.8
    },
    {
      "name": "widthActual",
      "value": 0.2
    },
    {
      "name": "widthForecast",
      "value": 0.5
    }
  ],
  "encoding": {
    "y": {
      "field": "Department Name",
      "type": "nominal",
      "sort": {
        "op": "sum",
        "field": "Actuals Amount",
        "order": "descending"
      },
      "axis": {
        "ticks": false,
        "grid": false,
        "domain": false,
        "labelColor": "black",
        "labelFontSize": 11,
        "labelFontWeight": "bold"
      }
    }
  },
  "layer": [
    {
      "description": "Budget Amount",
      "mark": {
        "type": "bar",
        "tooltip": true,
        "size": {
          "expr": "bandwidth('y') * widthBudget"
        }
      },
      "encoding": {
        "x": {
          "field": "Budget Amount",
          "type": "quantitative",
          "axis": {
            "format": "#,##0,. K",
            "formatType": "pbiFormat"
          }
        },
        "color": {
          "value": {
            "expr": "pbiColor(0)"
          }
        },
        "tooltip": [
          {"field": "Department Name"},
          {
            "field": "Forecast Amount",
            "format": "$,0.",
            "formatType": "pbiFormat"
          },
          {
            "field": "Actuals Amount",
            "format": "$,0.",
            "formatType": "pbiFormat"
          },
          {
            "field": "Budget Amount",
            "format": "$,0.",
            "formatType": "pbiFormat"
          },
          {
            "field": "Actuals-to-Forecast Ratio",
            "format": ".0%"
          },
          {
            "field": "Actuals-to-Budget Ratio",
            "format": ".0%"
          }
        ]
      }
    },
    {
      "description": "Forecast Amount",
      "mark": {
        "type": "bar",
        "tooltip": true,
        "size": {
          "expr": "bandwidth('y') * widthForecast"
        }
      },
      "encoding": {
        "x": {
          "field": "Forecast Amount",
          "type": "quantitative",
          "axis": {
            "format": "#,##0,. K",
            "formatType": "pbiFormat"
          }
        },
        "color": {
          "value": {
            "expr": "pbiColor(4)"
          }
        },
        "tooltip": [
          {"field": "Department Name"},
          {
            "field": "Forecast Amount",
            "format": "$,0.",
            "formatType": "pbiFormat"
          },
          {
            "field": "Actuals Amount",
            "format": "$,0.",
            "formatType": "pbiFormat"
          },
          {
            "field": "Budget Amount",
            "format": "$,0.",
            "formatType": "pbiFormat"
          },
          {
            "field": "Actuals-to-Forecast Ratio",
            "format": ".0%"
          },
          {
            "field": "Actuals-to-Budget Ratio",
            "format": ".0%"
          }
        ]
      }
    },
    {
      "description": "Actuals Amount",
      "mark": {
        "type": "bar",
        "tooltip": true,
        "size": {
          "expr": "bandwidth('y') * widthActual"
        }
      },
      "encoding": {
        "x": {
          "field": "Actuals Amount",
          "type": "quantitative",
          "axis": {
            "format": "#,##0,. K",
            "formatType": "pbiFormat"
          }
        },
        "color": {
          "value": {
            "expr": "pbiColor(7)"
          }
        },
        "tooltip": [
          {"field": "Department Name"},
          {
            "field": "Forecast Amount",
            "format": "$,0.",
            "formatType": "pbiFormat"
          },
          {
            "field": "Actuals Amount",
            "format": "$,0.",
            "formatType": "pbiFormat"
          },
          {
            "field": "Budget Amount",
            "format": "$,0.",
            "formatType": "pbiFormat"
          },
          {
            "field": "Actuals-to-Forecast Ratio",
            "format": ".0%"
          },
          {
            "field": "Actuals-to-Budget Ratio",
            "format": ".0%"
          }
        ]
      }
    }
  ]
}
and with the custom legend:
{
  "title": {
    "anchor": "start",
    "align": "left",
    "offset": 10,
    "color": "black",
    "text": "Deneb Workout 05",
    "font": "Segoe UI",
    "fontSize": 14,
    "fontWeight": "bold",
    "fontStyle": "normal",
    "subtitle": "Bullet Chart with Custom Legend",
    "subtitleFont": "Segoe UI",
    "subtitleFontSize": 12,
    "subtitleFontWeight": "normal",
    "subtitleFontStyle": "italic",
    "subtitleColor": "#605E5C",
    "subtitlePadding": 10
  },
  "data": {"name": "dataset"},
  "transform": [
    {
      "calculate": "datum['Actuals Amount'] / datum['Forecast Amount']",
      "as": "Actuals-to-Forecast Ratio"
    },
    {
      "calculate": "datum['Actuals Amount'] / datum['Budget Amount']",
      "as": "Actuals-to-Budget Ratio"
    }
  ],
  "params": [
    {
      "name": "widthBudget",
      "value": 0.8
    },
    {
      "name": "widthActual",
      "value": 0.2
    },
    {
      "name": "widthForecast",
      "value": 0.5
    }
  ],
  "vconcat": [
    {
      "height": 250,
      "width": 500,
      "encoding": {
        "y": {
          "field": "Department Name",
          "type": "nominal",
          "sort": {
            "op": "sum",
            "field": "Actuals Amount",
            "order": "descending"
          },
          "axis": {
            "ticks": false,
            "grid": false,
            "domain": false,
            "labelColor": "black",
            "labelFontSize": 11,
            "labelFontWeight": "bold"
          }
        }
      },
      "layer": [
        {
          "description": "Budget Amount",
          "mark": {
            "type": "bar",
            "tooltip": true,
            "size": {
              "expr": "bandwidth('y') * widthBudget"
            }
          },
          "encoding": {
            "x": {
              "field": "Budget Amount",
              "type": "quantitative",
              "axis": {
                "format": "#,##0,. K",
                "formatType": "pbiFormat"
              }
            },
            "color": {
              "value": {
                "expr": "pbiColor(0)"
              },
              "legend": {
                "symbolSize": 0,
                "symbolType": "circle"
              }
            },
            "tooltip": [
              {
                "field": "Department Name"
              },
              {
                "field": "Forecast Amount",
                "format": "$,0.",
                "formatType": "pbiFormat"
              },
              {
                "field": "Actuals Amount",
                "format": "$,0.",
                "formatType": "pbiFormat"
              },
              {
                "field": "Budget Amount",
                "format": "$,0.",
                "formatType": "pbiFormat"
              },
              {
                "field": "Actuals-to-Forecast Ratio",
                "format": ".0%"
              },
              {
                "field": "Actuals-to-Budget Ratio",
                "format": ".0%"
              }
            ]
          }
        },
        {
          "description": "Forecast Amount",
          "mark": {
            "type": "bar",
            "tooltip": true,
            "size": {
              "expr": "bandwidth('y') * widthForecast"
            }
          },
          "encoding": {
            "x": {
              "field": "Forecast Amount",
              "type": "quantitative",
              "axis": {
                "format": "#,##0,. K",
                "formatType": "pbiFormat"
              }
            },
            "color": {
              "value": {
                "expr": "pbiColor(4)"
              },
              "legend": {
                "symbolSize": 0,
                "symbolType": "circle"
              }
            },
            "tooltip": [
              {
                "field": "Department Name"
              },
              {
                "field": "Forecast Amount",
                "format": "$,0.",
                "formatType": "pbiFormat"
              },
              {
                "field": "Actuals Amount",
                "format": "$,0.",
                "formatType": "pbiFormat"
              },
              {
                "field": "Budget Amount",
                "format": "$,0.",
                "formatType": "pbiFormat"
              },
              {
                "field": "Actuals-to-Forecast Ratio",
                "format": ".0%"
              },
              {
                "field": "Actuals-to-Budget Ratio",
                "format": ".0%"
              }
            ]
          }
        },
        {
          "description": "Actuals Amount",
          "mark": {
            "type": "bar",
            "tooltip": true,
            "size": {
              "expr": "bandwidth('y') * widthActual"
            }
          },
          "encoding": {
            "x": {
              "field": "Actuals Amount",
              "type": "quantitative",
              "axis": {
                "format": "#,##0,. K",
                "formatType": "pbiFormat"
              }
            },
            "color": {
              "value": {
                "expr": "pbiColor(7)"
              },
              "legend": {
                "symbolSize": 0,
                "symbolType": "circle"
              }
            },
            "tooltip": [
              {
                "field": "Department Name"
              },
              {
                "field": "Forecast Amount",
                "format": "$,0.",
                "formatType": "pbiFormat"
              },
              {
                "field": "Actuals Amount",
                "format": "$,0.",
                "formatType": "pbiFormat"
              },
              {
                "field": "Budget Amount",
                "format": "$,0.",
                "formatType": "pbiFormat"
              },
              {
                "field": "Actuals-to-Forecast Ratio",
                "format": ".0%"
              },
              {
                "field": "Actuals-to-Budget Ratio",
                "format": ".0%"
              }
            ]
          }
        }
      ]
    },
    {
      "height": 20,
      "width": 500,
      "data": {
        "values": [
          {
            "legend_id": 3,
            "legend_size": 1,
            "legend_label": "Actual"
          },
          {
            "legend_id": 2,
            "legend_size": 1,
            "legend_label": "Forecast"
          },
          {
            "legend_id": 1,
            "legend_size": 1,
            "legend_label": "Budget"
          }
        ]
      },
      "mark": {
        "type": "arc",
        "radius": 0
      },
      "encoding": {
        "theta": {
          "field": "legend_size",
          "type": "nominal"
        },
        "color": {
          "field": "legend_label",
          "type": "nominal",
          "scale": {
            "domain": [
              "Actual",
              "Forecast",
              "Budget"
            ],
            "range": [
              {"expr": "pbiColor(7)"},
              {"expr": "pbiColor(4)"},
              {"expr": "pbiColor(0)"}
            ]
          },
          "legend": {
            "orient": "bottom",
            "direction": "horizontal",
            "title": null,
            "offset": -30,
            "labelColor": "black",
            "labelFont": "Segoe UI",
            "labelFontSize": 12,
            "labelFontStyle": "italic",
            "symbolSize": 100,
            "symbolType": "circle"
          }
        }
      }
    }
  ]
}
