The legends inherent in Deneb/Vega-Lite automatically handle most situations but can appear differently than those in other Power BI visuals. To that end, I’ve done some initial explorations on controlling legends in D/VL for two common scenarios and have the following comments:
Scenario 1 - Standard Legend
D/VL automatically generates legends taking into account the color encoding channel. By default (at least in my experience), such legends are displayed vertically at the top and to the right of the source visual. By including a legend block in the color encoding channel, for example, one can adjust the layout and position of the legend. Here’s a sample that shows the original vertical layout and an adjusted horizontal layout at the top-left of the visual container:

The D/VL code to be added to the encoding block make these adjustments is as follows:
    "color": {
      "field": "Channel",
      "type": "nominal",
	  -- *** START COMMENT - REMOVE BEFORE DEPLOYMENT ***
      "legend": {
        "orient": "top-left",
        "direction": "horizontal",
        "title": null,
        "offset": 0
      }
	  -- *** END COMMENT - REMOVE BEFORE DEPLOYMENT ***
    }
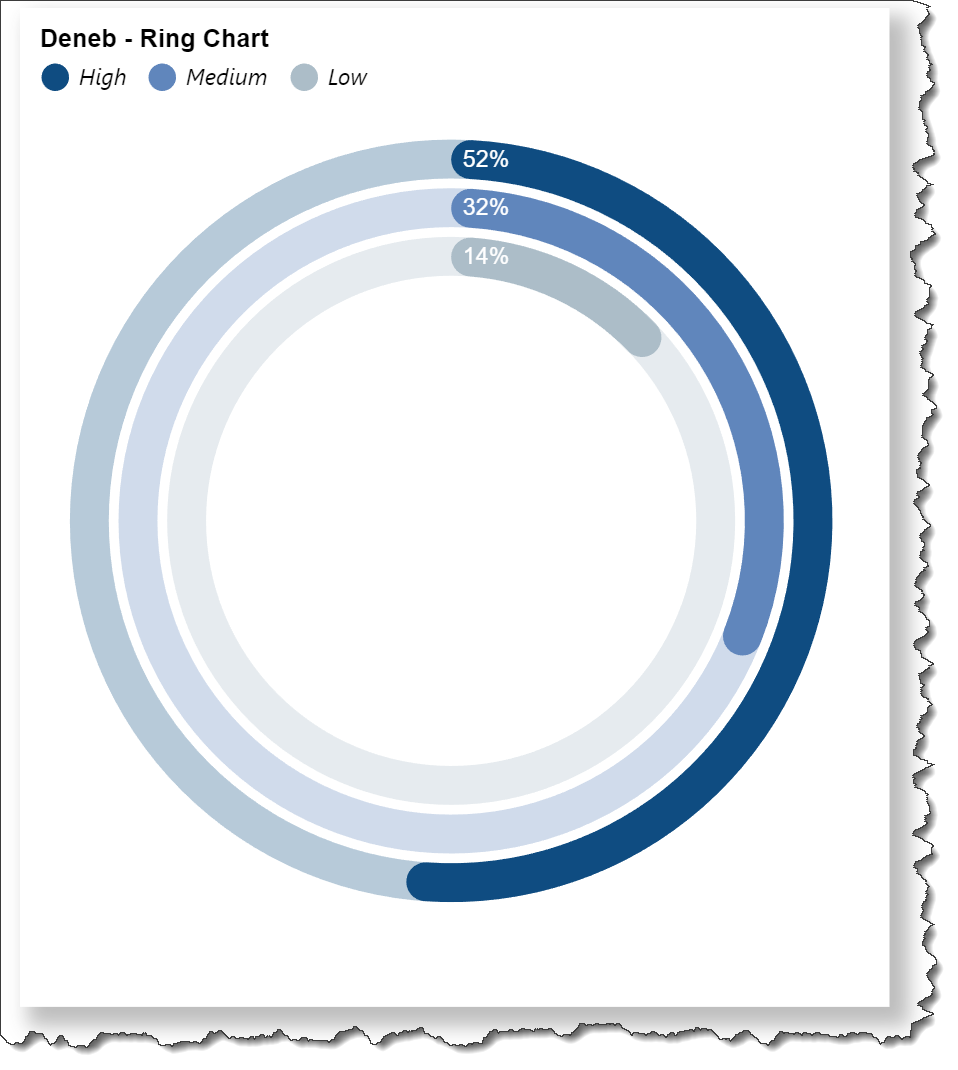
Scenario 2 - Custom Legend
When creating a multi-layered visual, the color channel may not be available in the encoding block. One way to handle this is to add a layer specifically for the legend and add:
- a custom data block within the layer with hard-coded values just for the legend labels
- an arc mark with radius of zero to make the visual appear hidden
- a scale block in the color channel with values for the legend colours
- a legend block in the color encoding channel
The D/VL code to make these adjustments is as follows:
	{
      "name": "LEGEND",
      "data": {
        "values": [
          {
            "legend_id": 1,
            "legend_size": 1,
            "legend_label": "High"
          },
          {
            "legend_id": 2,
            "legend_size": 1,
            "legend_label": "Medium"
          },
          {
            "legend_id": 3,
            "legend_size": 1,
            "legend_label": "Low"
          }
        ]
      },
      "mark": {
        "type": "arc",
        "radius": 0
      },
      "encoding": {
        "theta": {
          "field": "legend_size",
          "type": "quantitative"
        },
        "color": {
          "field": "legend_label",
          "type": "nominal",
          "scale": {
            "domain": [
              "High",
              "Medium",
              "Low"
            ],
            "range": [
              {"expr": "ring1_color"},
              {"expr": "ring2_color"},
              {"expr": "ring3_color"}
            ]
          },
          "legend": {
            "orient": "top-left",
            "direction": "horizontal",
            "title": null,
            "offset": 0,
            "labelColor": "black",
            "labelFont": "Segoe UI",
            "labelFontSize": 12,
            "labelFontStyle": "italic",
            "symbolSize": 200,
            "symbolType": "circle"
          }
        }
      }
    }
For more information on the Vega-Lite legend properties available for adjustment, refer to the Encoding | Legend section of the VL documentation:
The intent of this exercise is not to provide a complete solution for legends for finished visuals, but rather to serve as a starting point for further custom visual development.
Also included is a sample PBIX using the Enterprise DNA Practice Dataset as a demo.
NOTE: This exercise is provided as-is for information purposes only, and its use is solely at the discretion of the end user; no responsibility is assumed by the author.
Greg
Deneb Examples - Legends.pbix (1.7 MB)