Deneb Workout 01 - Line Chart with Smoothing

Summary

This text will be hidden

{
  "title": {
    "text": "Deneb Workout 01",
    "subtitle": "Line Chart with Smoothing",
    "anchor": "start",
    "align": "left",
    "fontSize": 16,
    "subtitleFontStyle": "italic",
    "subtitleFontSize": 14
  },
  "data": {"name": "dataset"},
  "mark": {
    "type": "line",
    "tooltip": true,
    "interpolate": "natural"
  },
  "encoding": {
    "x": {
      "field": "Order Date",
      "type": "temporal",
      "title": "Order Date",
      "timeUnit": "yearmonth",
      "axis": {
        "tickCount": 5,
        "grid": true
      }
    },
    "y": {
      "field": "Sum of Total Sales",
      "type": "quantitative",
      "title": "Sales",
      "scale": {"domain": [0,60000]},
      "axis": {
        "title": "Sales",
        "tickCount": 6,
        "grid": true
      }
    },
    "color": {
      "field": "Channel Name",
      "type": "nominal",
      "scale": {
        "domain": [
          "Distributor",
          "Export",
          "Wholesale"
        ],
        "range": [
          "teal",
          "black",
          "red"
        ]
      },
      "legend": {
        "orient": "top-left",
        "labelFontSize": 12,
        "offset": 10,
        "symbolType": "stroke"
      }
    }
  }
}
3 Likes

@Nayeem I see the gridline in this screenshot and in your pbix file. What are you trying to accomplish?

Paul

2 Likes

Hello Paul,
I see the gridline only for the x-axis, but not for the y-axis (vertical grid lines). I’m trying to figure out why the gridline for y-axis is not showing.

2 Likes

@Nayeem there wasn’t any coding for the x-axis. You had lines for the y-axis.

See below

“encoding”:{
“x”:{“field”: “Order Date”,
“type”: “temporal”,
“axis”: {
“grid”: true,
“tickCount”: 5
}
},
“y”: {
“field”: “Sales”,
“type”: “quantitative”,
“title”: “Sales”,
“scale”: {“domain”: [0,60000]},
“axis”: {
“grid”: true,
“tickCount”: 5
}
},

2 Likes

Got it. Thank you!

2 Likes

@Greg,

Thanks for this Deneb workout. Here’s my solution.

2 Likes

Hi, here is my solution:
image

Json File

{
“$schema”: “https://vega.github.io/schema/vega-lite/v5.json”,
“usermeta”: {
“deneb”: {
“build”: “1.4.0.0”,
“metaVersion”: 1,
“provider”: “vegaLite”,
“providerVersion”: “5.4.0”
},
“interactivity”: {
“tooltip”: true,
“contextMenu”: true,
“selection”: false,
“highlight”: false,
“dataPointLimit”: 50
},
“information”: {
“name”: “Line Chart Workout 01”,
“description”: “[No Description Provided]”,
“author”: “AAndrade”,
“uuid”: “d0b09845-becc-4185-9912-c6a3e7675c27”,
“generated”: “2023-03-23T15:45:37.756Z”
},
“dataset”: [
{
“key”: “0”,
“name”: “Channel Name”,
“description”: “”,
“type”: “text”,
“kind”: “column”
},
{
“key”: “1”,
“name”: “Order Date”,
“description”: “”,
“type”: “dateTime”,
“kind”: “column”
},
{
“key”: “2”,
“name”: “Sales”,
“description”: “”,
“type”: “numeric”,
“kind”: “measure”
}
]
},
“config”: {
“axis”: {
“ticks”: true,
“grid”: true,
“domain”: false,
“labelColor”: “#6C6966”,
“labelFontSize”: 10,
“titleFont”: “wf_standard-font, helvetica, arial, sans-serif”,
“titleColor”: “#131312”,
“titleFontSize”: 14,
“titleFontWeight”: “bold”
},
“axisX”: {“labelPadding”: 5},
“axisY”: {“labelPadding”: 10}
},
“title”: {
“text”: “Deneb Workout 01”,
“anchor”: “start”,
“fontWeight”: “bold”,
“fontSize”: 16,
“subtitle”: “Line Chart with Smoothing”,
“subtitleFontWeight”: “normal”,
“subtitleFontSize”: 12,
“subtitleFontStyle”: “italic”,
“offset”: 15
},
“width”: 500,
“height”: 300,
“data”: {“name”: “dataset”},
“layer”: [
{
“name”: “LINE”,
“mark”: {
“type”: “line”,
“interpolate”: “natural”,
“strokeWidth”: 2
},
“encoding”: {
“x”: {
“field”: “1”,
“type”: “temporal”
},
“y”: {
“field”: “2”,
“type”: “quantitative”,
“scale”: {
“domain”: [0, 60000]
},
“grid”: true
},
“color”: {
“field”: “0”,
“type”: “nominal”,
“scale”: {
“scheme”: “pbiColorNominal”
},
“legend”: {
“title”: null,
“orient”: “top-left”
}
}
}
}
]
}

3 Likes

Thanks for the workout Greg. Here is my submission.

{
  "$schema": "https://vega.github.io/schema/vega-lite/v5.json",
  "usermeta": {
    "deneb": {
      "build": "1.4.0.0",
      "metaVersion": 1,
      "provider": "vegaLite",
      "providerVersion": "5.4.0"
    },
    "interactivity": {
      "tooltip": true,
      "contextMenu": true,
      "selection": false,
      "highlight": false,
      "dataPointLimit": 50
    },
    "information": {
      "name": "Bramow-Deneb Workout 01",
      "description": "Enterprise DNA Deneb Workout 01",
      "author": "Jessica Bramow",
      "uuid": "e030a4b8-3e13-4ae6-85de-cfaaed892e80",
      "generated": "2023-03-24T15:18:52.838Z"
    },
    "dataset": [
      {
        "key": "__0__",
        "name": "Channel Name",
        "description": "",
        "type": "text",
        "kind": "column"
      },
      {
        "key": "__1__",
        "name": "Sales",
        "description": "",
        "type": "numeric",
        "kind": "column"
      },
      {
        "key": "__2__",
        "name": "Order Date",
        "description": "",
        "type": "dateTime",
        "kind": "column"
      }
    ]
  },
  "config": {
    "autosize": {
      "type": "fit",
      "contains": "padding"
    },
    "legend": {
      "title": null,
      "orient": "top-left",
      "symbolType": "stroke",
      "labelColor": "black",
      "symbolDirection": "vertical"
    }
  },
  "title": {
    "text": "Deneb Workout 01",
    "subtitle": "Line Chart with Smoothing",
    "anchor": "start",
    "align": "left",
    "font": "Verdana",
    "fontSize": 16,
    "fontWeight": "bold",
    "offset": 10
  },
  "data": {"name": "dataset"},
  "mark": {
    "type": "line",
    "interpolate": "natural"
  },
  "encoding": {
    "x": {
      "field": "__2__",
      "type": "temporal"
    },
    "y": {
      "field": "__1__",
      "type": "quantitative",
      "scale": {"domain": [0, 60000]},
      "axis": {"tickCount": 5}
    },
    "color": {
      "field": "__0__",
      "scale": {
        "range": [
          "#000000",
          "#0db8ab",
          "#f46568"
        ]
      }
    }
  }
}
1 Like

Thanks Greg!
This is my first deneb visual and I’m looking forward to the next workouts!

Is it possible to autosize the legend of a visual (for the visual it is possible to resize, the title and other text not, but maybe the legend is possible somehow?)

JSON
{
  "title": {
    "anchor": "start",
    "text": "Deneb Workout 01",
    "subtitle": "Line Chart with Smoothing",
    "subtitleFontStyle": "italic"
  },
  "data": {"name": "dataset"},
  "mark": {
    "type": "line",
    "interpolate": "natural"
  },
  "encoding": {
    "x": {
      "field": "Order Date",
      "type": "temporal",
      "axis": {
        "grid": true
      }
    },
    "y": {
      "field": "# Total Sales",
      "title": "Sales",
      "type": "quantitative",
      "scale": {"domain": [0,60000]},
      "axis": {
        "tickCount": 5,
        "gridDash": [0,0]
      }
    },
    "color": {
      "field": "Channel Name",
      "type": "nominal",
      "scale": {"scheme": "pbiColorNominal"},
      "legend": {
        "orient": "top-left",
        "direction": "vertical",
        "symbolType": "stroke"
      }
    }
  }
}

2 Likes

@Greg ,

Thanks – fantastic kickoff exercise! For some reason, I’m having trouble getting the Y axis title to show up, but otherwise happy with how this turned out.

Summary
{
  "data": {"name": "dataset"},
  "mark": {
    "type": "line",
    "interpolate": "natural",
    "tension": 0
  },
  "title": {
    "text": "Deneb Workout 01",
    "anchor": "start",
    "align": "left",
    "font": "Segoe UI",
    "fontSize": 16,
    "fontWeight": "bold",
    "subtitle": "Line Chart with Smoothing",
    "subtitleFontSize": 14,
    "offset": 12
  },
  "encoding": {
    "x": {
      "field": "Order Date",
      "type": "temporal"
    },
    "y": {
      "field": "Total Sales",
      "type": "quantitative",
      "title": "Sales",
      "scale": {"domain": [0, 60000]},
      "axis": {
        "tickCount": 5,
        "title": "Sales"
      }
    },
    "color": {
      "field": "Channel Name",
      "type": "nominal",
      "scale": {"scheme": "Category10"},
      "legend": {
        "title": null,
        "orient": "top-left",
        "symbolType": "stroke"
      }
    }
  }
}
1 Like

Hi @BrianJ. I think Vega-Lite got confused with the title property being specified twice; when the 2nd was deleted, I got this:

Note as well that you do not need to specify a title at all if the desired title is the same as the field name, as Vega-Lite will use the field name by default.

Hope this helps.
Greg

2 Likes

@Greg ,

Thanks! - that makes perfect sense, but when I removed the second “tltle” spec and re-ran the code, I’m still not getting the x or y axis labels. :rage:

Deneb Workout 1 - Line Chart with Smoothing.pbix (9.1 MB)

Click for code

{
  "data": {"name": "dataset"},
  "mark": {
    "type": "line",
    "interpolate": "natural",
    "tension": 0
  },
  "title": {
    "text": "Deneb Workout 01",
    "anchor": "start",
    "align": "left",
    "font": "Segoe UI",
    "fontSize": 16,
    "fontWeight": "bold",
    "subtitle": "Line Chart with Smoothing",
    "subtitleFontSize": 14,
    "offset": 12
  },
  "encoding": {
    "x": {
      "field": "Order Date",
      "type": "temporal"
    },
    "y": {
      "field": "Total Sales",
      "type": "quantitative",
      "title": "Sales",
      "scale": {"domain": [0, 60000]},
      "axis": {"tickCount": 5}
    },
    "color": {
      "field": "Channel Name",
      "type": "nominal",
      "scale": {"scheme": "Category10"},
      "legend": {
        "title": null,
        "orient": "top-left",
        "symbolType": "stroke"
      }
    }
  }
}
1 Like

Hi @BrianJ. Yeah, I thought it might. Your code actually ran fine on my PBIX before I made any changes (just noted the doubling 'cuz it was there…), so I’m guessing there must be else something in your file; post your PBIX and I’ll have a look.
Greg

Edit: Oops … just noticed you did attach it … hold please …

1 Like

Hi @BrianJ. Its the default code in the Config tab; just delete it and “presto”.

Greg

2 Likes

@Greg ,

Thanks - BINGO!

But where did that config code come from? I definitely didn’t put it there…

  • Brian

1 Like

Hi @BrianJ. A new Deneb visual is defaulted with some config code. I most often delete it, but it is sometimes quite helpful, as we’ll see in some future workouts.
Greg

2 Likes

Hi had some troubles as well, but as I had same problems in near past I guess it could be the problem and have tried to delete each part of code step by step to understand what each part was doing.

I’m looking forward for the next challenge:)

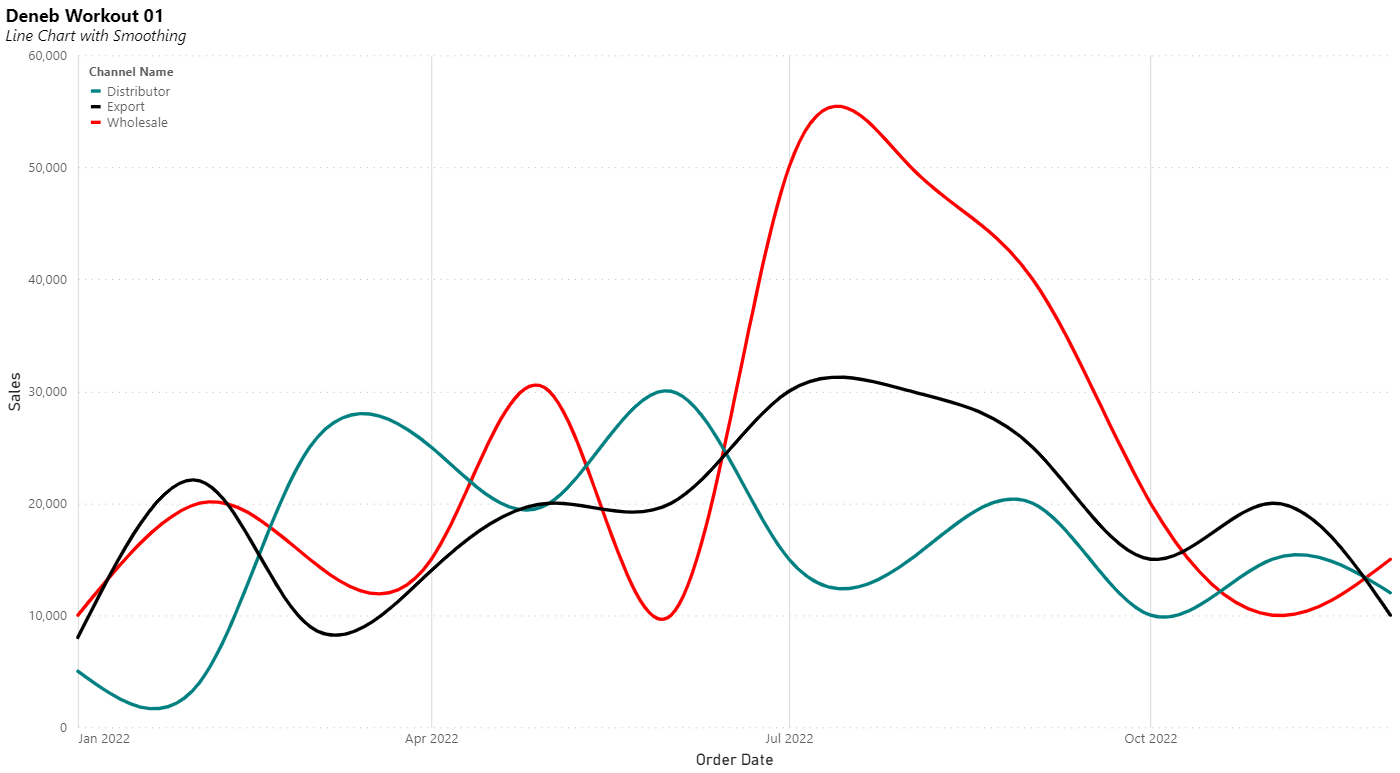
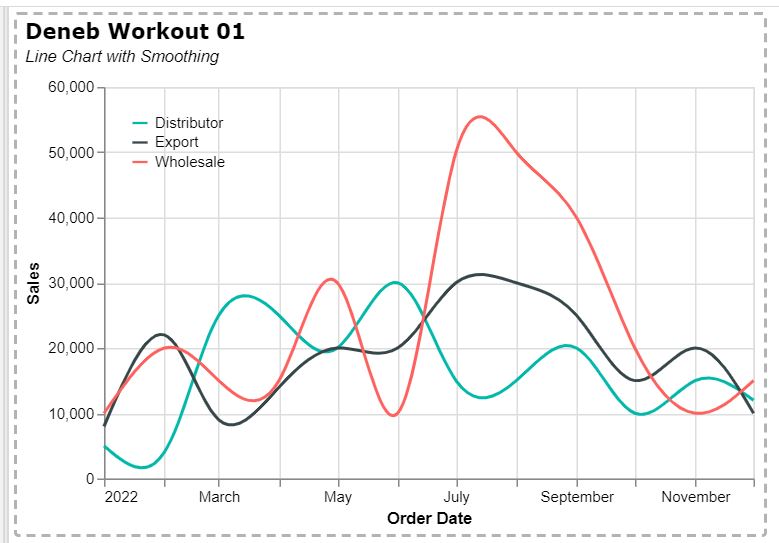
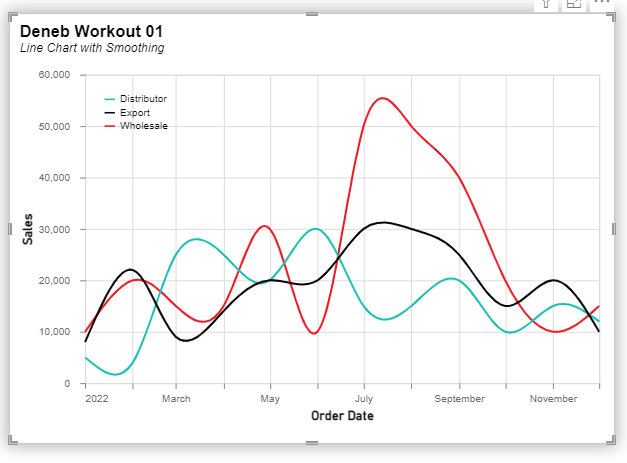
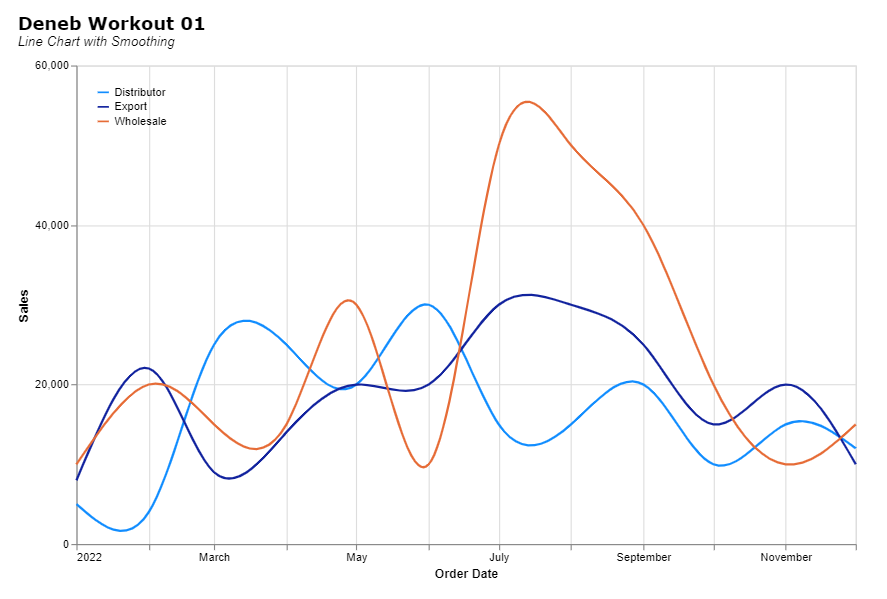
Here’s my solution to this workout:
Deneb Workout 01 - Line Chart with Smoothing - Solution Screenshot #1

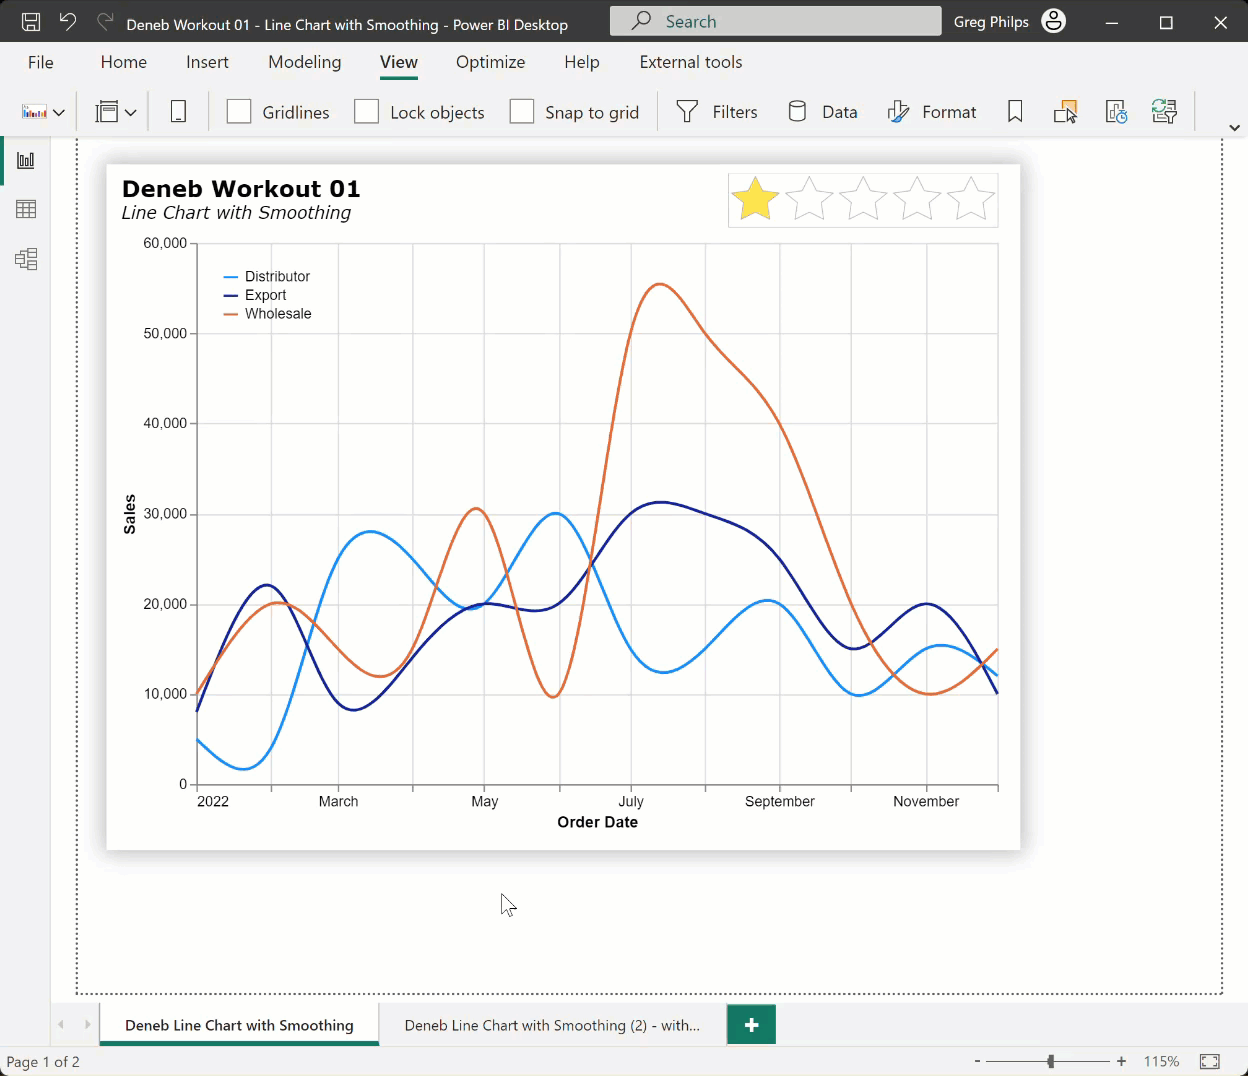
In it, I used several Deneb/Vega-Lite features, including:

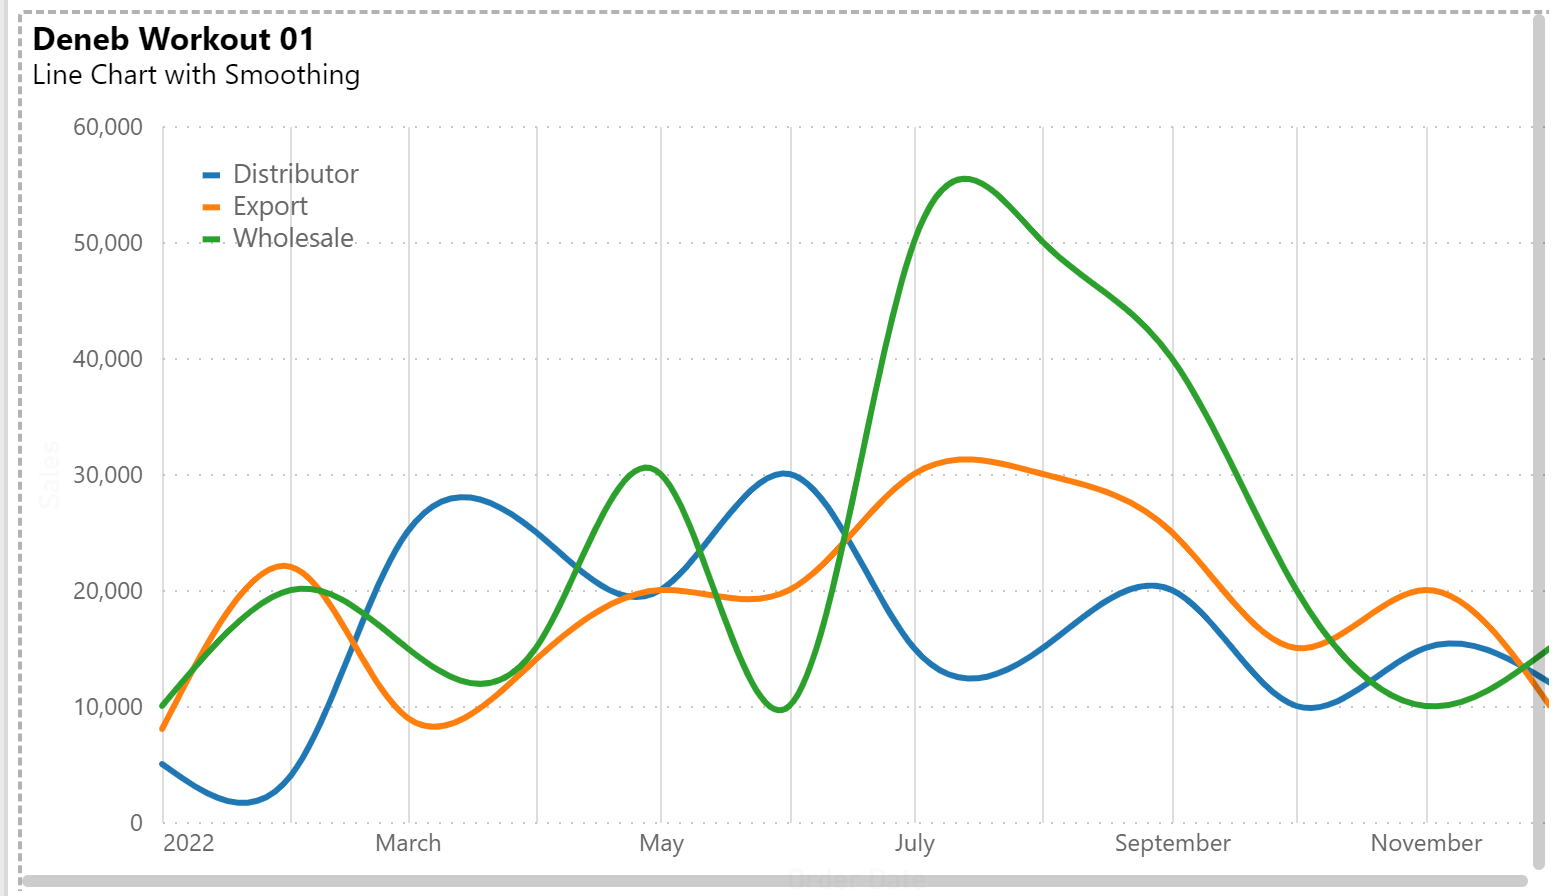
  • • title block complete with subtitle
  • • line smoothing (via the “interpolate” mark property) using the “natural” algorithm
  • • set the range of the Y-axis to 0-60000 (via the “scale/domain” block in the Y-axis encoding
  • • set the approximate number of Y-axis ticks (via the “axis/tickCount” block in the Y-axis encoding)
  • • set the lines to use the current Power BI theme colours (via the “scale/scheme” block in the color encoding)
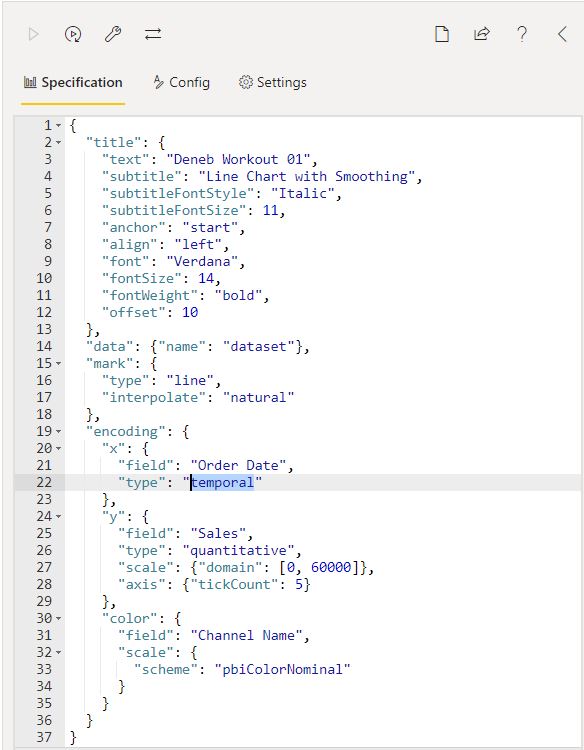
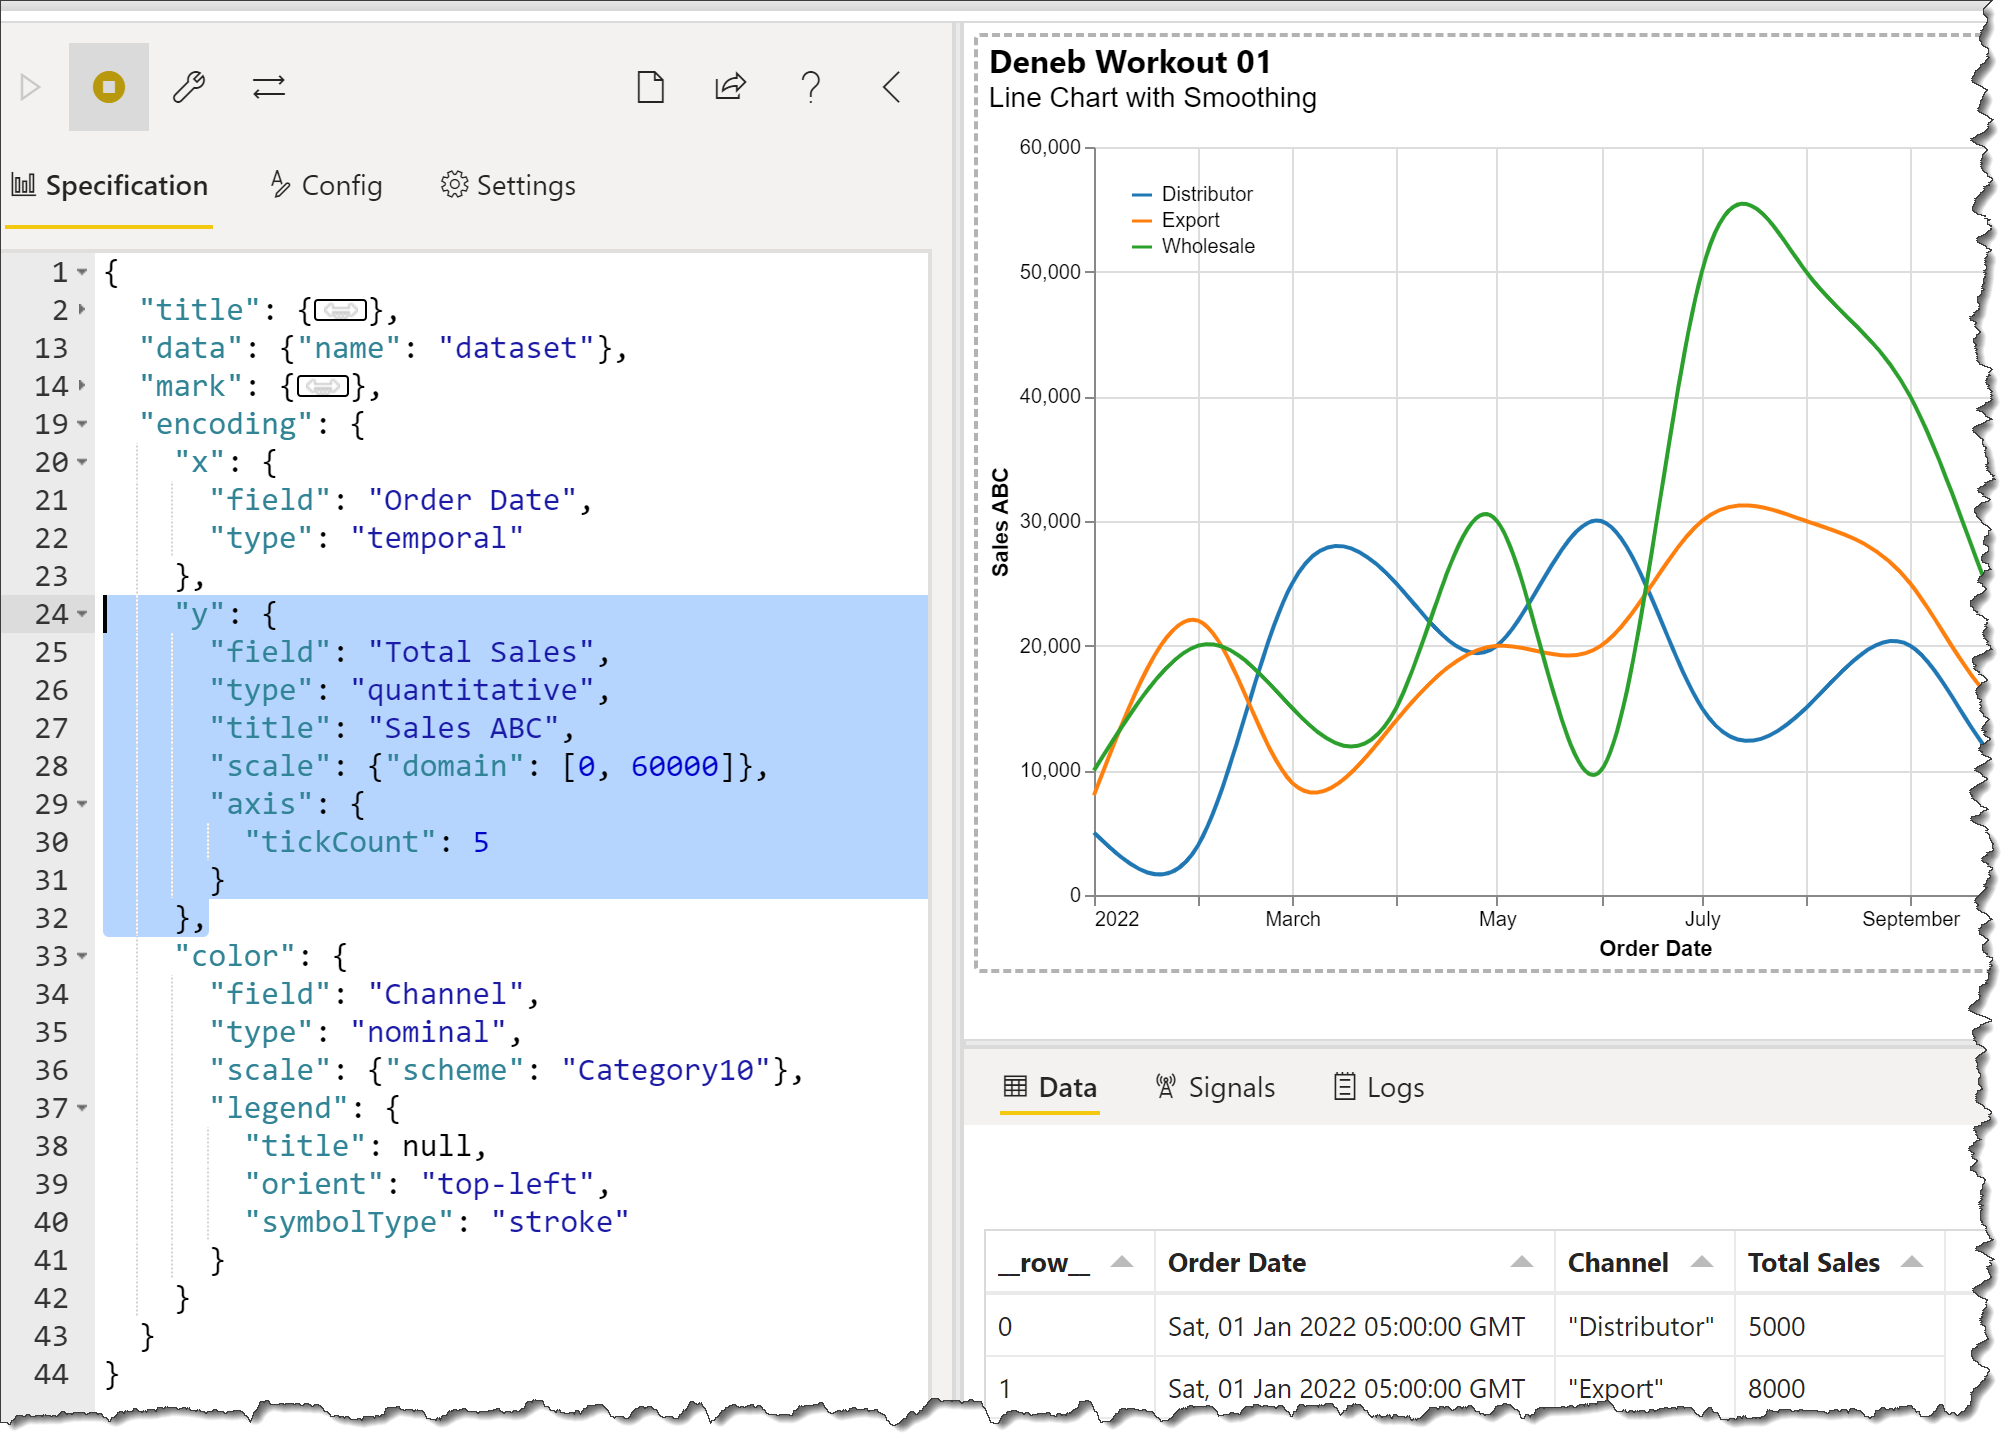
Here’s the code:

{
  "title": {
    "anchor": "start",
    "align": "left",
    "offset": 10,
    "text": "Deneb Workout 01",
    "font": "Verdana",
    "fontSize": 16,
    "fontWeight": "bold",
    "fontStyle": "normal",
    "subtitle": "Line Chart with Smoothing",
    "subtitleFont": "Verdana",
    "subtitleFontSize": 12,
    "subtitleFontWeight": "normal",
    "subtitleFontStyle": "italic"
  },
  "data": {"name": "dataset"},
  "mark": {
    "type": "line",
    "interpolate": "natural"
  },
  "encoding": {
    "x": {
      "field": "Order Date",
      "type": "temporal"
    },
    "y": {
      "field": "Sales",
      "type": "quantitative",
      "scale": {"domain": [0, 60000]},
      "axis": {"tickCount": 5}
    },
    "color": {
      "field": "Channel",
      "scale": {
        "scheme": "pbiColorNominal"
      }
    }
  }
}

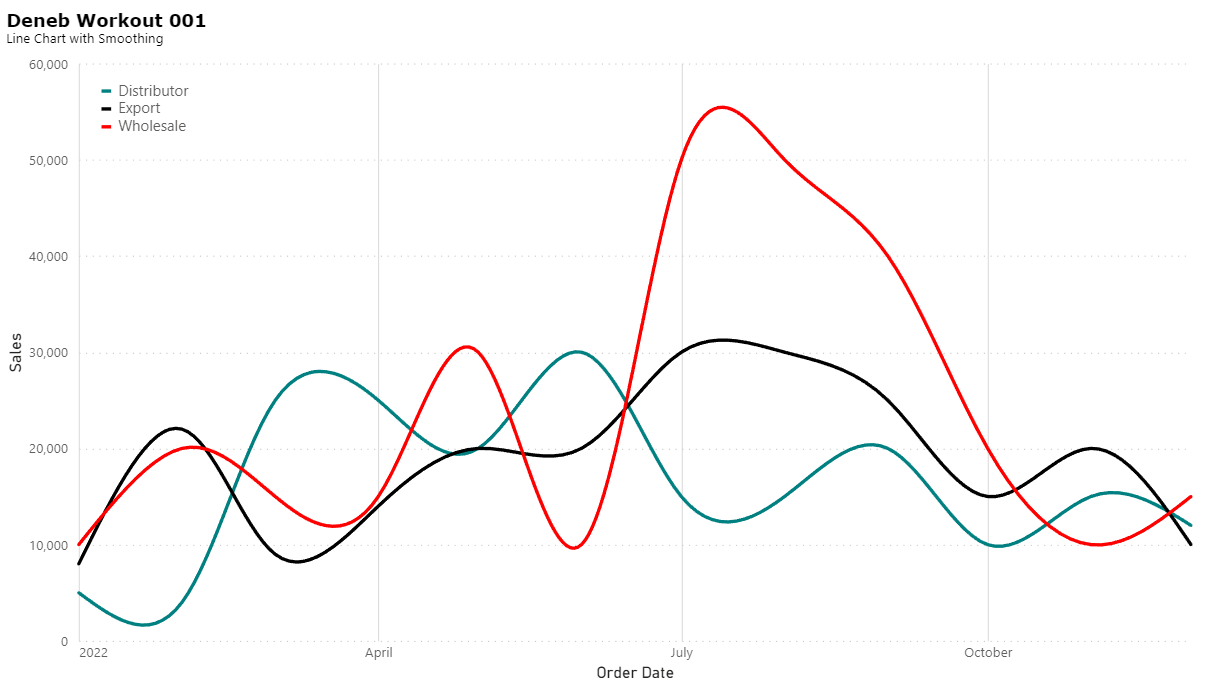
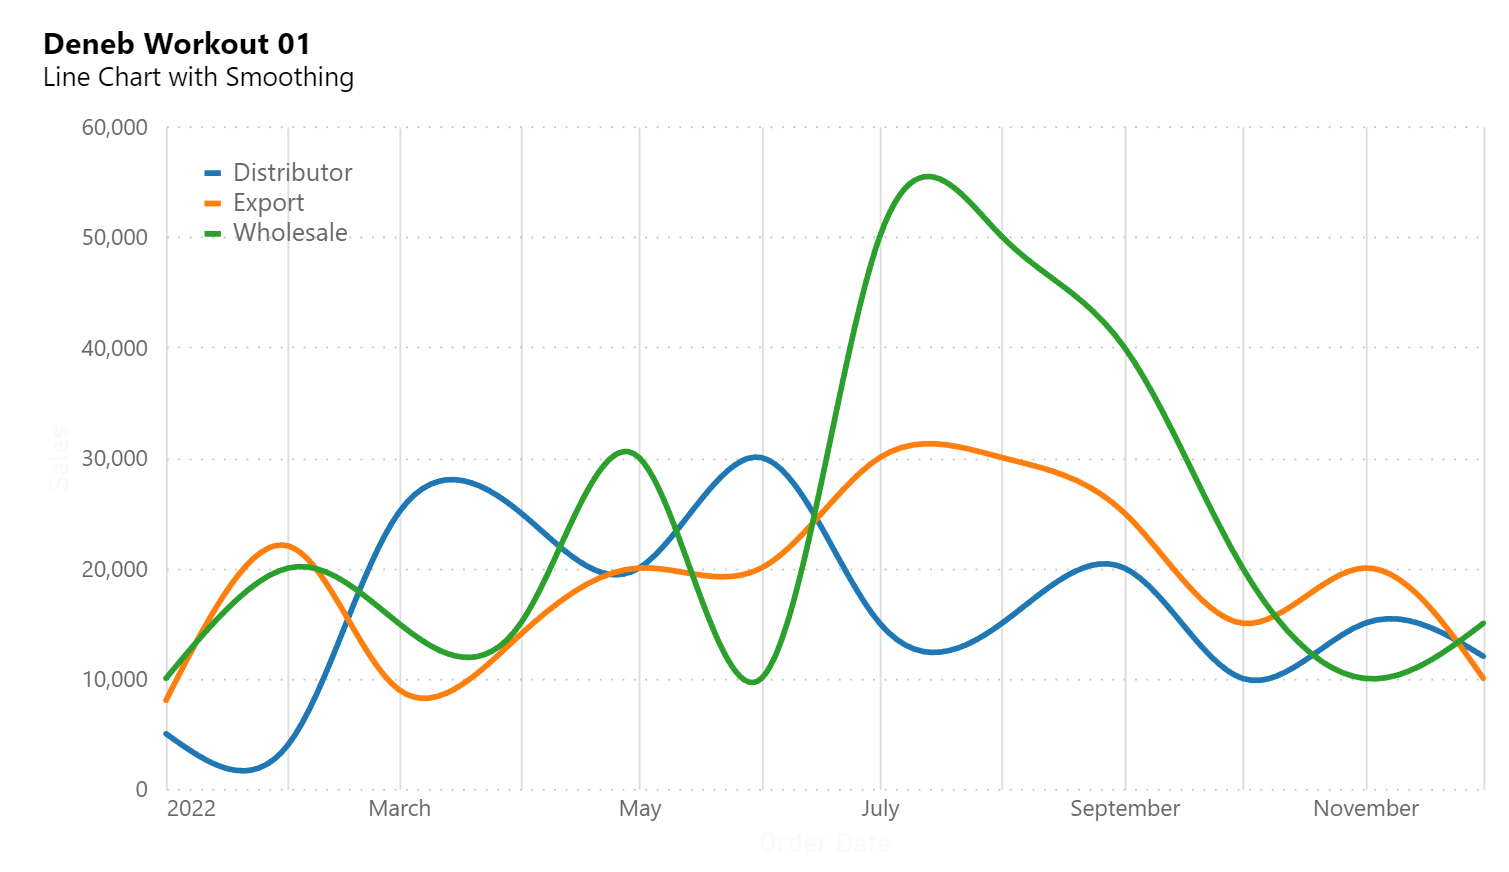
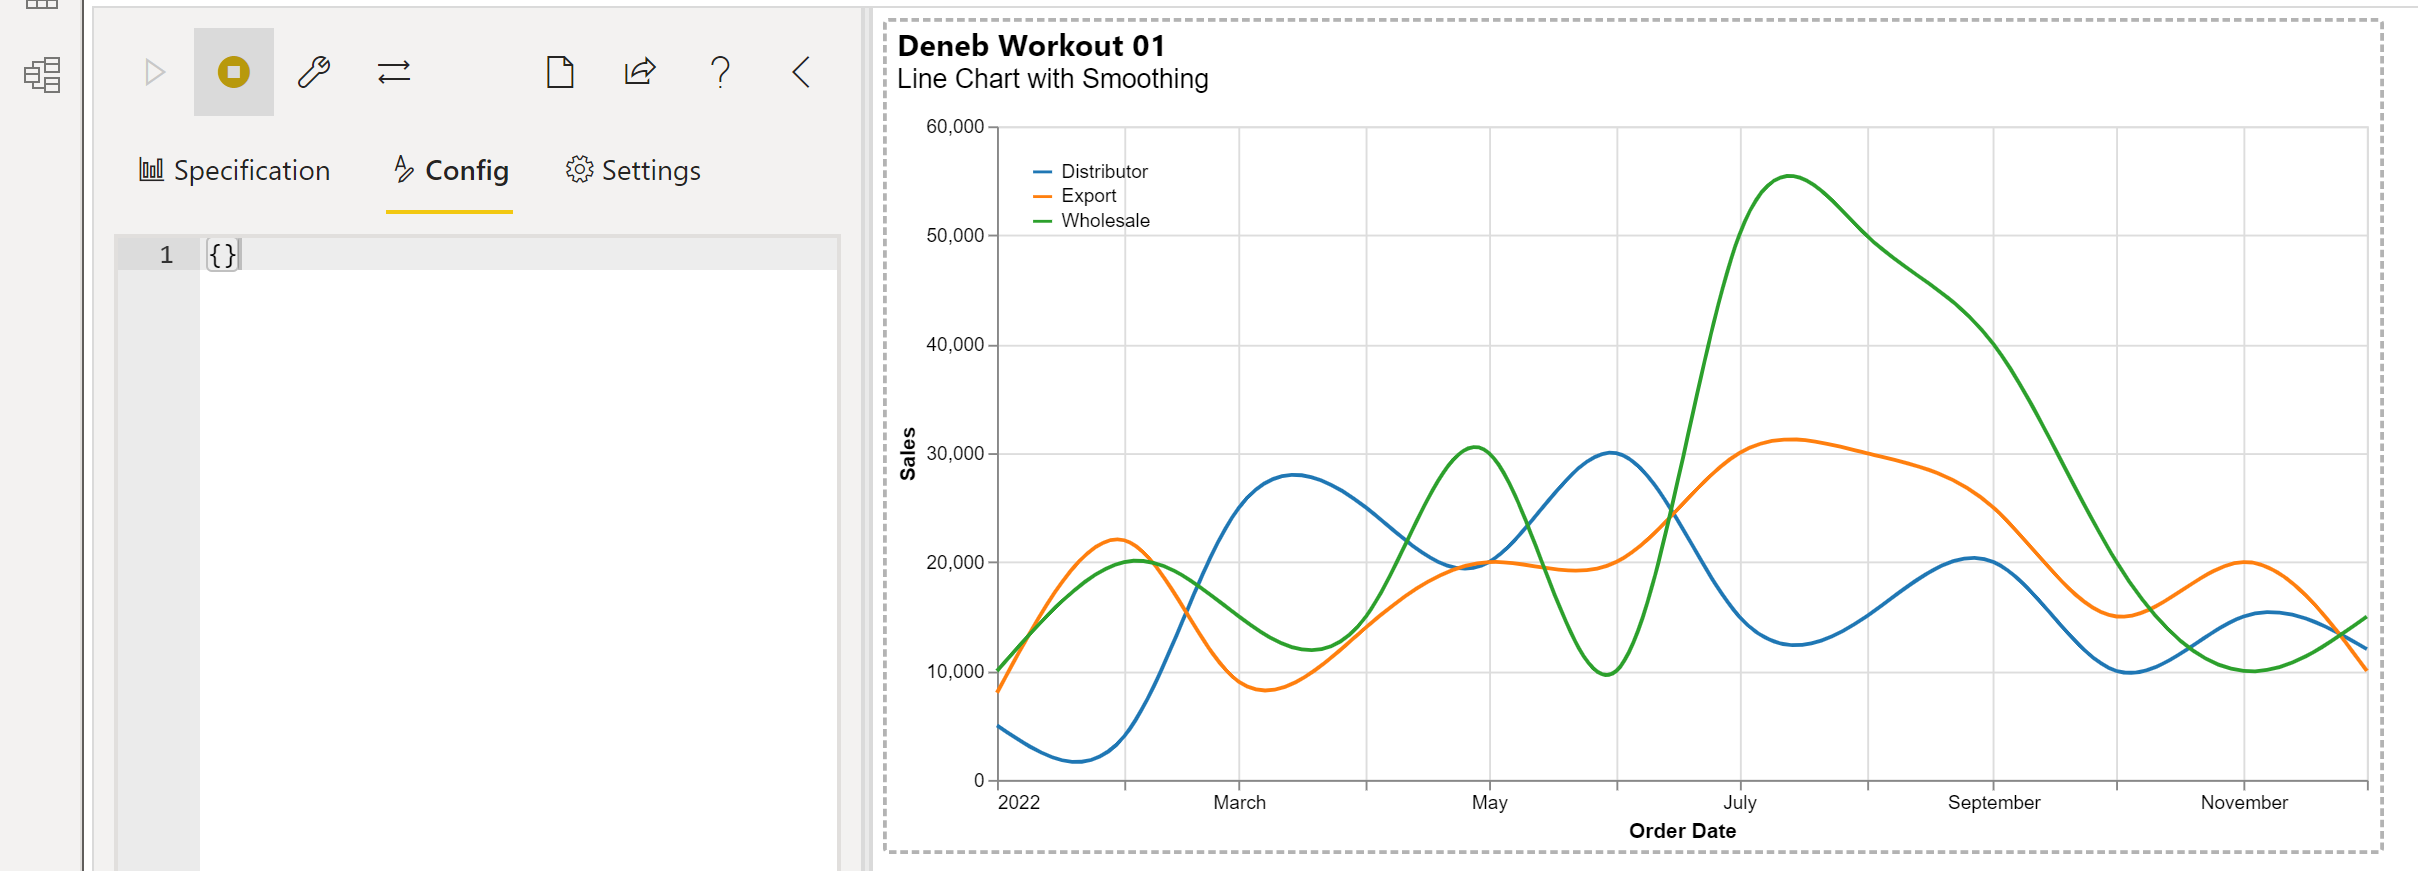
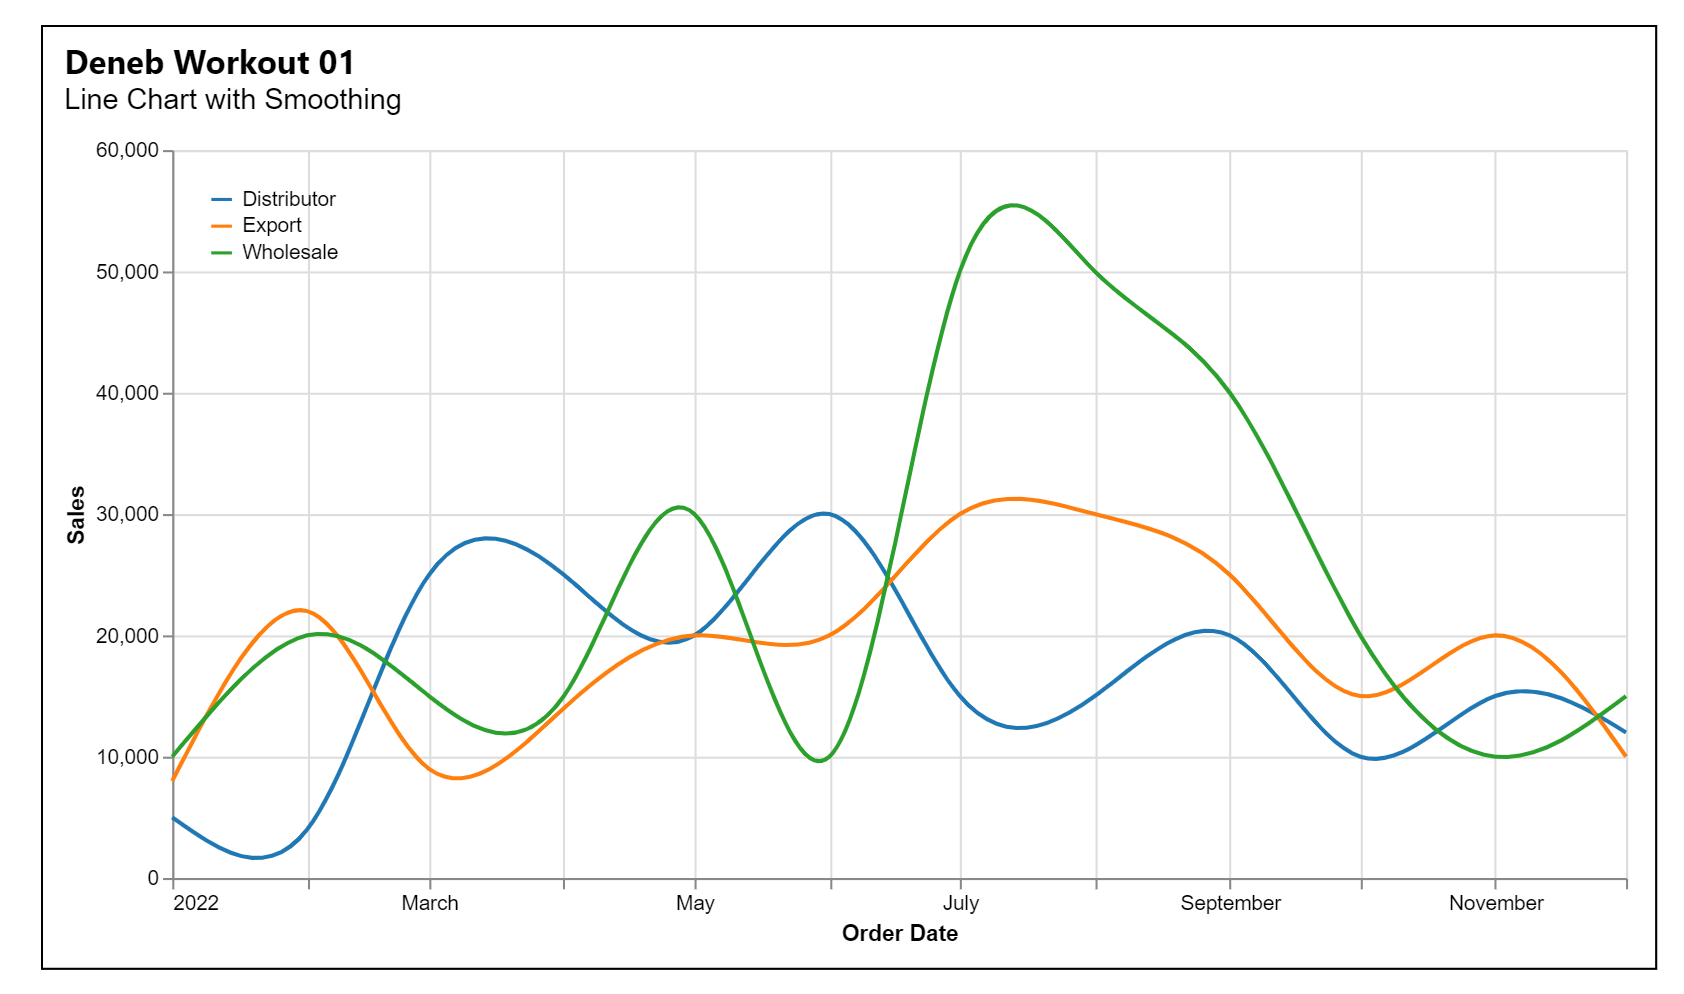
There are many line smoothing algorithms that can be used as well as “natural”, some of which also use a “tension” property. To showcase, here’s an alternate solution using screen widgets to present the “interpolate” and “tension” options:
Deneb Workout 01 - Line Chart with Smoothing - Solution Screenshot #2

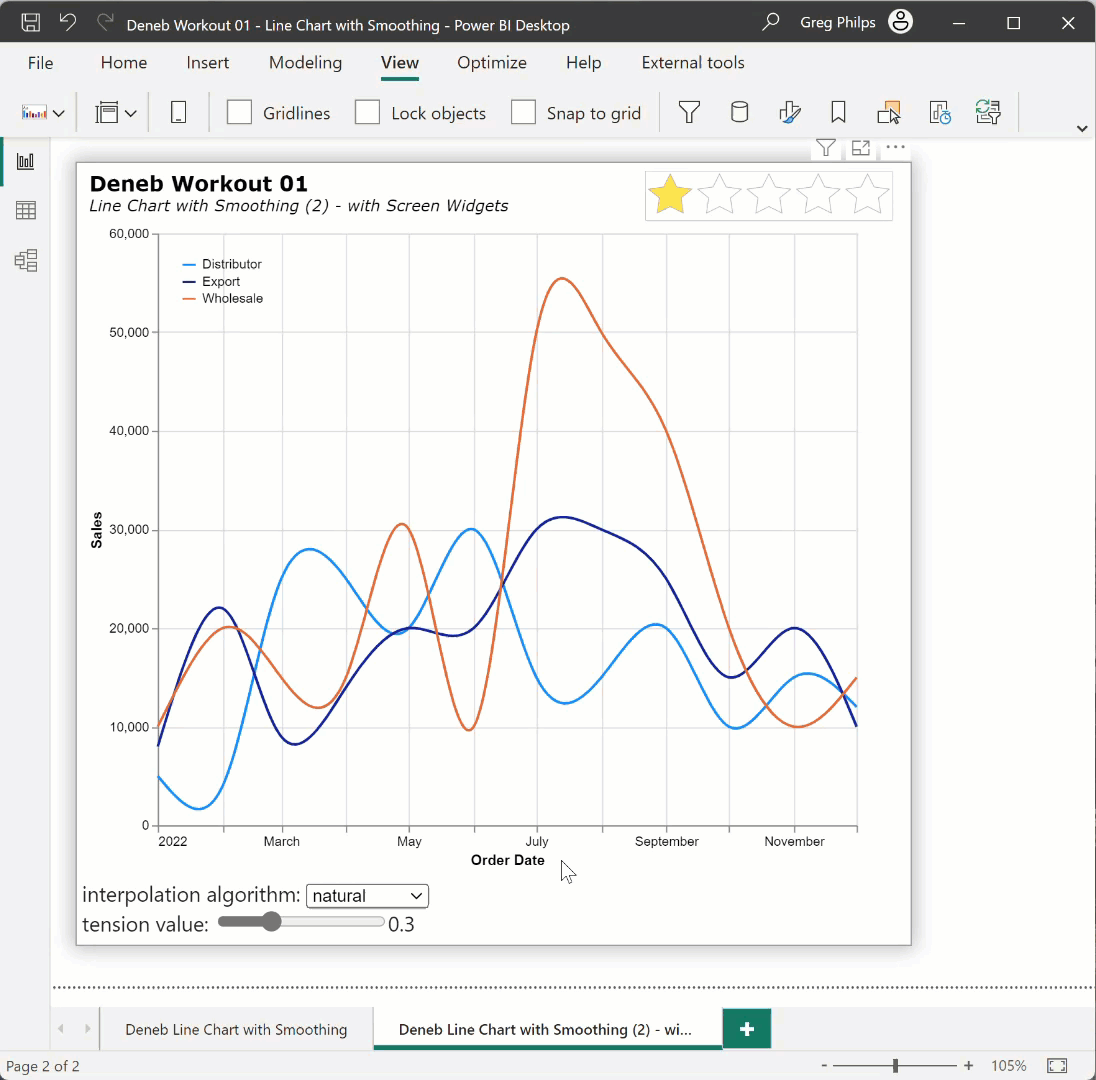
Here’s the code for the alternate solution:

{
  "title": {
    "anchor": "start",
    "align": "left",
    "offset": 10,
    "text": "Deneb Workout 01",
    "font": "Verdana",
    "fontSize": 16,
    "fontWeight": "bold",
    "fontStyle": "normal",
    "subtitle": "Line Chart with Smoothing (2) -  with Screen Widgets",
    "subtitleFont": "Verdana",
    "subtitleFontSize": 12,
    "subtitleFontWeight": "normal",
    "subtitleFontStyle": "italic"
  },
  "data": {"name": "dataset"},
  "height": 540,
  "width": 600,
  "params": [
    {
      "name": "_interpolate",
      "value": "cardinal",
      "bind": {
        "input": "select",
        "options": [
          "basis",
          "cardinal",
          "catmull-rom",
          "linear",
          "monotone",
          "natural",
          "step",
          "step-after",
          "step-before"
        ],
        "name": "interpolation algorithm: "
      }
    },
    {
      "name": "_tension",
      "value": 0.3,
      "bind": {
        "input": "range",
        "min": 0,
        "max": 1,
        "step": 0.1,
        "name": "tension value: "
      }
    }
  ],
  "mark": {
    "type": "line",
    "interpolate": {
      "expr": "_interpolate"
    },
    "tension": {"expr": "_tension"}
  },
  "encoding": {
    "x": {
      "field": "Order Date",
      "type": "temporal"
    },
    "y": {
      "field": "Sales",
      "type": "quantitative",
      "scale": {"domain": [0, 60000]},
      "axis": {"tickCount": 5}
    },
    "color": {
      "field": "Channel",
      "scale": {
        "scheme": "pbiColorNominal"
      }
    }
  }
}

Congratulations to all who participated, and good luck.
Greg
Deneb Workout 01 - Line Chart with Smoothing.pbix (1.4 MB)

7 Likes

Hi Greg,

I started late with this workout. My strategy was the same I do on my real work development:
1 - Do a quick search for a possible solution to start working with
2- I find your template in Deneb Showcase: Deneb Template - Line Chart with curve smoothing - Deneb Showcase - Enterprise DNA Forum
3- I applied the JSON Template
4- I added Subtitle following the Vega-Lite documentation: View Title | Vega-Lite
5- I changed the scale to 60000
6- I changed Color to PowerBI Theme following Deneb Tutorial: Theme Colors & Schemes | Deneb (deneb-viz.github.io)
7- I couldn’t find a solution to changing SubTitle to cursive. I find in VegaLite Documentation that is on “subtitleFontStyle” but I was defining “cursive” and nothing was changing. I saw your solution and learned that it is called “Italic” and not “cursive”
8- I changed Date Format to “DD-MMM-YYYY”

{
  "title": {
    "text": "Deneb Workout 01",
    "subtitle": "Line Chart with Smoothing",
    "subtitleFontStyle": "italic",
    "anchor": "start",
    "align": "left",
    "font": "Verdana",
    "fontSize": 16,
    "fontWeight": "bold",
    "offset": 10
  },
  "data": {"name": "dataset"},
  "mark": {
    "type": "line",
    "interpolate": "natural"
  },
  "encoding": {
    "x": {
      "field": "Order Date",
      "type": "temporal"
    },
    "y": {
      "field": "Sales",
      "type": "quantitative",
      "scale": {"domain": [0, 60000]},
      "axis": {"tickCount": 3}
    },
    "color": {
      "field": "Channel Name",
      "scale": {
        "scheme": "pbiColorNominal"
      }
    }
  }
}

Hi @scancela.90. I’ve used “italic” and “normal” for the subtitleFontStyle, but have not seen “cursive”.
Greg

1 Like