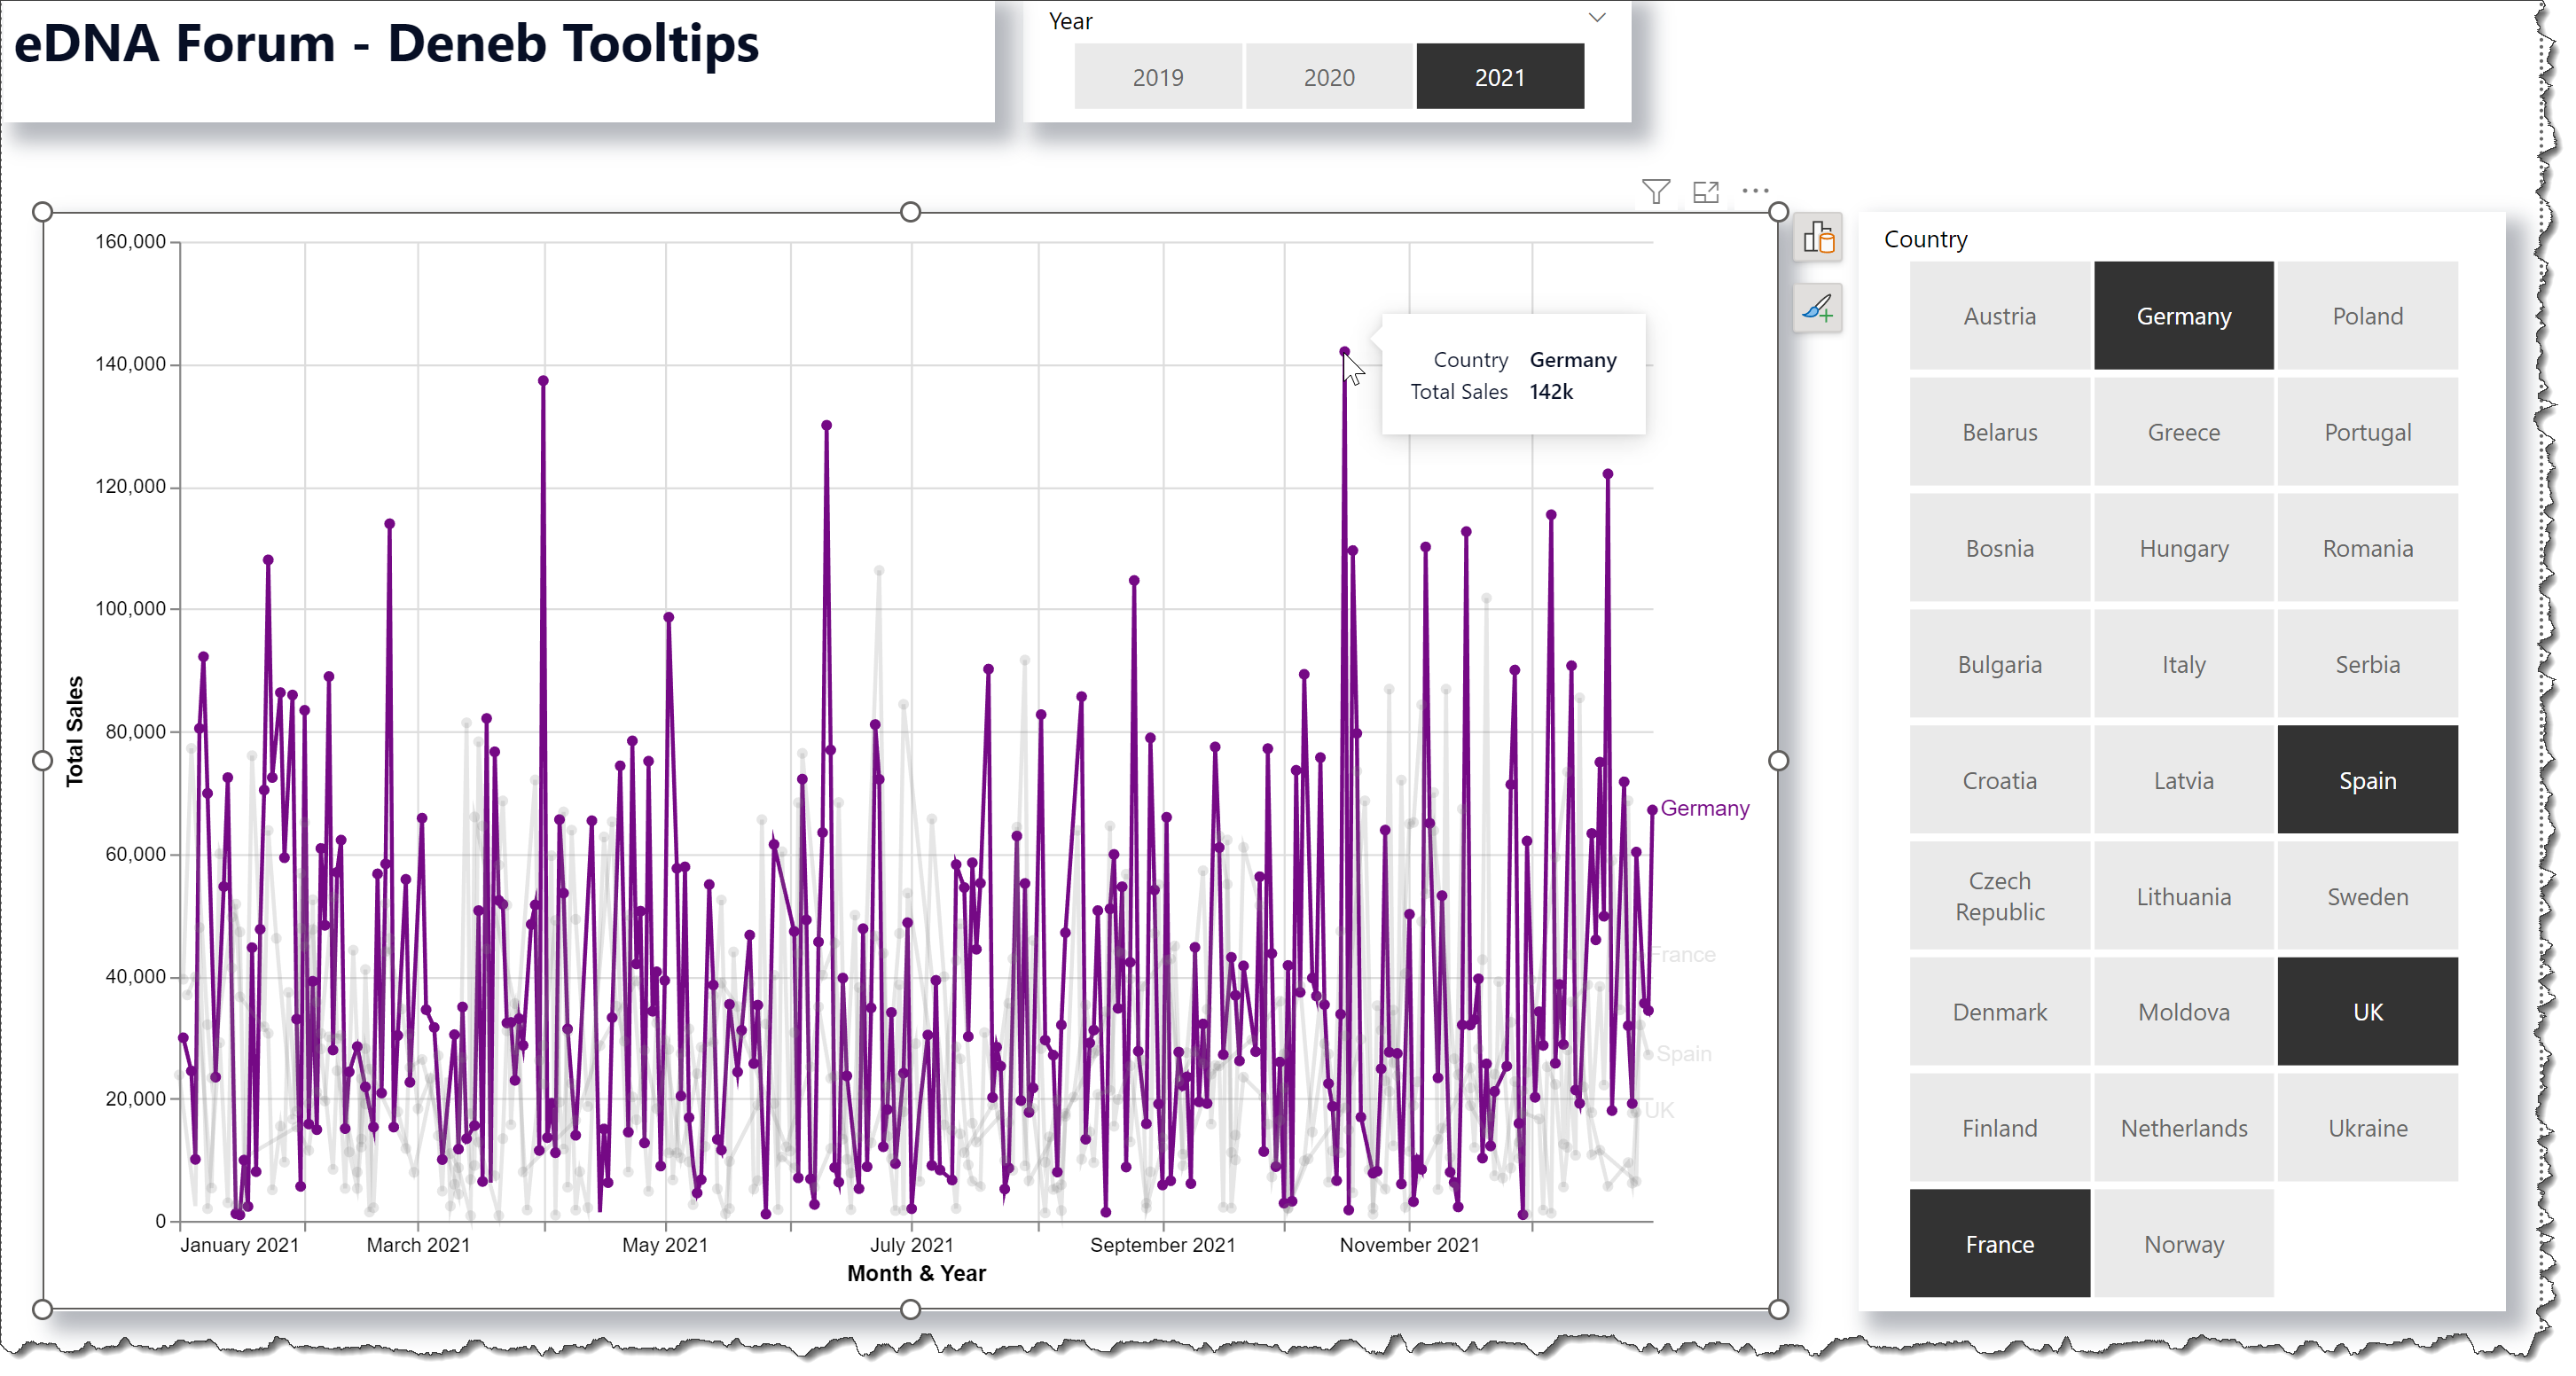
One of the interactive features built-in to the Vega-Lite language is the ability to highlight a category by detecting the mouse location (using its hover position). A line chart can be used to effectively illustrate this feature, and I enclose a Deneb/Vega-Lite template for such a line chart.
This template illustrates a number of Deneb/Vega-Lite features, including:
a temporal X-axis with label formatting using Deneb’s ability to access Power BI formatting strings
a quantitative Y-axis with approximate tick count
automatic assignment of country colours based on Deneb v1.1’s ability to access the current Power BI colour theme
automatic turning of all non-selected countries lines to “grey” (i.e., those countries that are not currently hovered-over)
a layered “circle” and “text” mark at the right-side of each line denoting the category (country)
The intent of this template is not to provide a finished visual, but rather to serve as a starting point for further custom visual development.
Also included is the sample PBIX using the Enterprise DNA Practice Dataset as a demo.
NOTE: This template is provided as-is for information purposes only, and its use is solely at the discretion of the end user; no responsibility is assumed by the author.
EDIT: resolved Deneb v1.1 template generation issue and uploaded new template version
@Greg Hello Greg!
I find this chart super interesting and wanted to use it. In my case, I would like to have a tooltip where I specify the field and field name and formatting (as I am formatting my numbers and the ones straight out of the tooltip are not).
I tried to add it to the report in the encoding channel, but as I do so, the text mark gets repeated for every data point.
Is it possible to have the tooltip specified for this type of chart?
Thanks a lot!
Kind regards
Valeria
Hi @valeriabreveglieri. Sure, I can’t see why not. You included several fields and their formatting in your workout #8 submission, so I’d apply something similar as a first step. Hope that helps, and if there’s more you’d like to pursue, please upload your PBIX (with sample data) and a screenshot of the visual in question marked-up with what you’d like to see.
Greg
Hello @Greg !
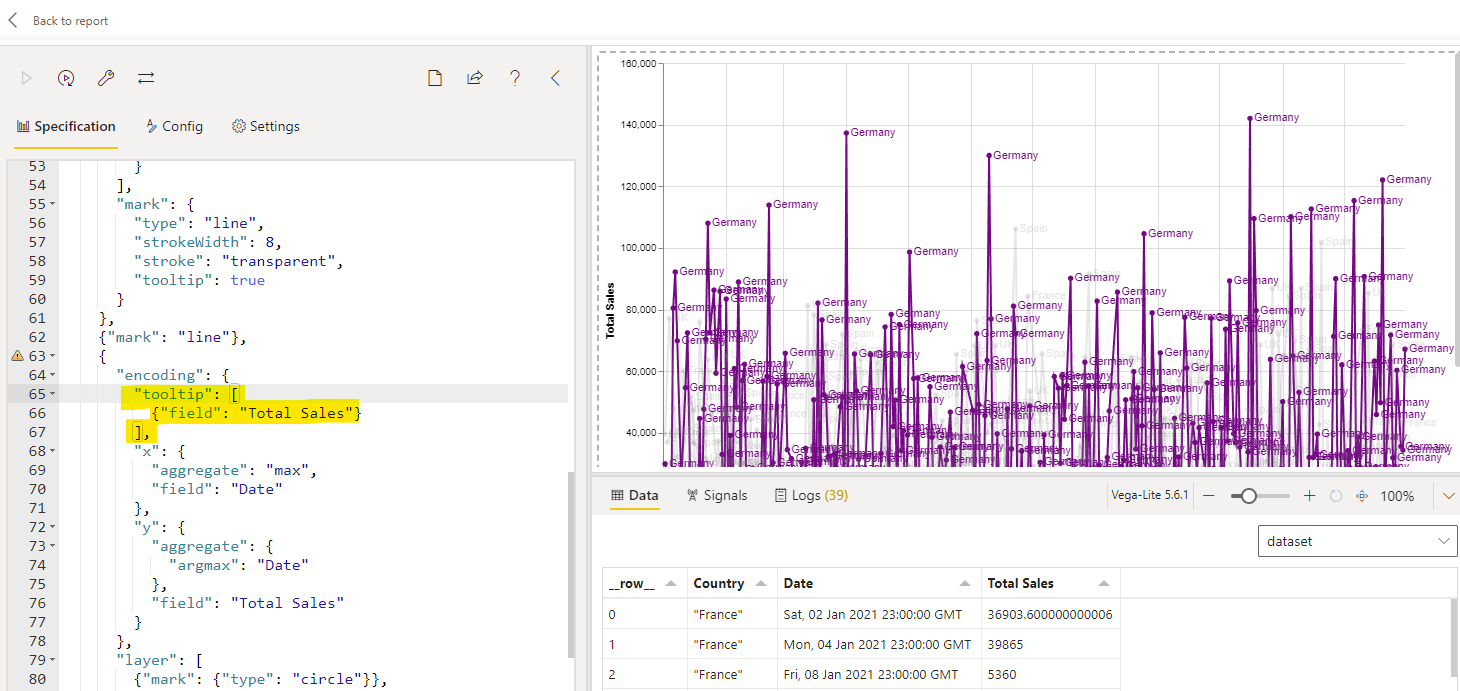
The issue I am having is, that when I add the custom tooltip, then the text mark gets repeated for every data point…
So I am somehow breaking an aggregation with the tooltip, but I don’t know where to begin to fix it…
I have attached the modified file from this thread so you can see the issue.
Thanks!!!
Kind regards
Valeria
Its discouraged to make new posts on a solved thread (as many members don’t review solved threads). To increase the audience for your post, please create a new thread for each new issue (and you can link to a reference thread if it helps [which it would in this case]). For simplicity, I’ll respond here this time. (@EnterpriseDNA, please split this post into its own thread.)
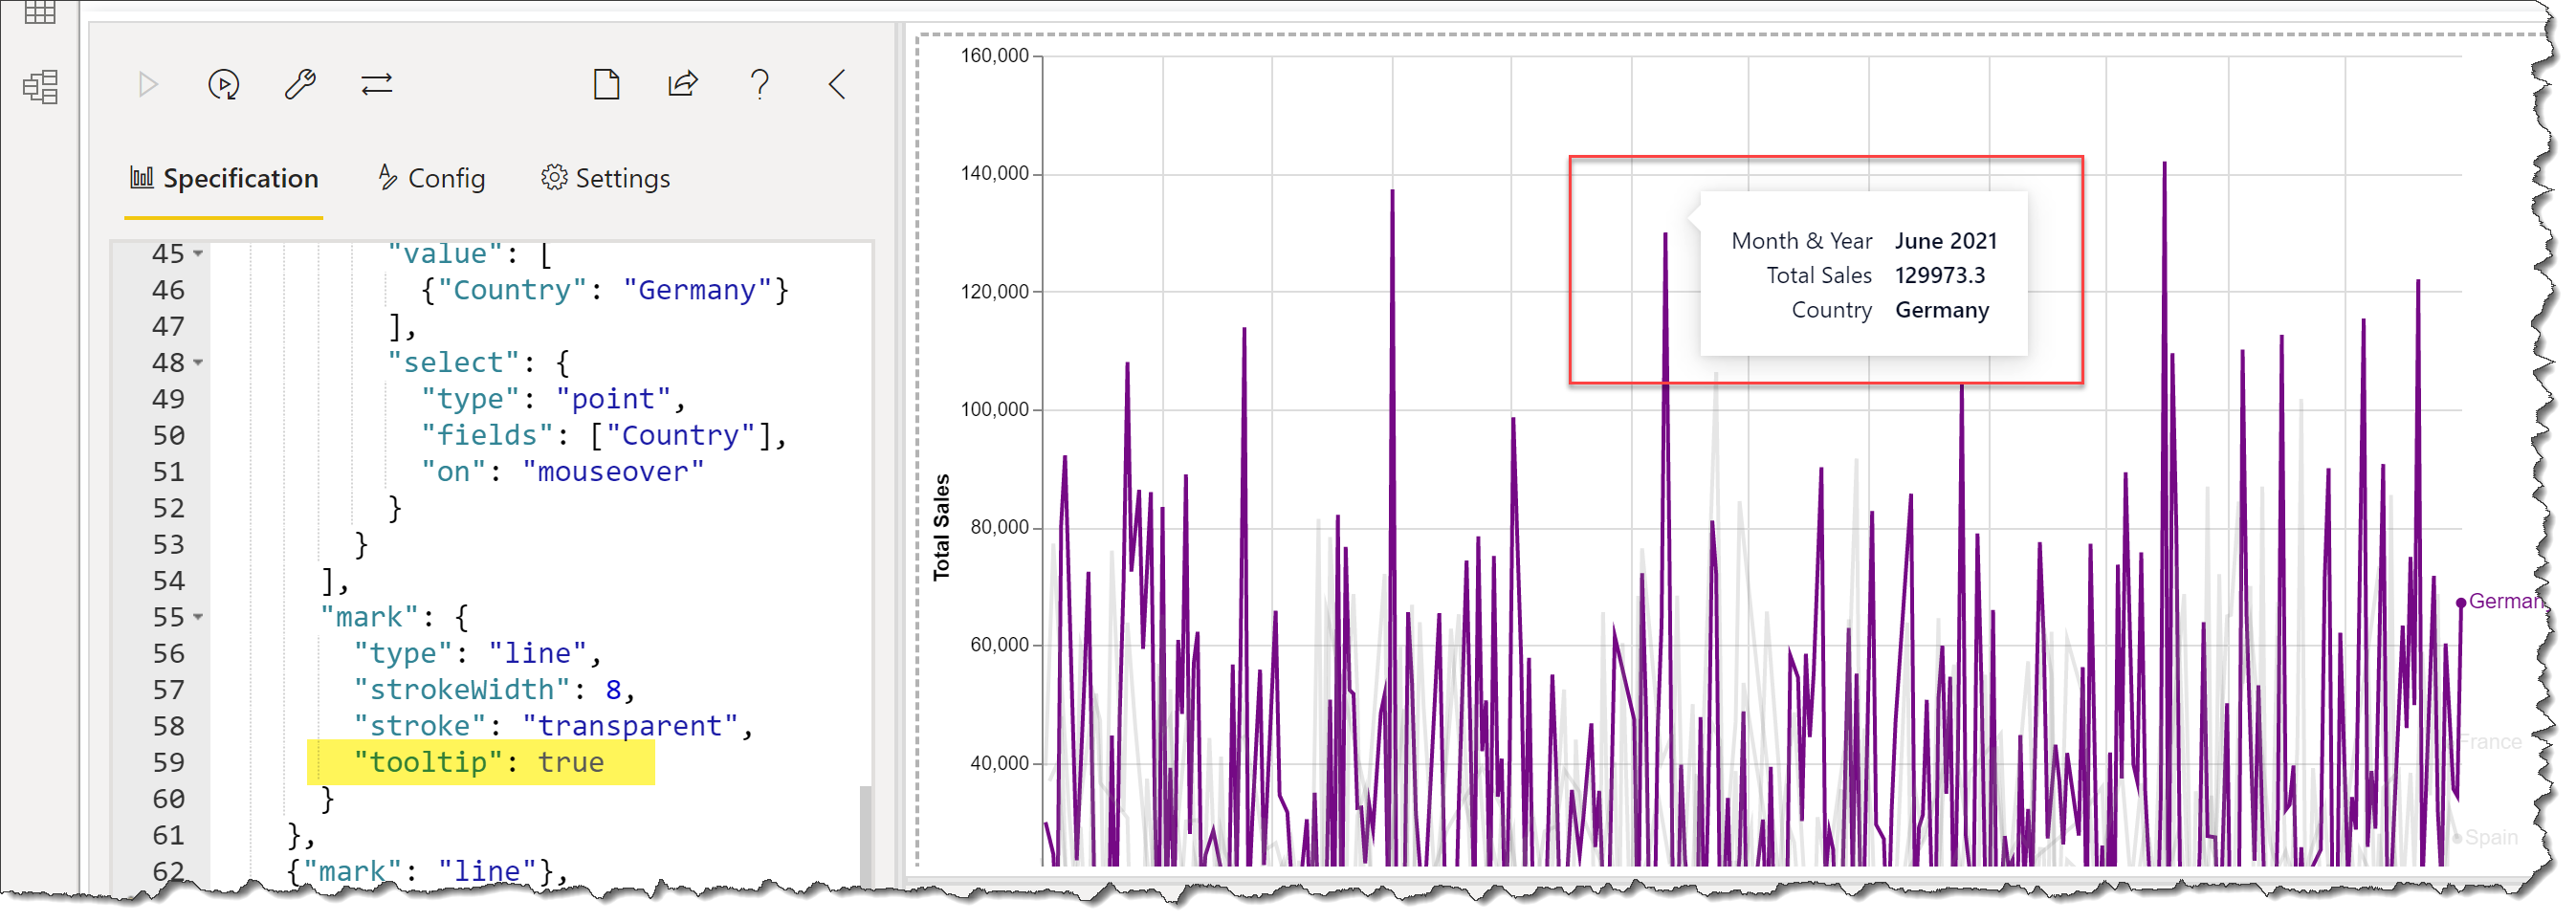
Yeah, I see your issue. I think Vega-Lite, when having to process each data point to add a the tooltip, applies the aggregate to each point, so the data label gets repeated. One solution to resolve this is to change the location of the tooltip code itself, and if it is applied to the “circle” mark instead, it looks more like what I think you want.
Thanks @Greg ! Looks great
Yes, I thought that keeping the thread close to the original one here was OK because there was another question on tooltips… but definitely next time I will do as you say, creating a new thread and linking to the older one. Thanks!