Deneb - Line Chart with hover highlight with year as "legend"

Hello!
Looking at the template line chart with hover highlight, I was trying to use the year as a “legend” instead of the country, and the months in the x axis, but I cannot understand how to manipulate it correctly.
Anything I try, it turns out to produce a circle instead of a line…
Attached the ex. taken from the original template.
Thanks!
Kind regards
Valeria

Deneb question - Line Chart with Hover Highlight.pbix (1.7 MB)

Hi @valeriabreveglieri. I think I understand what you’re going for, but didn’t have any success on my first try editing your visual. I’ll try a new start with a basic coloured line chart then add the “transparency” parameter and will post when I have something available.
Greg

Hi @valeriabreveglieri. Here’s another try … does this look like what you’re looking for?
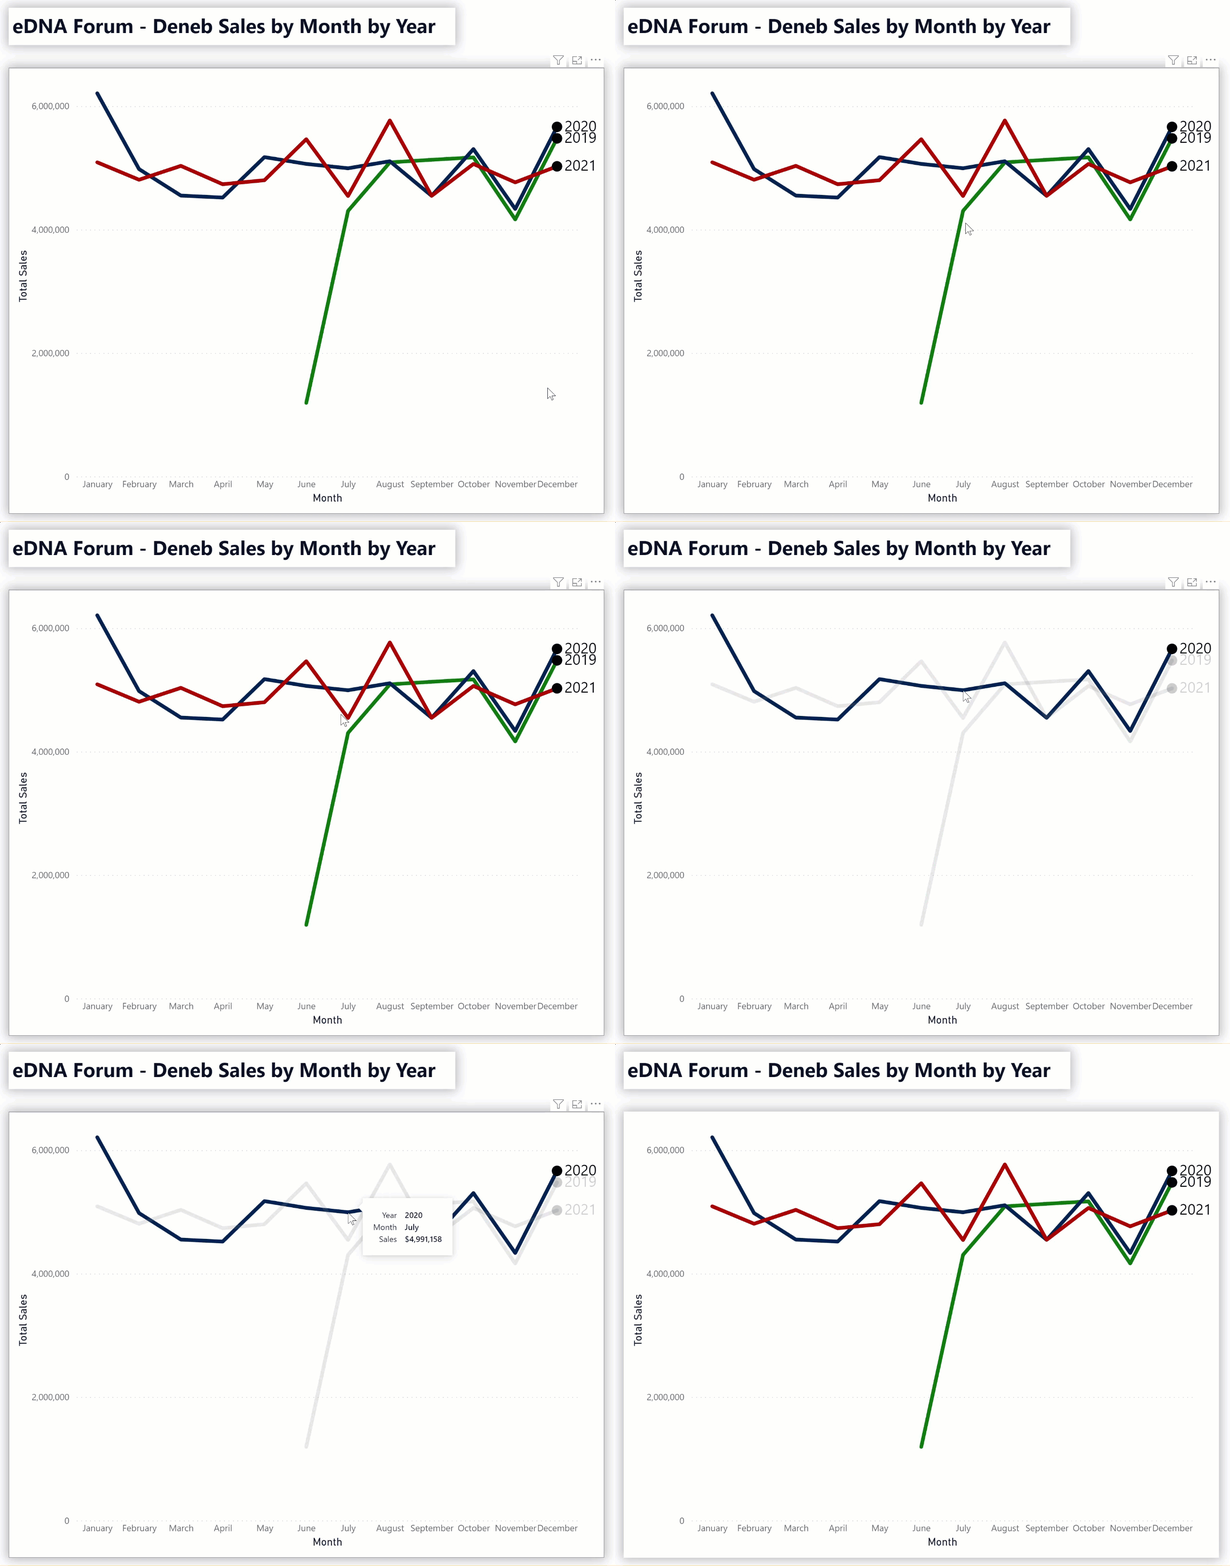
eDNA forum - Deneb Sales by Month by Year - 1

If so, here’s the Deneb/Vega-Lite JSON code:

{
  "data": {"name": "dataset"},
  "encoding": {
    "x": {
      "field": "Month Name",
      "type": "nominal",
      "axis": {"labelAngle": 0},
      "sort": {
        "op": "sum",
        "field": "MonthOfYear",
        "order": "ascending"
      },
      "title": "Month"
    },
    "y": {
      "field": "Total Sales",
      "type": "quantitative"
    },
    "color": {
      "condition": {
        "param": "hover",
        "field": "Year",
        "type": "ordinal",
        "legend": null,
        "scale": {
          "scheme": "pbiColorNominal"
        }
      },
      "value": "grey"
    },
    "opacity": {
      "condition": {
        "param": "hover",
        "value": 1
      },
      "value": 0.2
    }
  },
  "layer": [
    {
      "params": [
        {
          "name": "hover",
          "value": [{"Year": 2021}],
          "select": {
            "type": "point",
            "fields": ["Year"],
            "on": "mouseover"
          }
        }
      ],
      "mark": {
        "type": "line",
        "tooltip": true,
        "strokeWidth": 5
      },
      "encoding": {
        "tooltip": [
          {
            "field": "Year",
            "type": "quantitative"
          },
          {
            "field": "Month Name",
            "type": "nominal",
            "title": "Month"
          },
          {
            "field": "Total Sales",
            "type": "quantitative",
            "title": "Sales",
            "formatType": "pbiFormat",
            "format": "$#,0"
          }
        ]
      }
    },
    {
      "name": "ENDPOINT_CIRCLE",
      "mark": {
        "type": "circle",
        "size": 200,
        "opacity": 1
      },
      "encoding": {
        "color": {
          "condition": [
            {
              "test": "datum['MonthOfYear'] == 12",
              "value": "black"
            }
          ],
          "value": "transparent"
        }
      }
    },
    {
      "name": "ENDPOINT_LABEL",
      "mark": {
        "type": "text",
        "align": "left",
        "xOffset": 10,
        "fontSize": 20
      },
      "encoding": {
        "text": {
          "field": "Year",
          "type": "quantitative"
        },
        "color": {
          "condition": [
            {
              "test": "datum['MonthOfYear'] == 12",
              "value": "black"
            }
          ],
          "value": "transparent"
        }
      }
    }
  ]
}

Hope it helps.
Greg
eDNA Forum - Deneb Sales by Month by Year.pbix (1.7 MB)

1 Like

@Greg yes this is exactly it! Thanks :slight_smile:
It is late here now but tomorrow I will look at the differences with the previous code to learn :slight_smile:
Thanks!