Hi all,
I have a questionnaire data where my customer rate our service from 1-5.
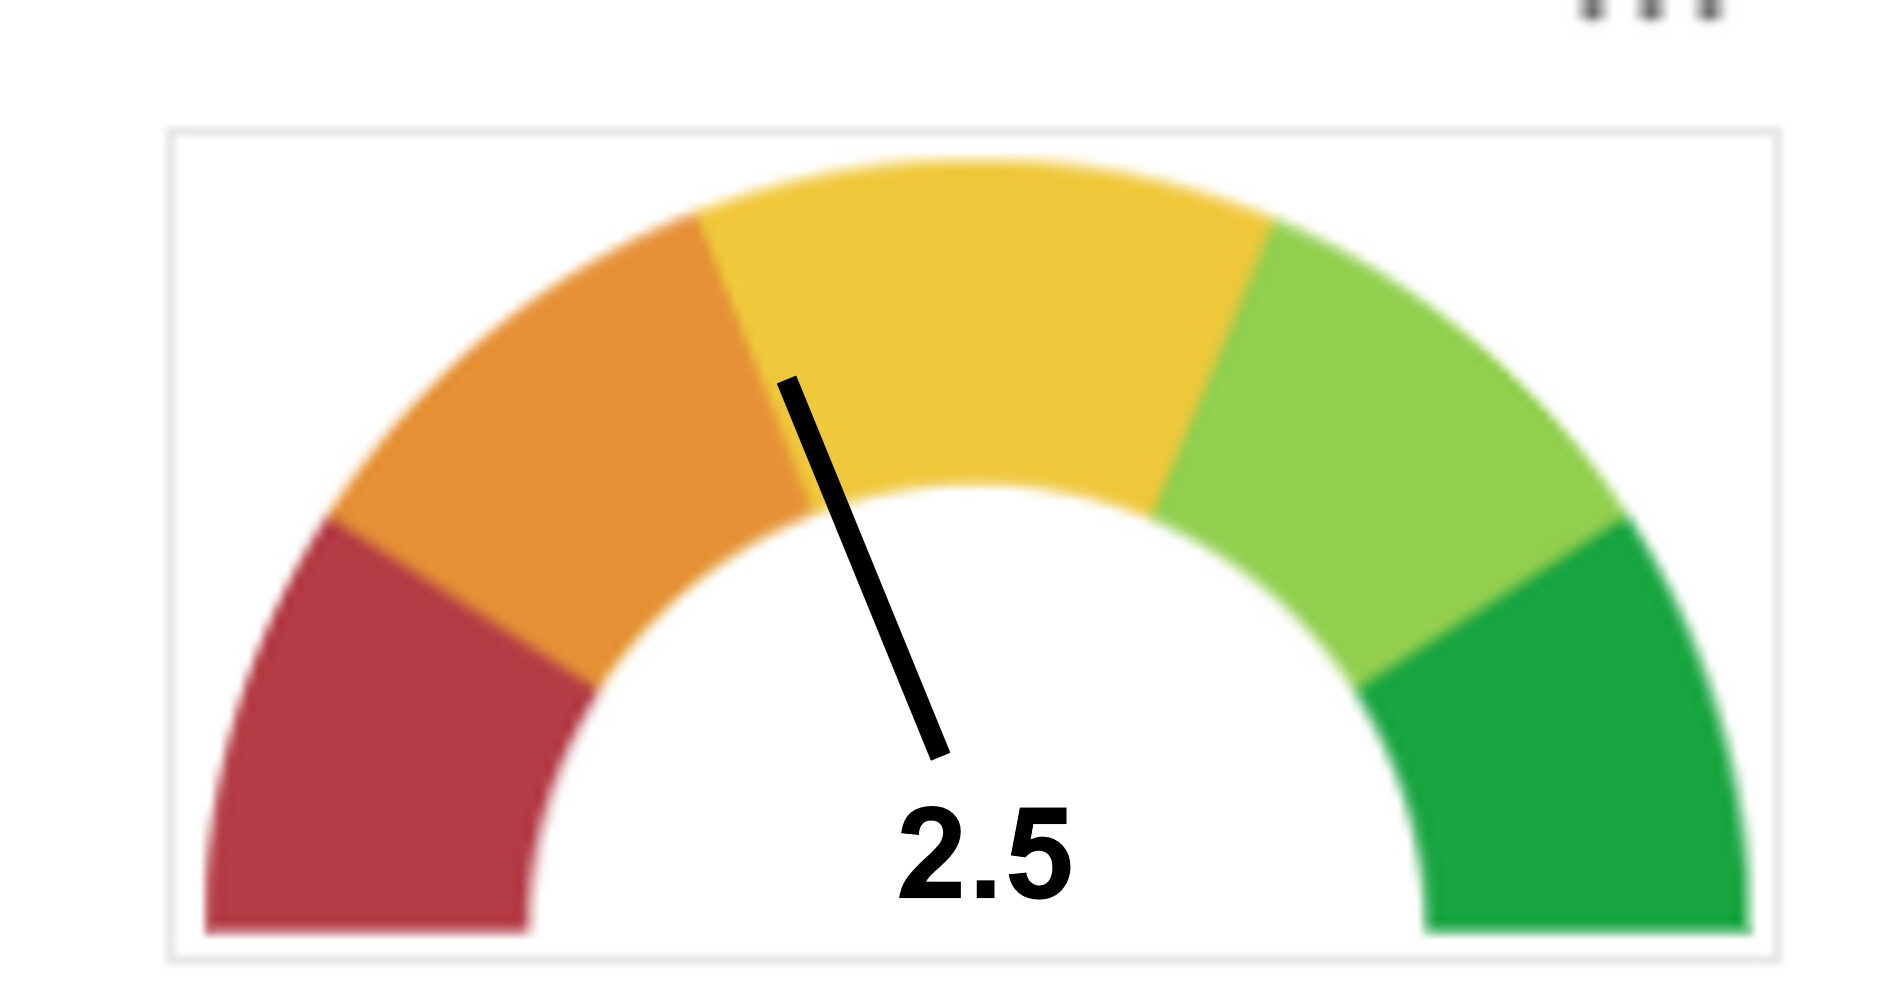
I just need to show average rating across customer in a 5 different color Guage along with needle in the center.
Expected output is as below:
The above output is not possible in Native Guage chart, we need to build it using Guage chart
Few references can be found here
@Greg requesting your help here please