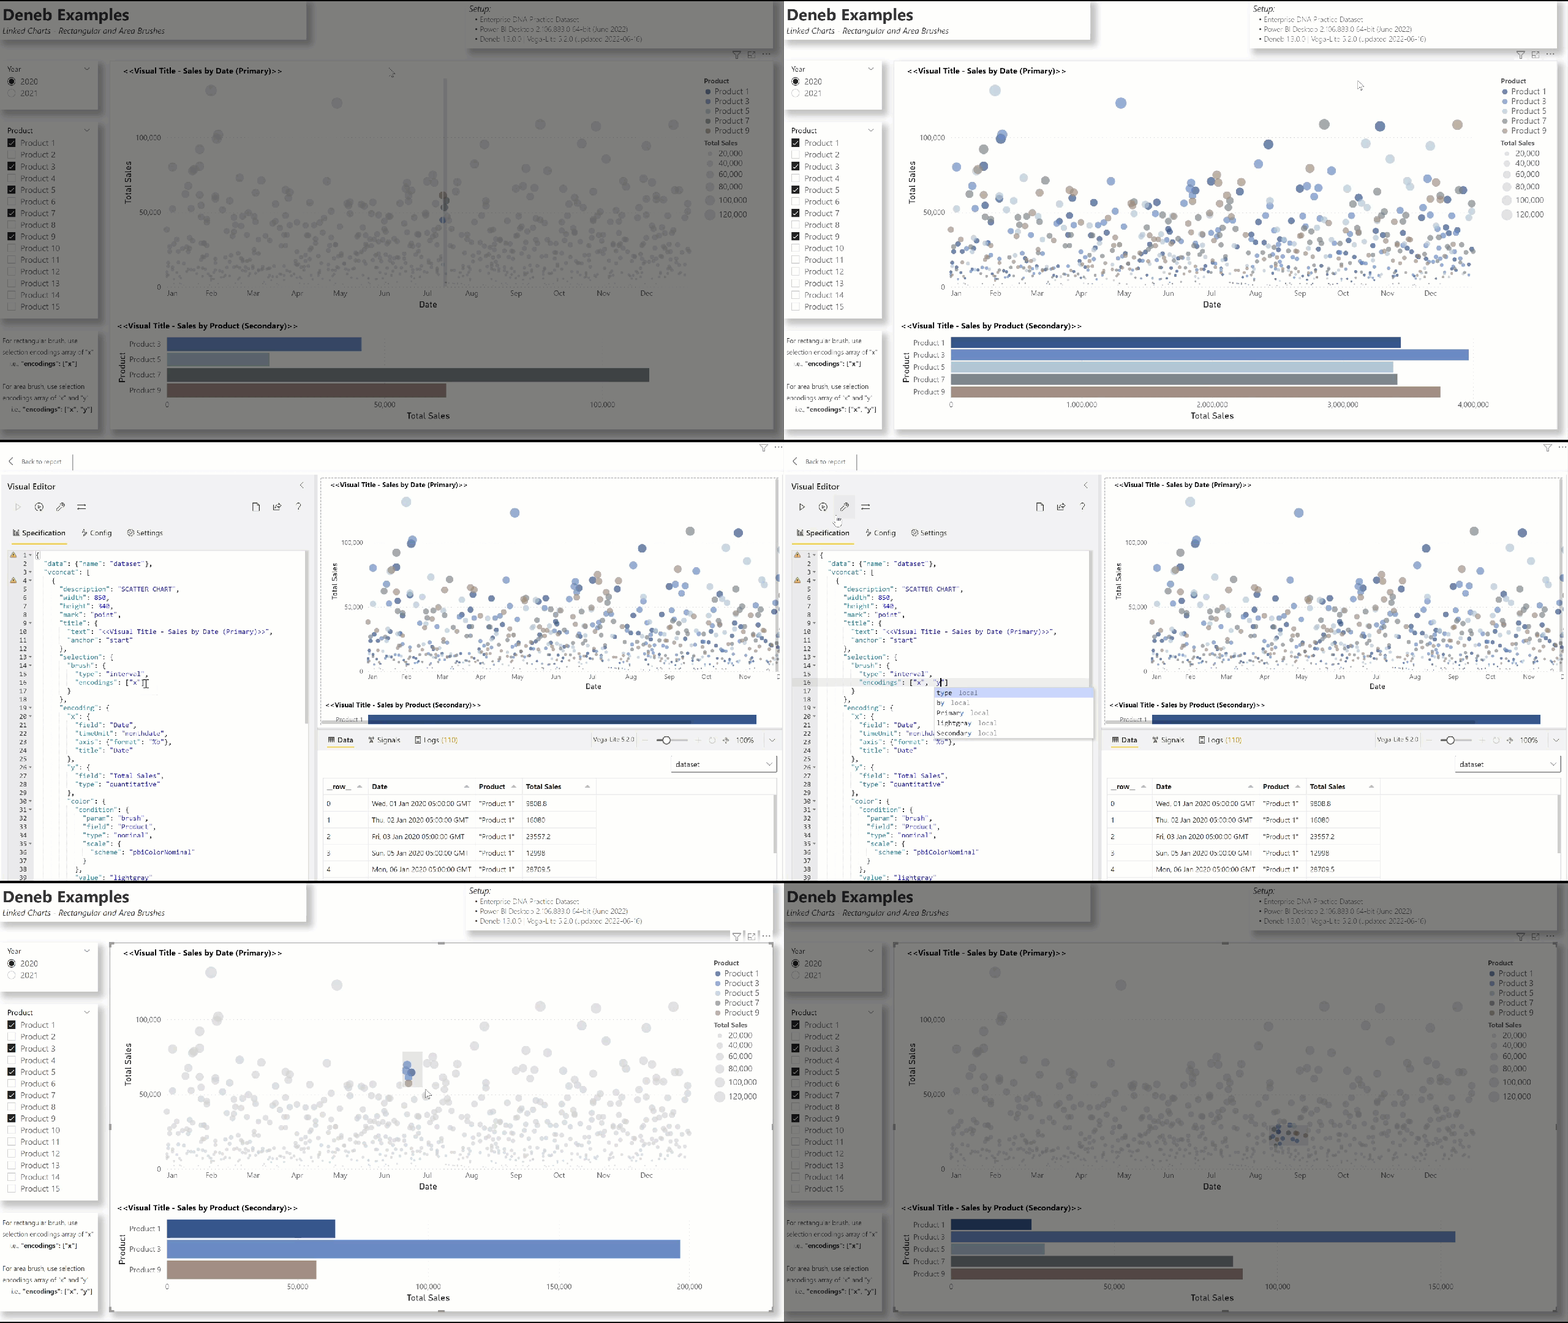
As noted in an earlier post to the Deneb Showcase section of the Enterprise DNA Forum
one of the interactive features built-in to the Vega-Lite language is the ability to use a “brush” to select a set of data in one visual and use the selection to filter/recalculate another linked visual. Of note, you can easily switch between a rectangular brush (i.e., using 1 axis) and an area brush (i.e., using 2 axes) by editing the selection brush encoding array:
      "selection": {
        "brush": {
          "type": "interval",
          "encodings": ["x"]
        }
      }

      "selection": {
        "brush": {
          "type": "interval",
          "encodings": ["x", "y"]
        }
      }
As before, a primary scatter chart and a linked secondary bar chart can be used to effectively illustrate these features, and I enclose a sample PBIX using the Enterprise DNA Practice Dataset as a demo.

Greg
Deneb Examples - Linked Charts - Rectangular and Area Brushes.pbix (1.7 MB)