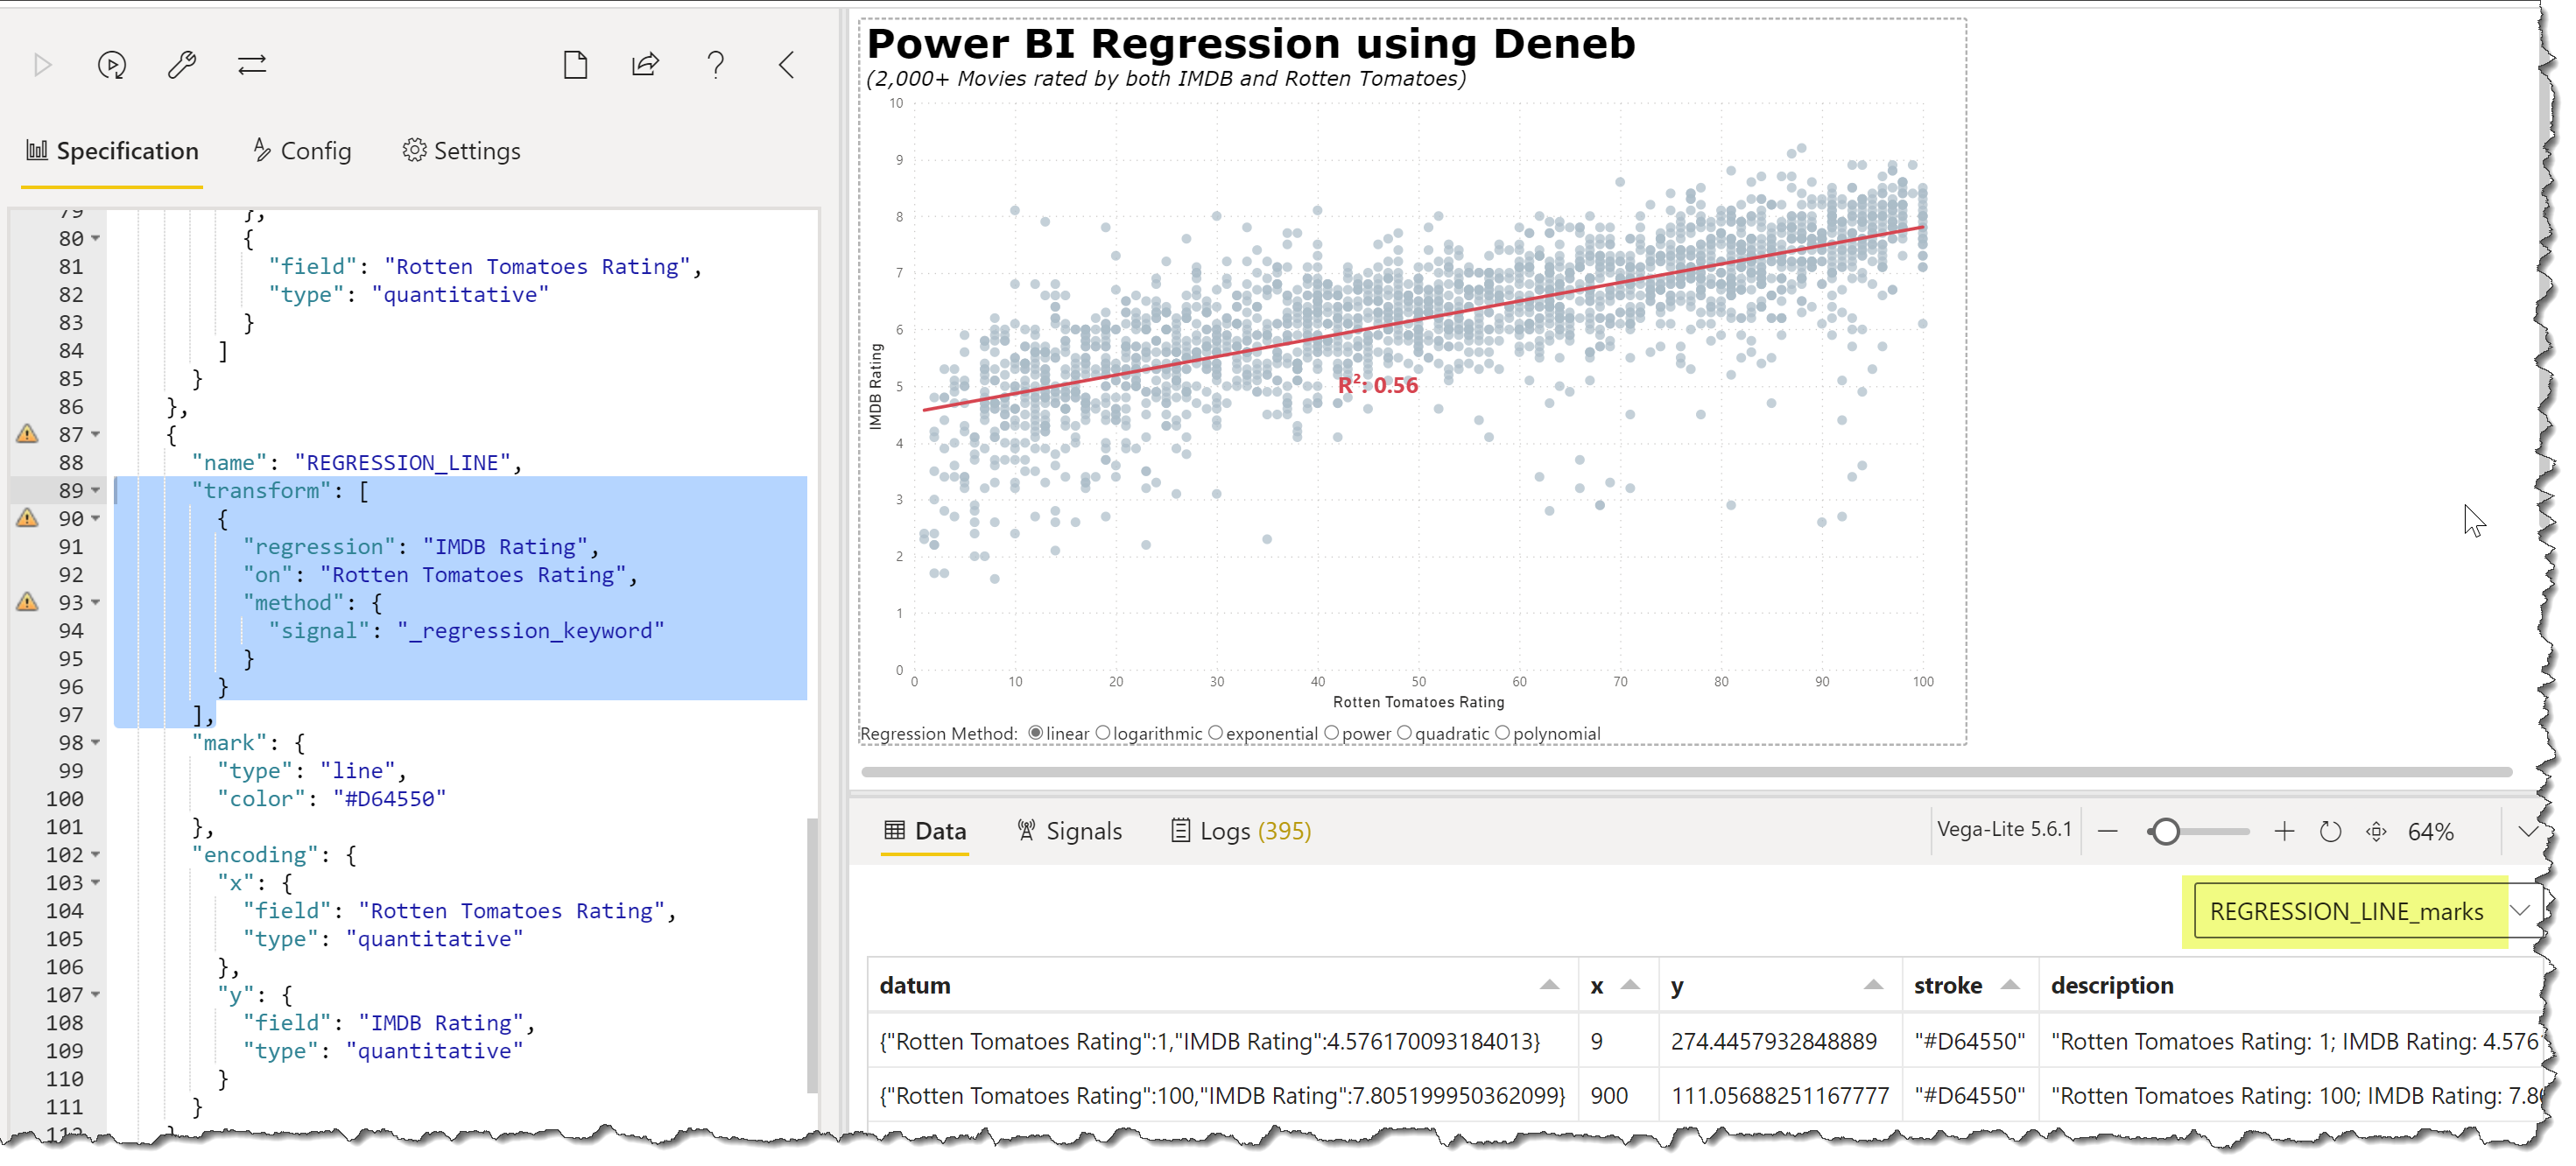
Deneb/Vega-Lite can be used to create regression analyses in Power BI. Vega-Lite has 6 regression algorithms built-in: linear, logarithmic, exponential, power, quadratic, and polynomial. The example visual presented herein consists of a scatter chart using movie ratings overlayed with a regression line and an R-squared statistic.
This example illustrates a number of Deneb/Vega-Lite features, including:
0 - General:
- use of a “params” block to create a radio-button screen widget for selecting the regression algorithm
- use of a “layer” block consisting of 3 sections: scatter chart, regression line, and r-squared statistic.
1 - Scatter Chart:
- use of a “point” mark to display IMDB rating vs. Rotten Tomatoes rating (the raw data)
- both the X and Y axes use custom axis tick counts (10)
- custom tooltip with title, release year, release date, IMDB rating, and Rotten Tomatoes rating
2 - Regression Line:
- use of a “transform” block to apply the (selected) regression algorithm to the raw data
- thanks to Davide Bacci for sharing his insight on using Vega code within Vega-Lite in his recent (July 2023) response to a Stack Overflow question about using parameter values in regression calculations https://stackoverflow.com/questions/76709441/in-vega-lite-deneb-how-do-i-apply-a-parameter-list-of-regression-types-to-a-ca
- use of a “line” mark for the regression line (thick; red)
3 - Regression Statistic:
- use of a “transform” block to apply the (selected) regression algorithm to the raw data and calculate the r-squared statistic
- use of a “text” mark located at the center of the visual (width/2; height/2) to display the r-squared statistic
The intent of this example is not to provide a finished visual, but rather to serve as a starting point for further custom visual development.
Also included is the sample PBIX using the movies JSON file provided on the Vaga-Lite examples website.
This example is provided as-is for information purposes only, and its use is solely at the discretion of the end user; no responsibility is assumed by the author.
Greg
Deneb Examples - Regression.pbix (1.5 MB)