DAX Workout 004 - Creating Up/Down arrows when YOY% changes

For this workout, you work for an oil production company, and you are asked to show a KPI for YOY% of Net Oil Production.

Create a KPI for the end user but show up/down arrow indications and change the color of the YOY% value as shown.

How would you tackle this? Note: The values may vary from the images shown per date/year selection.

Have fun !!

You can modify/augment the data model provided if needed.

Submission

Load the supplied data file into a new Power BI file, create your solution, and reply to this post. Upload a screenshot of your solution along with the DAX measure. Please format your DAX code and blur it or place it in a hidden section.

Period
This workout will be released on Thursday, March 30, 2023, and the author’s solution will be posted on Sunday, April 2, 2023.

DAX Workout No4 033023.pbix (368.8 KB)

3 Likes

:slight_smile:

2 Likes

Great job @windler.nikki

1 Like

@windler.nikki what steps did you take and measure?

Paul

Hi, this is my solution

image

Dax

image

4 Likes

Very nice @AlexandreAndrade . Works well. Keep up the good work

1 Like

@Paul.Gerber ,

Fun problem that I spent WAAAAYYY to much time fooling around with… :rofl:

Hope you like it.

DAX Workout 4

14 separate DAX measures - too many to post, but I’m planning to do a solution video on this one since it’s got some neat techniques incorporated.

I’ve attached the PBIX file if folks want to take a look at the construct.

DAX Workout No4 033023 - BEJ Solution.pbix (3.4 MB)

  • Brian
10 Likes

@BrianJ OMG ! This is over the top, my friend. As Mr. Burns would say from The Simpsons,

image

2 Likes

Awesomenessss

1 Like

Hi, Here is my submission
In that, I implemented Second DAX for Conditional formatting in Card Visual, and I assigned the measure in Color Format for the callout value.

:green_circle::yellow_circle::red_circle:
Oil Production YoY% Paul Workout =
// Oil Production= sum(‘Data Cleaned’[oil Prod])
//Oil Previous Oil production =CALCULATE([Oil production],SAMEPERIODLASTYEAR(‘Date’[Date]))
VAR _difference =
CALCULATE ( [Oil production] ) - ( [Previous oil production] )
VAR _direction =
SWITCH ( TRUE (), _difference > 0, “▲”, _difference < 0, “▼”, “◆” )
VAR _Percentchange = _difference / [Previous oil production]
RETURN
_direction & " "
& FORMAT ( _Percentchange, “0.0%” )

:red_circle::yellow_circle::green_circle:
Color KPI = var _difference= CALCULATE([Oil production]-[Previous oil production])
return
SWITCH(
TRUE()
,_difference > 0, “#007f4e
,_difference < 0, “#e12729
,“#000000
)

4 Likes

Love these little “One offs” for me to practice and go back on things I haven’t done in a while.

.

I probably created more measures than necessary but I like things broken down into their simplest forms. So I can review later.

Oil Production =
SUM(
‘Data Cleaned’[Oil Prod]
)

Oil Production PY =
CALCULATE(
[Oil Production],
SAMEPERIODLASTYEAR(‘Date’[Date])
)

YOY =
DIVIDE([Oil Production]-[Oil Production PY], [Oil Production PY],0)

YOY Color =
SWITCH(
TRUE(),
[YOY] < 0, “#FF0000”,
[YOY] > 0, “#00FF00”,
#0000FF”)

Arrow Up, Down and Neutral - I created Base64 Images to use (Quite long for a formula)
Arrow =
SWITCH(
TRUE(),
[YOY] < 0, [Arrow Down],
[YOY] > 0, [Arrow Up],
[Arrow Neutral])
DAX Workout No4 MB.pbix (1.3 MB)

6 Likes

I really like your provision of the additional context of the total production and PY production in the KPI.

2 Likes

@mbraun thanks. I’m glad to hear you’re enjoying the workouts. We will be rolling more out for sure.

1 Like

Hey everyone!

I really enjoyed this one.

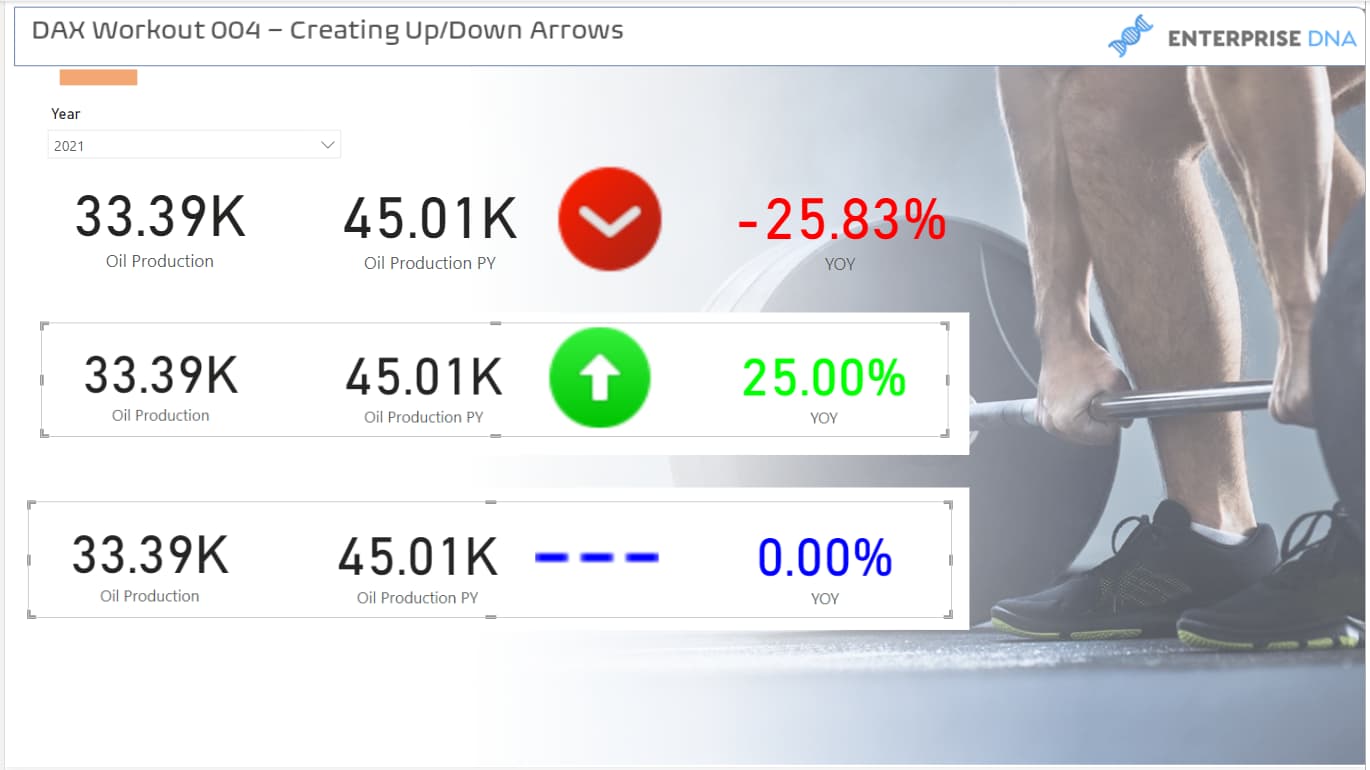
I decided NOT to create multiple measures for each step and do it in one measure. I don’t do this in my daily job as I have to have basic measures in my report in case I need them but for this challenge, I wanted to use variables and see how I can use best practices to write the code in one measure. I decided to return BLANK whenever we don’t have values for either Current Year or the Previous Year, and return dash (instead of up and down arrows) whenever the difference is ZERO.

I created another measure for colour as well which is pretty much the same as what I had in the first measure, but if you have basic measures in your report like “Oil Prod Net” and “Oil Prod Net PY” you don’t need to repeat what you had in your first measure in the colour measure.

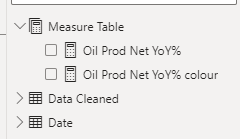
And as I LOVE measure tables, I created it even for this challenge with two measures :blush:

image

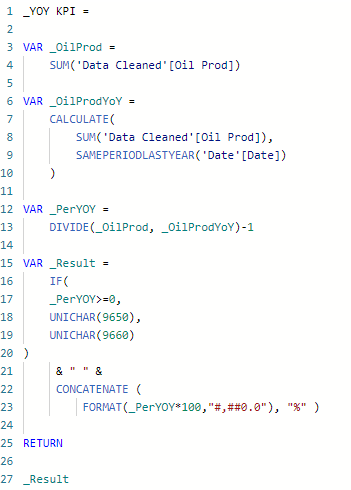
This is the first measure calculating the YoY%

Oil Prod Net YoY% = 
VAR OilProdNet = SUM( 'Data Cleaned'[Oil Prod Net] )
VAR OilProdNetPY = CALCULATE( SUM( 'Data Cleaned'[Oil Prod Net] ), DATEADD( 'Date'[Date], -1, YEAR ) )
VAR Diff = OilProdNet - OilProdNetPY

VAR Result = DIVIDE( Diff, OilProdNetPY, BLANK() )

RETURN
SWITCH( TRUE,
    OR( ISBLANK( OilProdNet ), ISBLANK( OilProdNetPY ) ), BLANK(),
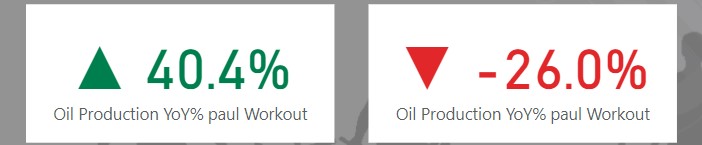
    Diff >0, UNICHAR(129053) & "  " & FORMAT( Result, "0.0%" ),
    Diff <0, UNICHAR(129055) & "  " & FORMAT( Result, "0.0%" ),
    UNICHAR(8210) & "  " & FORMAT( Result, "0.0%" )
)

And this is the measure for colour:

Oil Prod Net YoY% colour = 
VAR OilProdNet = SUM( 'Data Cleaned'[Oil Prod Net] )
VAR OilProdNetPY = CALCULATE( SUM( 'Data Cleaned'[Oil Prod Net] ), DATEADD( 'Date'[Date], -1, YEAR ) )
VAR Diff = OilProdNet - OilProdNetPY

VAR Result = DIVIDE( Diff, OilProdNetPY, BLANK() )

RETURN
SWITCH( TRUE,
    Diff >0, "#2a9d8f",
    Diff <0, "#e63946",
    "#adb5bd"
)

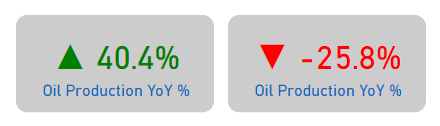
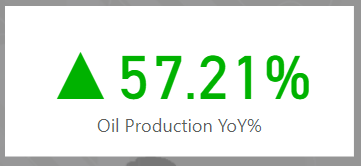
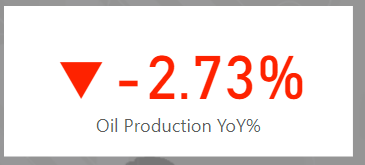
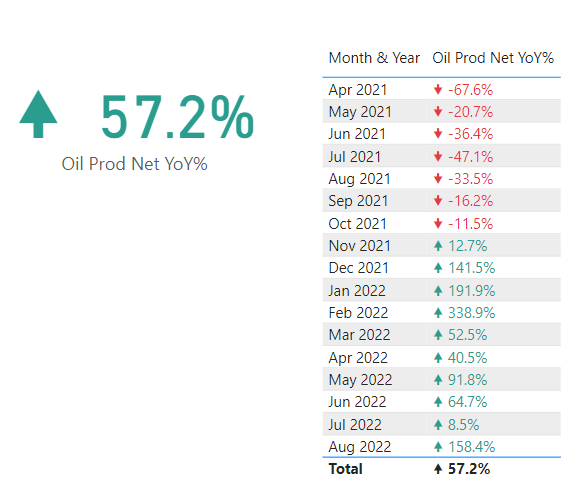
And this is the result

image

Here is the pbix file:
DAX Workout No4 033023 - Hossein.pbix (372.0 KB)

Hope you enjoy it
Regards,
Hossein

7 Likes

I LOVE the gif Brian :wink:

4 Likes

That looks amazing :facepunch:

1 Like

@sedhosen wow thanks for doing the workout and the write up. I appreciate it. You did a great job. I love the table showing the values. Excellent added touch to the report. Hope to see you on the next one.

1 Like

That was really enjoyable and fun. Thanks for organizing it @Paul.Gerber

These days whoever asks me about improving his/her knowledge in different sections of power bi, I recommend participating in eDNA workouts and builds. I enjoyed it and believe they’ll enjoy it as well. Besides that, they’ll learn sth that can use in their projects and reports.

So keep doing your great job and looking forward to the next one :wink:

2 Likes

Thank you for Great Excercise, as i didnt create this visual in a long time, and It just returned back to my active memory. I am sure Ill be using it in some of my upcoming reports.

image
image

For DAX, I know i could have got it all under the same measure, but i chose to create separate measures. It kinda helps to be used in othe calcs.

Oil Production LY = CALCULATE(SUM(‘Data Cleaned’[Oil Prod Net]),SAMEPERIODLASTYEAR(‘Date’[Date]))

Difference = CALCULATE(SUM(‘Data Cleaned’[Oil Prod Net]) - [Oil Production LY])

Oil Production YoY% =
VAR _v1= DIVIDE([Difference],[Oil Production LY],0)
VAR Arrow = SWITCH(TRUE(),
_v1<0,UNICHAR(11206),
_v1>=0,UNICHAR(9650),
BLANK())
VAR result = CONCATENATE( Arrow,FORMAT(_v1,“Percent”))
return
result

KPI Font Color =
VAR _v1 = DIVIDE([Difference],[Oil Production LY],0)
VAR _result = SWITCH(TRUE(),
_v1>0,“#00B200”,
_v1 <=0,“#FE2200”)
return
_result

Working File Attached
DAX Workout No4 033023.pbix (373.5 KB)

4 Likes

@jsodhi I am so glad you enjoyed this challenge. What a great solution you did. This is one of those that you kinda forget about. See you at the next one.

All the best,

Paul