@Paul.Gerber Thanks for the workout.
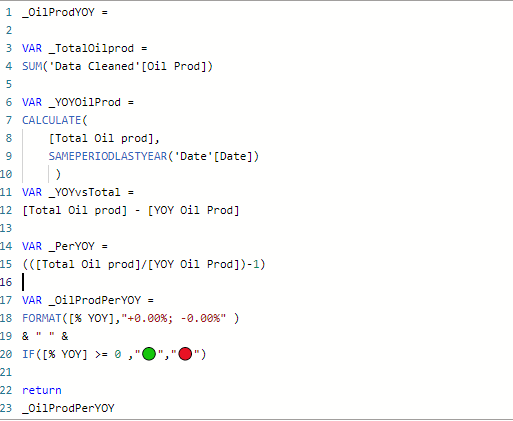
Here is my solution:
Summary
Awesome workout everyone. Solutions look really great
I made a few measures and combined them in the end.
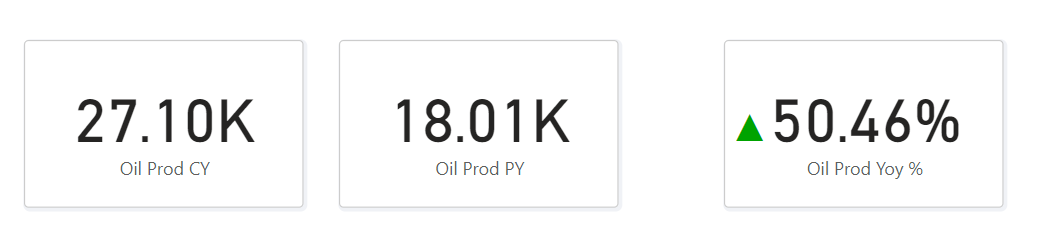
Oil Prod current year = SUM('Data Cleaned'[Oil Prod])
Oil Prod prev year = CALCULATE(SUM('Data Cleaned'[Oil Prod]), SAMEPERIODLASTYEAR('Date'[Date]))
YoY % = DIVIDE([Oil Prod current year]-[Oil Prod prev year], [Oil Prod prev year], 0)
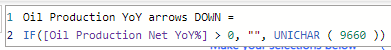
Arrow = IF([YoY %] < 0, UNICHAR(9660), IF([YoY %] > 0, UNICHAR(9650), UNICHAR(9664)))
Color = IF([YoY %] >= 0, "Green", "Red")
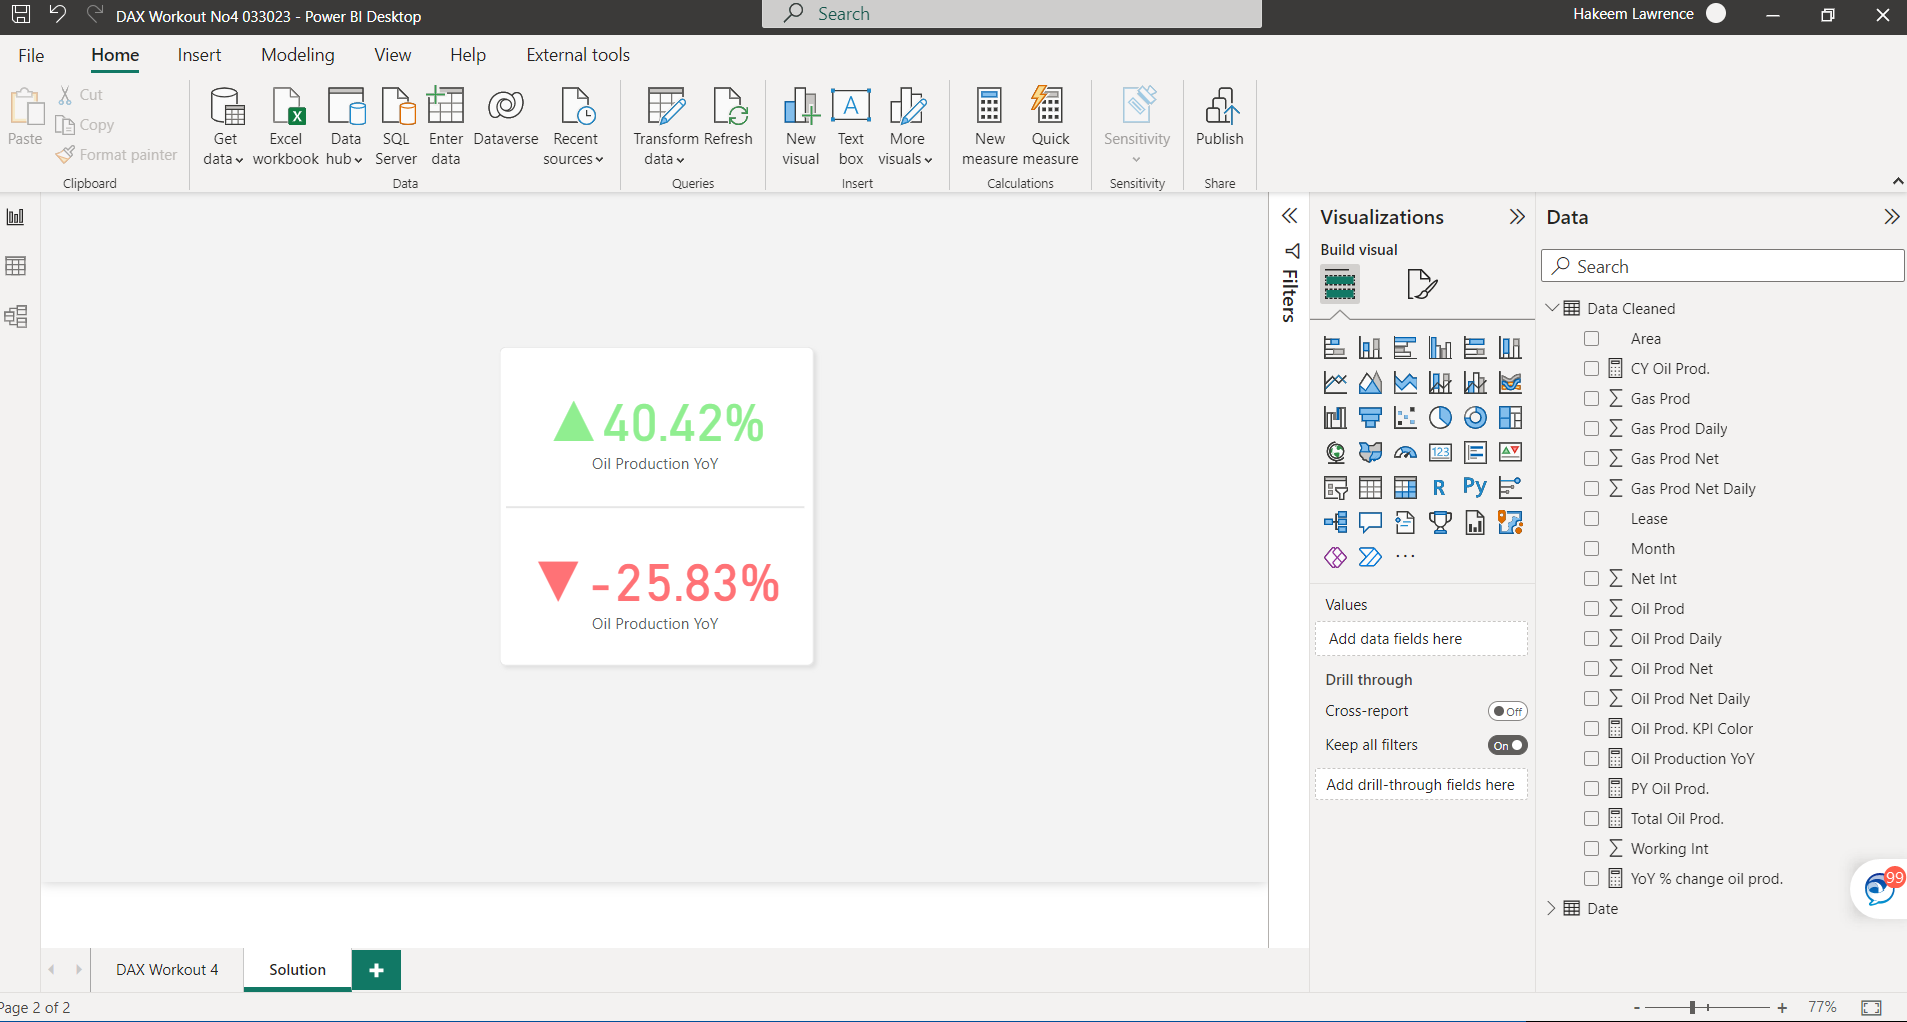
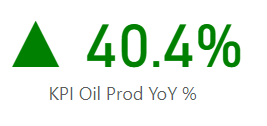
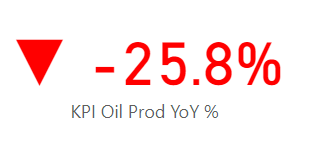
KPI Oil Prod YoY % = [Arrow] & " " & FORMAT([YoY %], "0.0%")
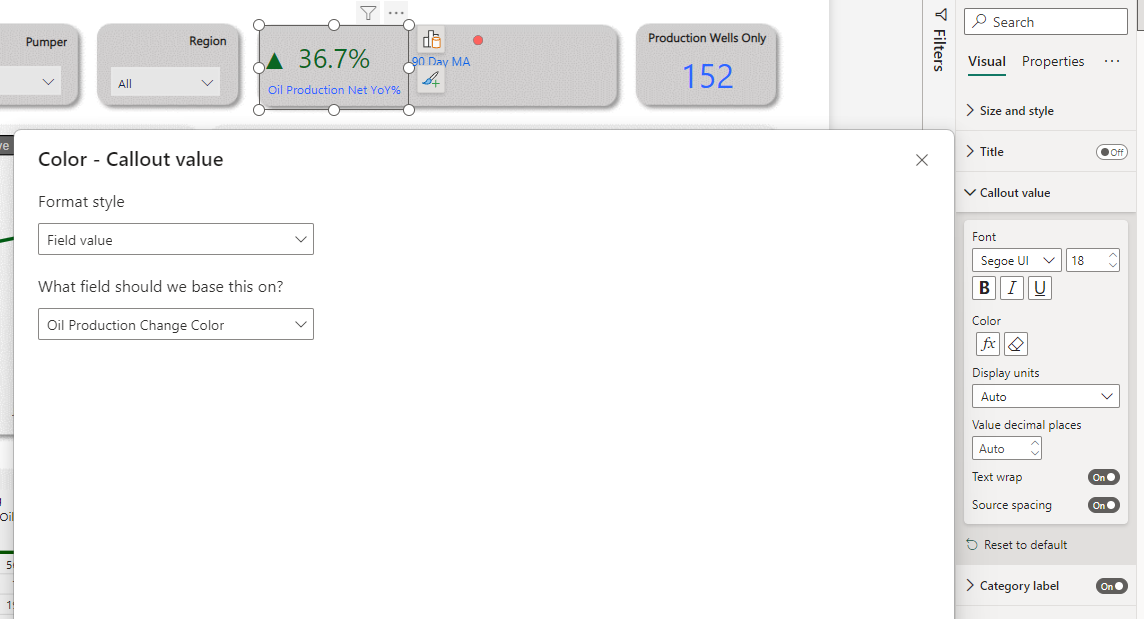
And the Callout value of the KPI card has field "Color" as Format style - Field value.
Total Oil Prod. = SUM('Data Cleaned'[Oil Prod])

PY Oil Prod. = CALCULATE([Total Oil Prod.], SAMEPERIODLASTYEAR('Date'[Date]))

YoY % change oil prod. =

var __diff = [Total Oil Prod.] - [PY Oil Prod.]

var result = DIVIDE(__diff, [PY Oil Prod.])

return

result


Oil Production YoY =

var __arrow = SWITCH(TRUE(),
                    [YoY % change oil prod.]>0,
                    UNICHAR(9650),
                    [YoY % change oil prod.]<0,
                    UNICHAR(9660)
)

var __result = __arrow & FORMAT([YoY % change oil prod.],"percent")

return __result


Oil Prod. KPI Color =

SWITCH(TRUE(),
        [YoY % change oil prod.] >0,
        "#90ee90",
        [YoY % change oil prod.]<0,
        "#FF7276"
)
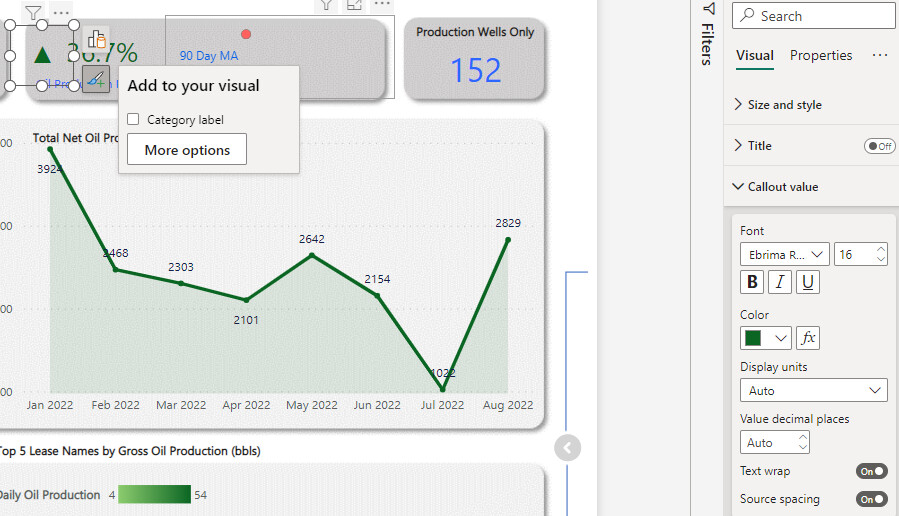
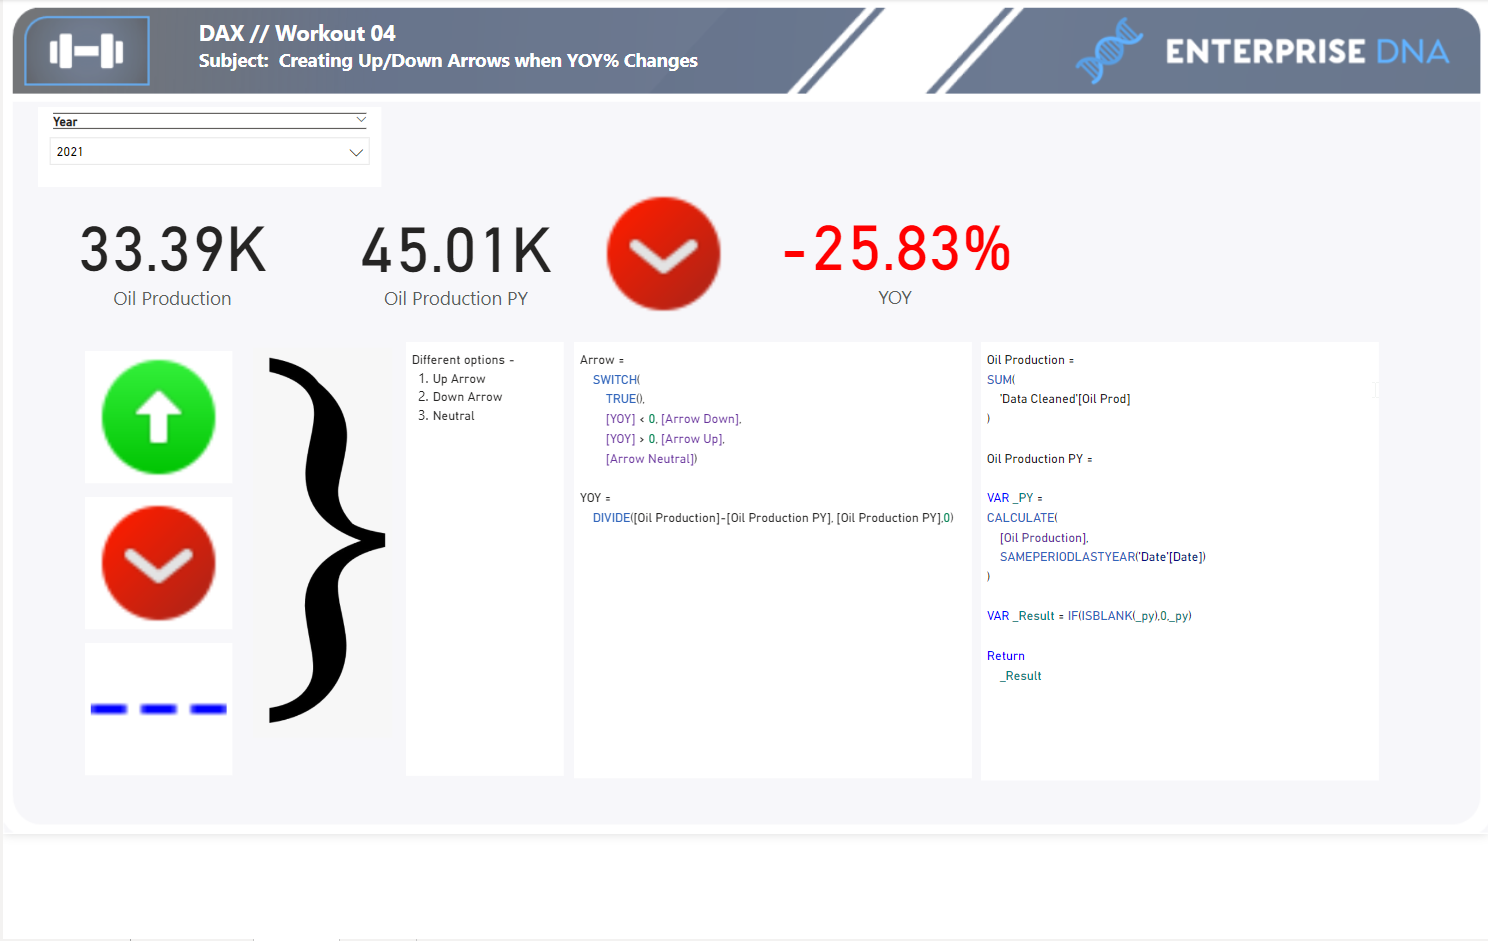
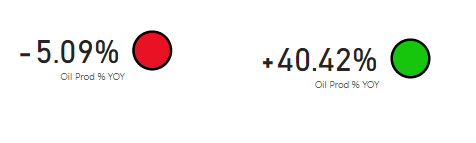
Everyone, great job on tackling this workout. Here is my approach. Probably a lot of steps compared to some of the great “one” measure approaches to do it all. I set up my solution so the YOY% is overlayed on top of each other as one visual.
So in order to do that, of course, you have a measure for Oil Production LY and Gross Oil Production.
Next the many measures.

![]()
I placed the red arrow card slicer behind the green arrow card slicer. So there is a total of 3 card slicers, one for the text, and two for the arrows.
All the best,
Paul
I hope I am not too late
I 100% agree with @Paul.Gerber - our goal here is to create a durable archive of problems that people can come back to and tackle any time.
Thanks for participating!
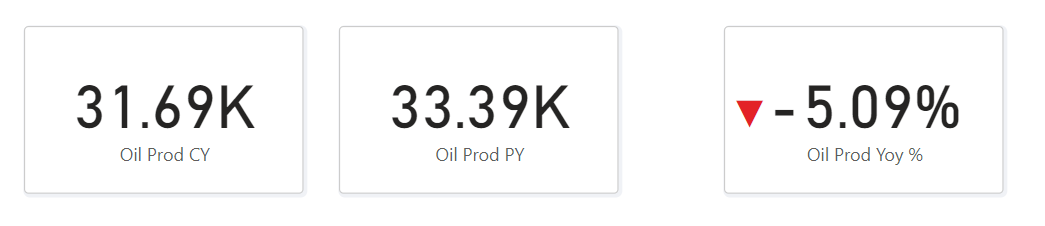
Oil Prod CY =
CALCULATE (
    [Oil Production Total],
    FILTER (
        ALL ( 'Date' ),
        'Date'[Year] = MAX ( 'Date'[Year] )
            && 'Date'[Date] >= MIN ( 'Date'[Date] )
            && 'Date'[Date] <= MAX ( 'Date'[Date] )
    )
)

Oil Prod PY =
CALCULATE (
    [Oil Production Total],
    FILTER (
        ALL ( 'Date' ),
        CONTAINS (
            VALUES ( 'Date'[Prior Year Date] ),
            'Date'[Prior Year Date], 'Date'[Date]
        )
    )
)

Oil Prod YoY =
[Oil Prod CY] - [Oil Prod PY]

Oil Prod Yoy % =
DIVIDE([Oil Prod YoY], [Oil Prod PY])

Arrows =
VAR __OilProdYoYPerc = [Oil Prod Yoy %]
VAR __Result =
    SWITCH (
        TRUE (),
        __OilProdYoYPerc > 0, UNICHAR ( 9650 ),
        __OilProdYoYPerc < 0, UNICHAR ( 9660 ),
        "-"
    )
RETURN
    __Result

CondFormat =
VAR __OilProdYoYPerc = [Oil Prod Yoy %]
VAR __Result =
    SWITCH (
        TRUE (),
        __OilProdYoYPerc > 0, "#00A300",
        __OilProdYoYPerc < 0, "#E32227",
        "#F8D210"
    )
RETURN
    __Result
DAX Workout No4.pbix (378.0 KB)
Giving my response to this workout. It was a bit difficult for me, and I ended up looking at other people’s responses for “inspiration”. I hope that still counts.
Here are the measures I used:
Current Year Oil Prod =
SUM('Data Cleaned'[Oil Prod])
Last Year Oil Prod =
CALCULATE(SUM('Data Cleaned'[Oil Prod]),
DATEADD('Date'[Date], -1, YEAR))
YOY% =
VAR growth = [Oil Prod LY] - [Total Oil Prod]
VAR YOY =
IF(
OR(ISBLANK([Oil Prod LY]), ISBLANK([Total Oil Prod])),
BLANK(),
DIVIDE(growth,[Oil Prod LY], 0)
)
RETURN YOY
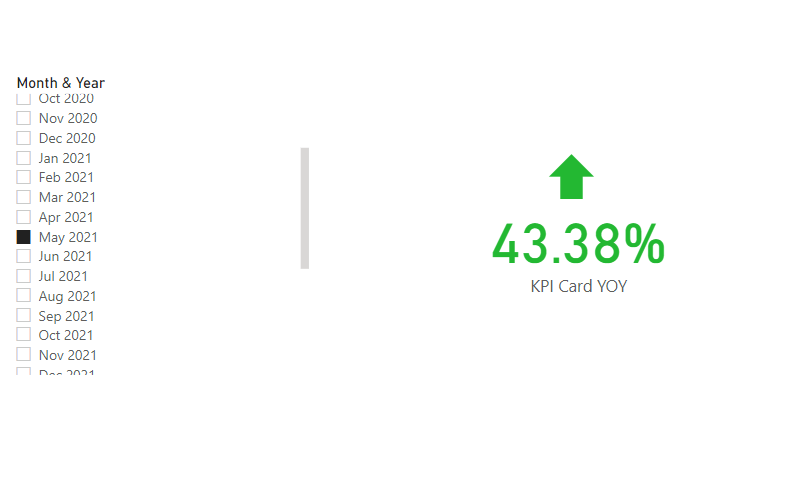
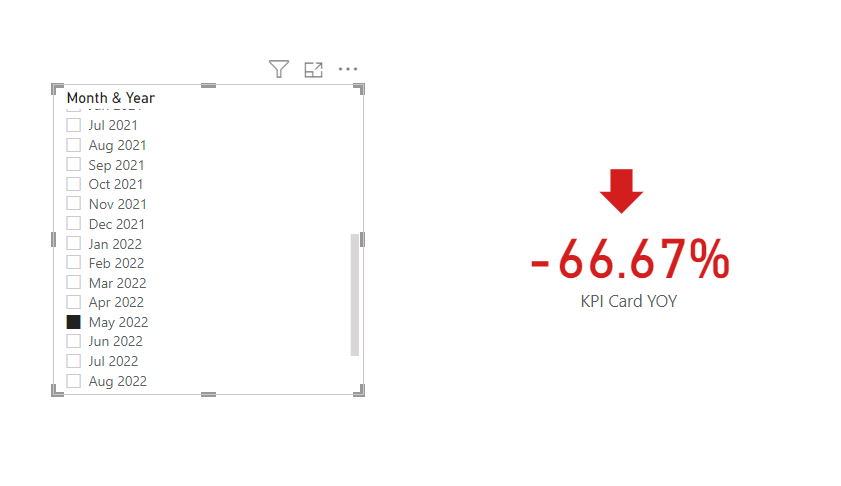
KPI Card YOY =
SWITCH(TRUE(),
[YOY%] > 0, "🡅 " & FORMAT([YOY%], "0.00%"),
[YOY%] < 0, "🡇 " & FORMAT([YOY%], "0.00%")
)
I used the YOY% values to set the conditional formatting rules, while the KPI card YOY is the value that appears on the card.
I also had to switch to a basic Card Visual because the KPI card visual doesn’t seem to work with text. And I’d had to convert my values to text to for the icon to work
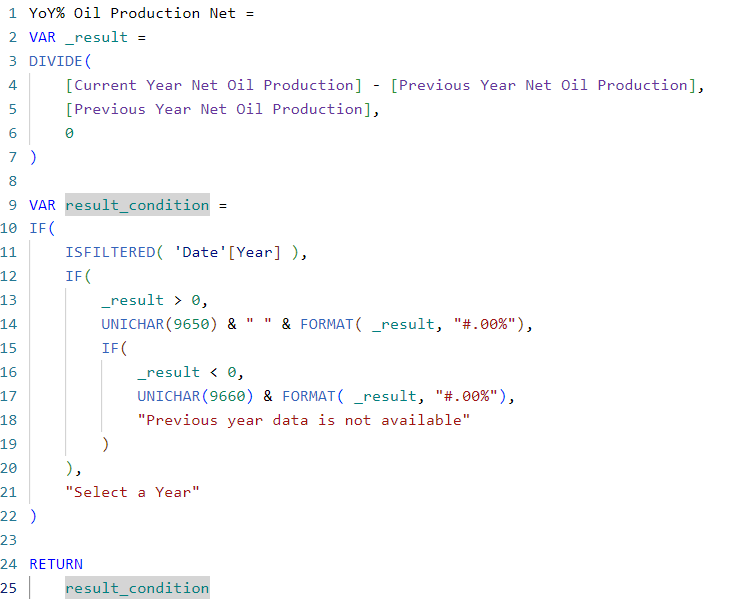
I have tried something new therefore I am getting a different number then required by the workout.
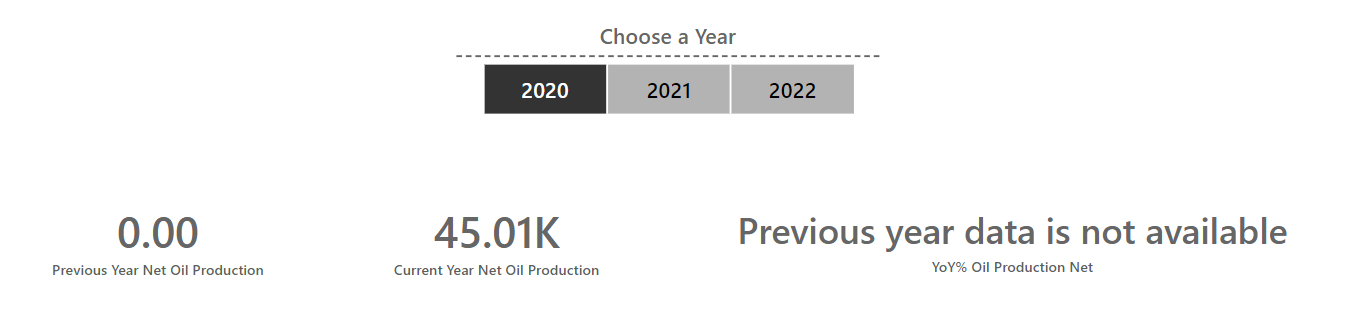
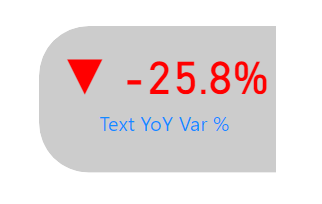
Condition 1: If no year is selected then default value displayed in card visual will be as shown below.
Condition 2: There are no data available for 2019 so what information will be displayed is shown below:
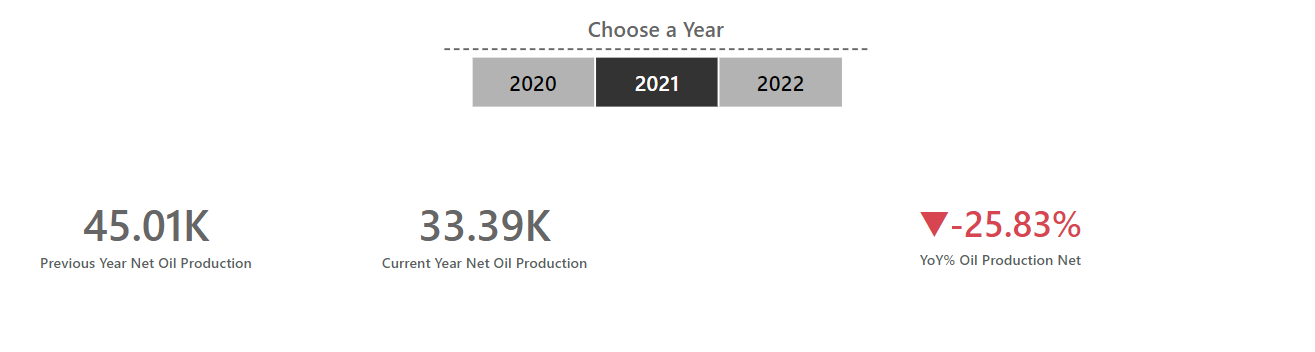
Condition 3: Common Case.
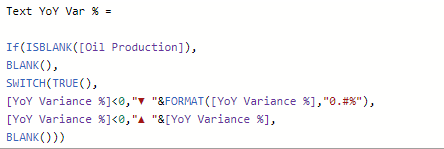
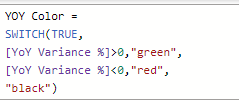
DAX Measures:
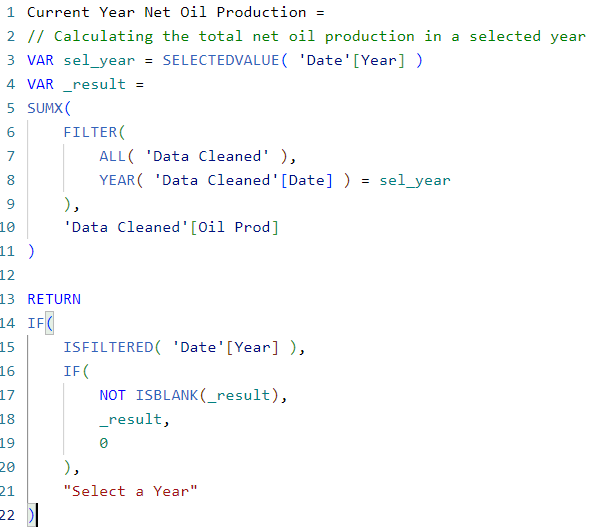
a) Current Year Net Oil Production:
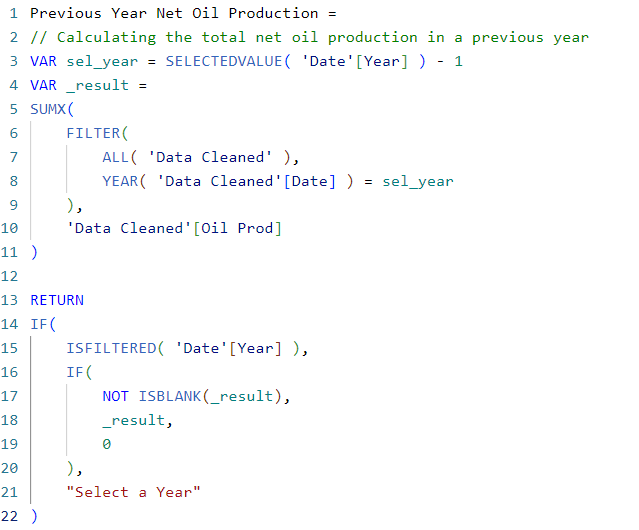
b) Previous Year Net Oil Production:
c) YoY% Oil Production Net: