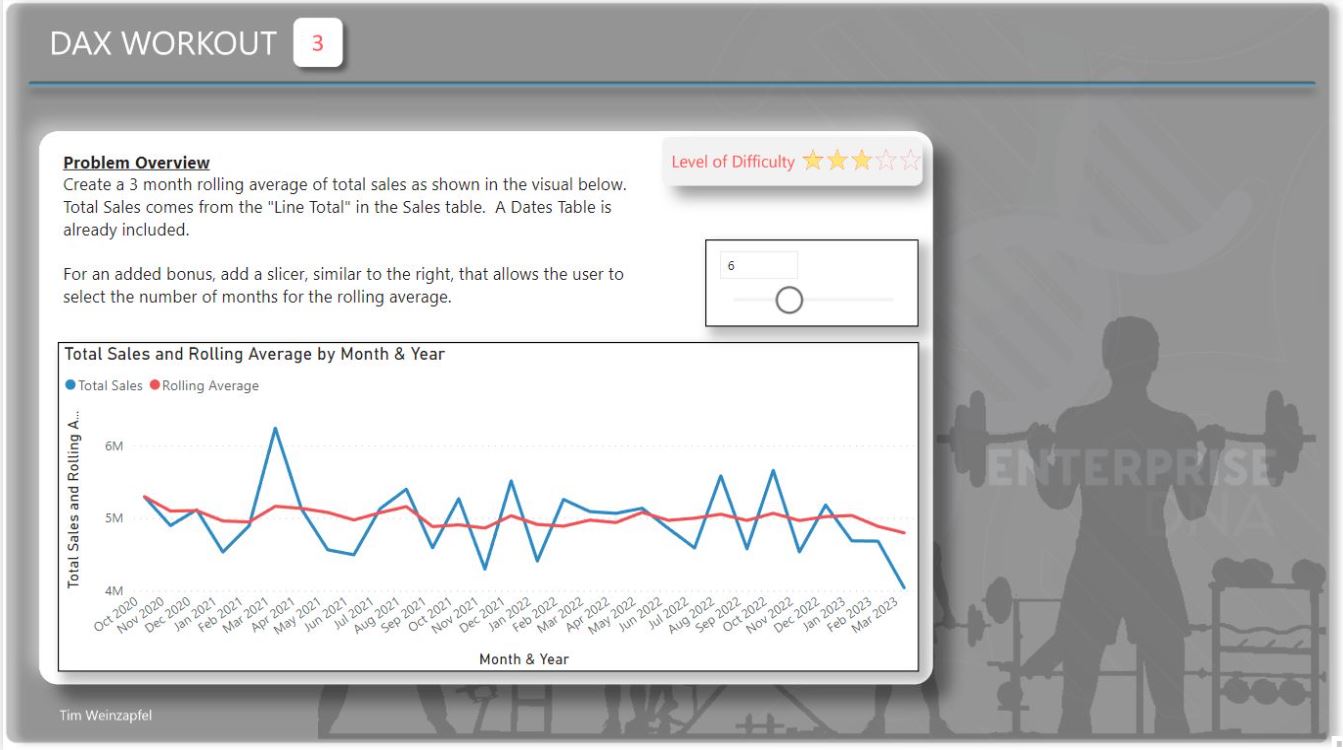
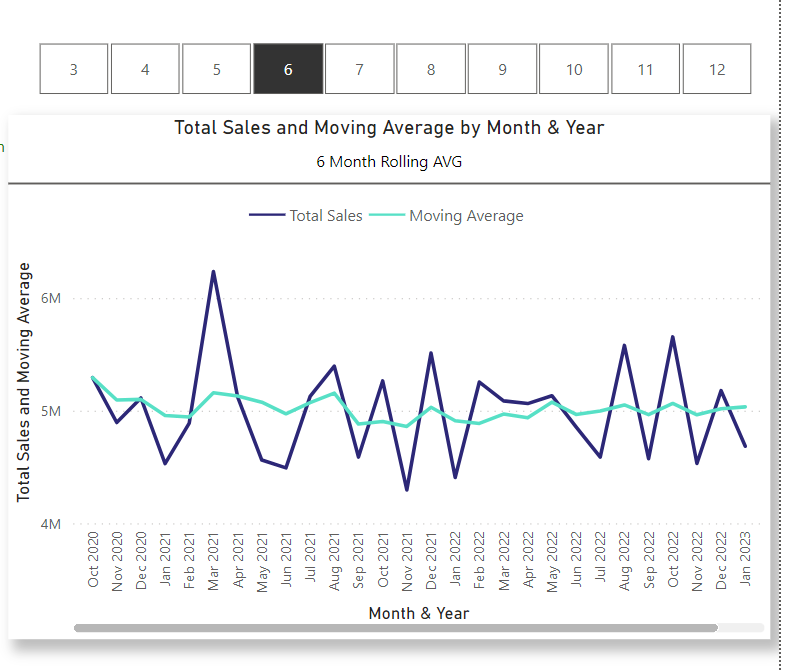
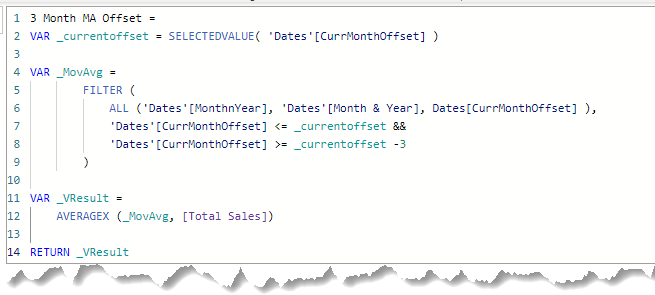
For this workout you are to create a 3 month rolling average measure for the total sales as provided in the included PBI file.
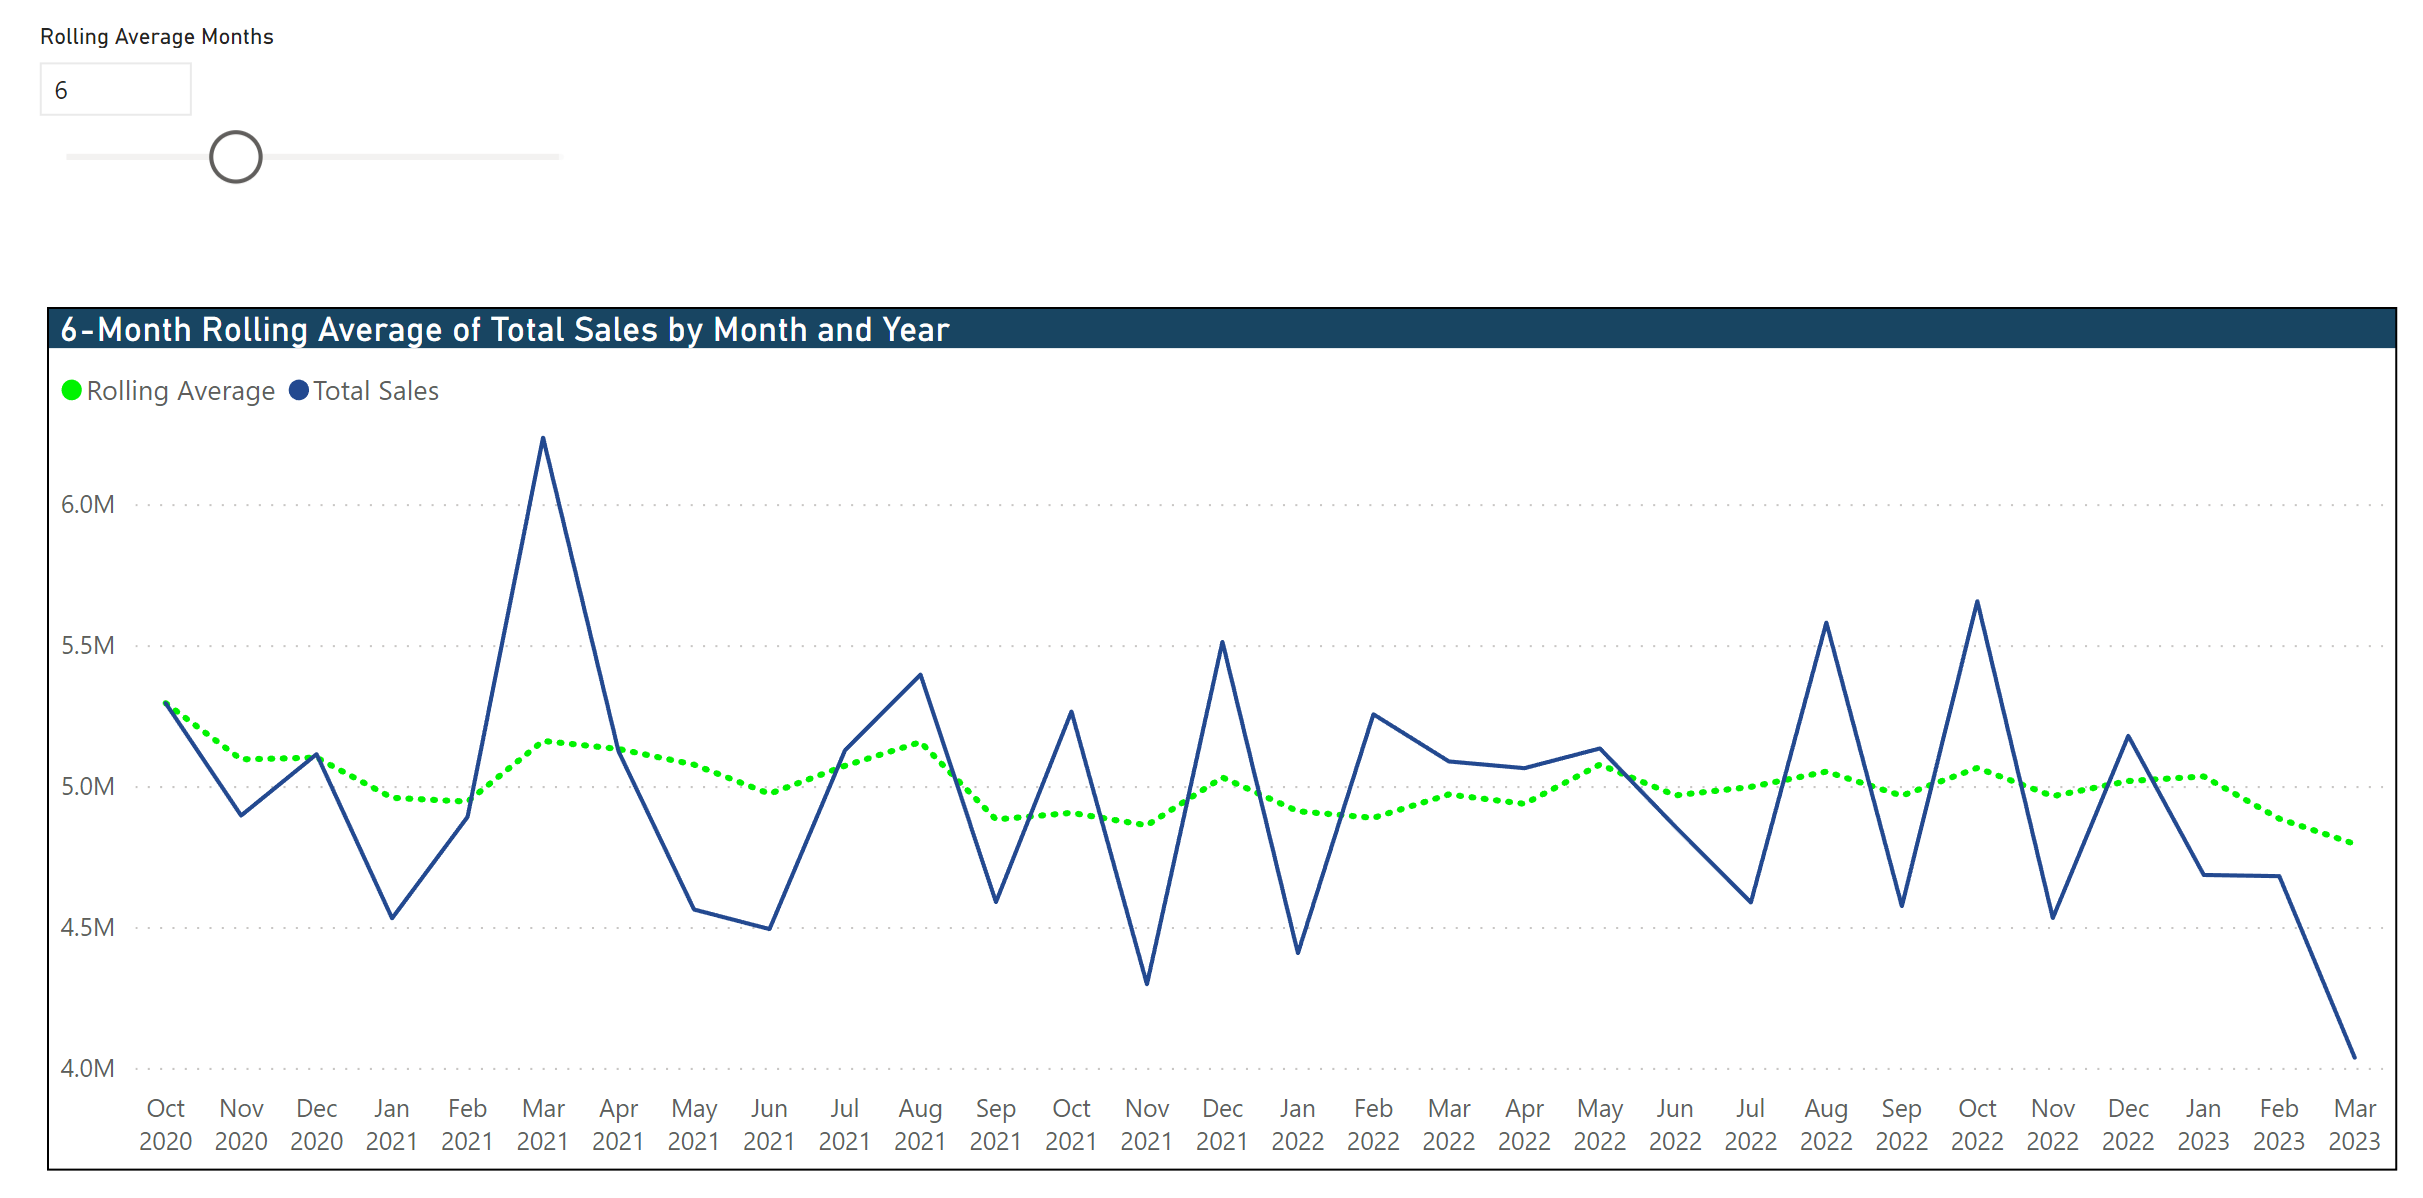
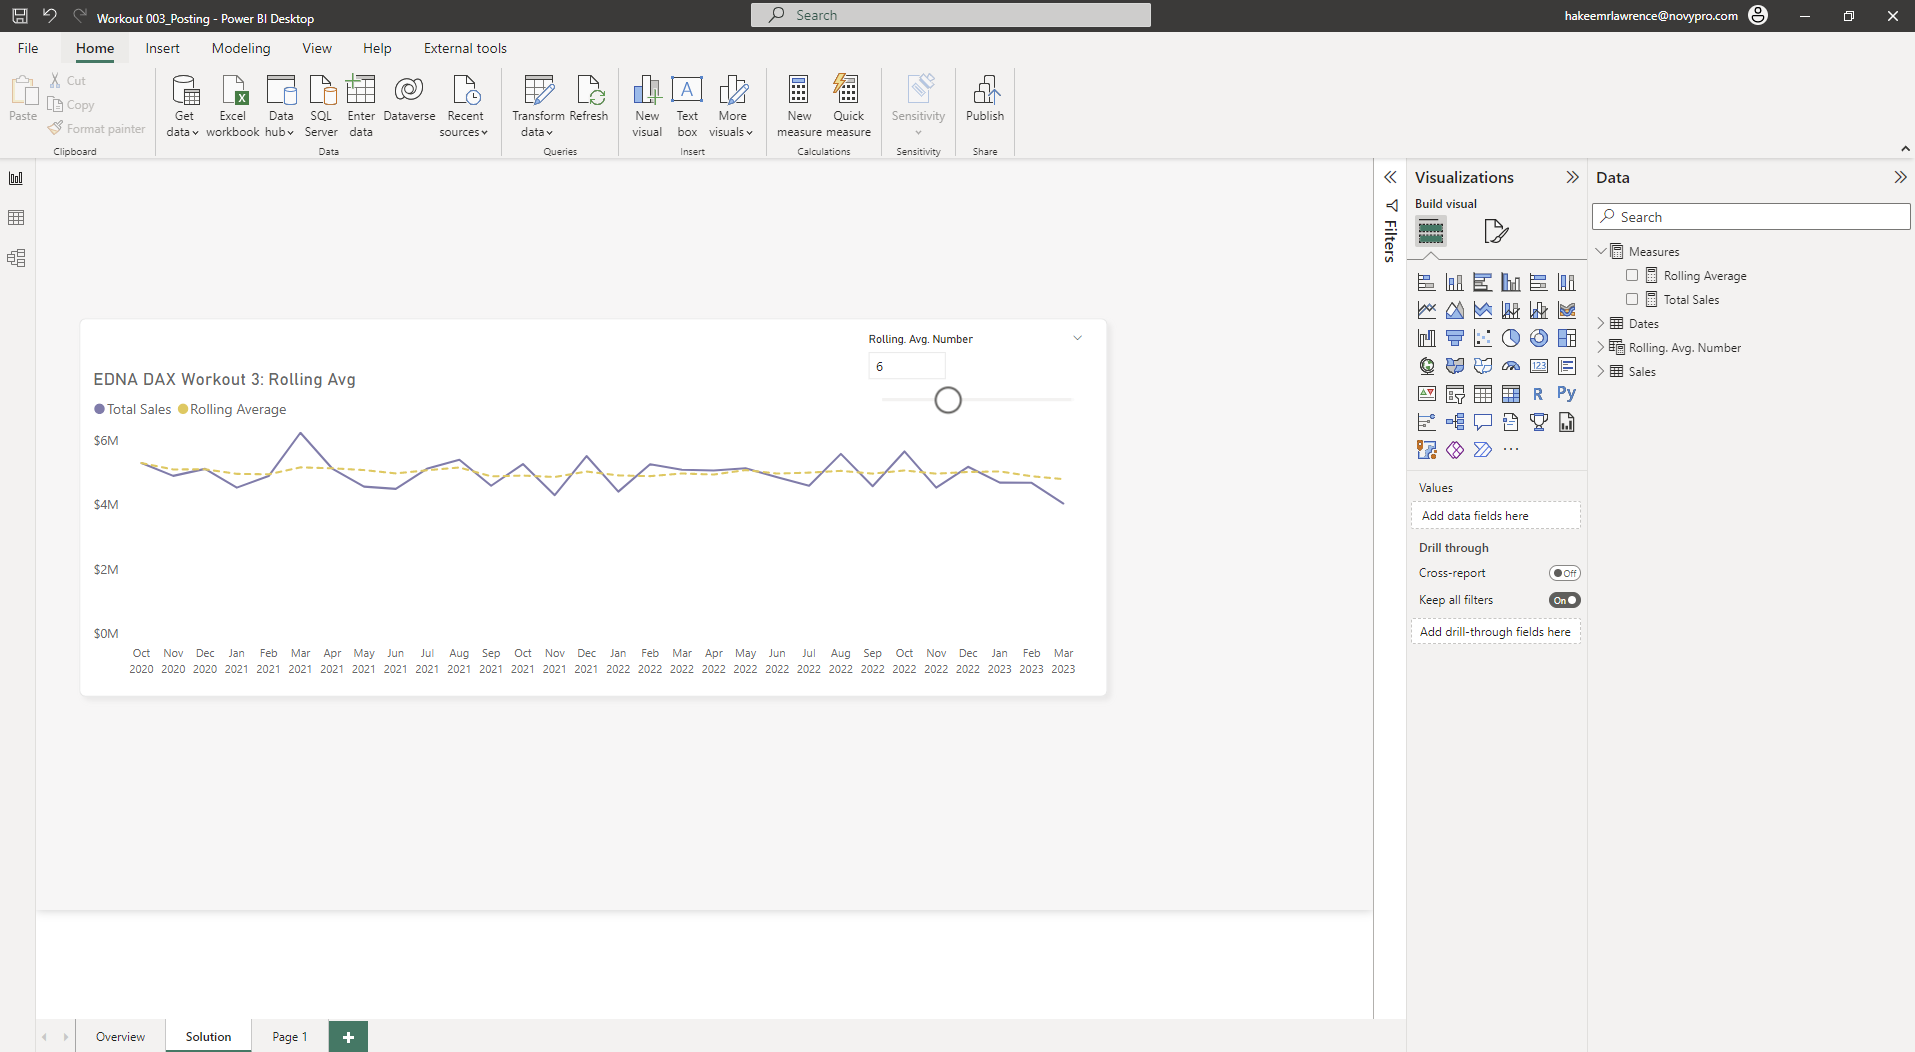
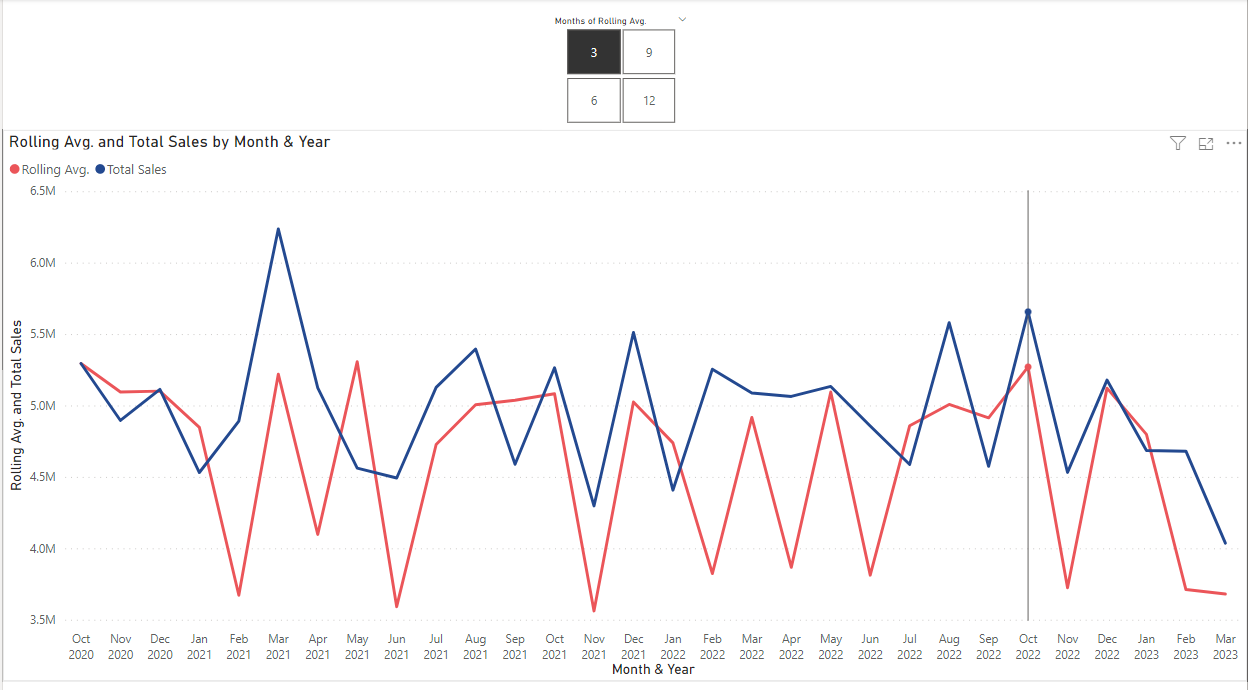
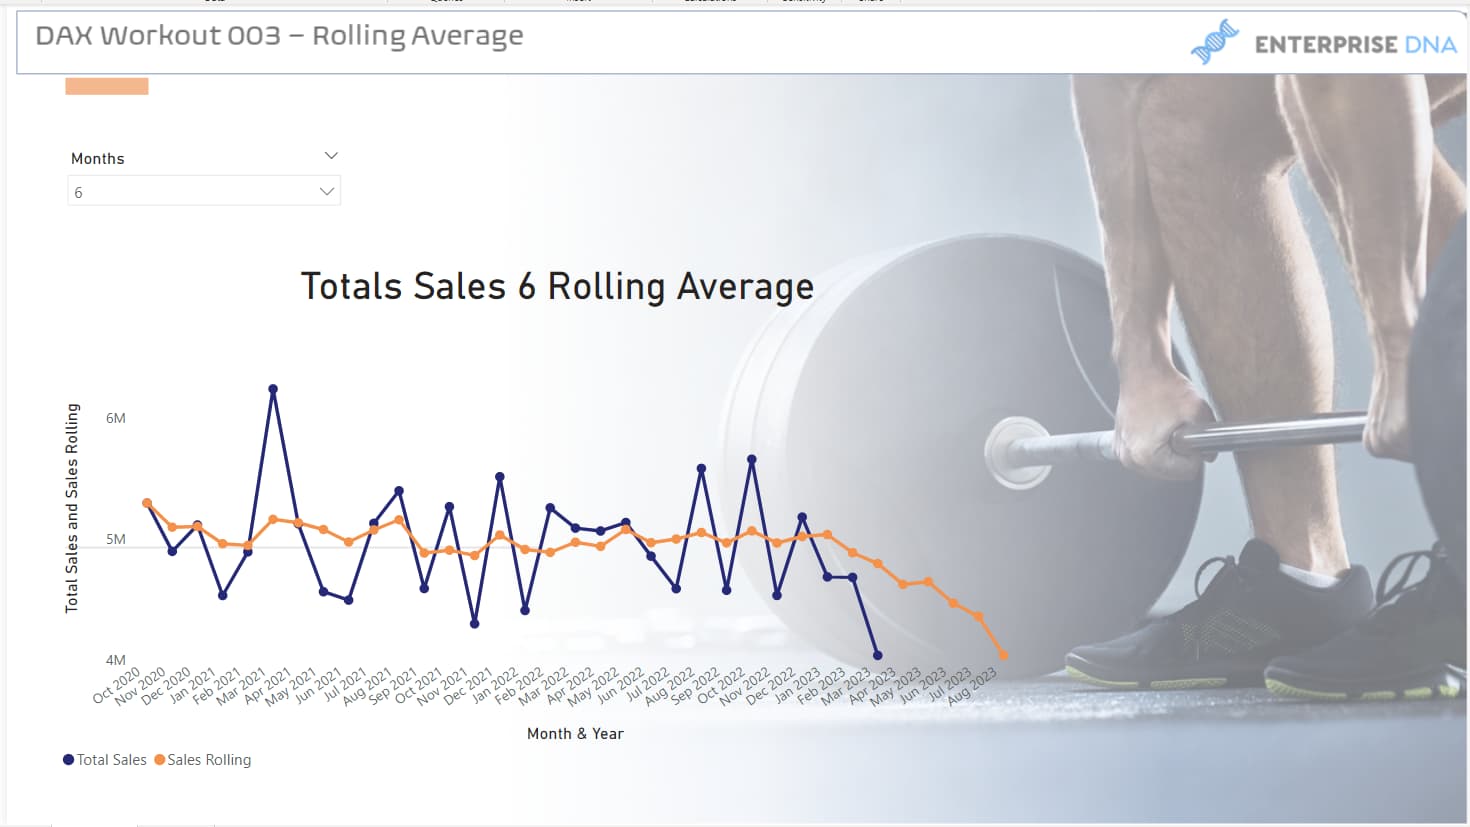
For an added bonus, instead of using a 3 month average - include a slicer that allows the user to choose between a 3 and 12 month average. (Note - the picture included here has the slicer set to a 6 month average)
The PBI file is included. It includes the data as well as a Dates Table that you are free to use.
Load the supplied file into a new Power BI file, create your solution, and reply to this post. Upload a screenshot of your solution along with the DAX measure. Please format your DAX code and blur it or place it in a hidden section.
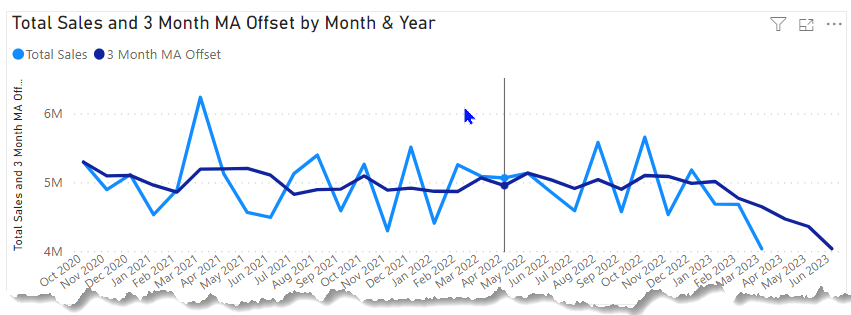
A bit of Offset magic, a pinch of “No CALCULATE” DAX and Presto! - a 3-star problem becomes a 1-star…
Click to show DAX code
Rolling Average =

// Capture the current monthly offset from the Dates Table
VAR _CurrMoOffset = SELECTEDVALUE( Dates[CurrMonthOffset] )

// Filter the Dates table to include only the current month back the number
// of months selected in the slider (add one because the endpoint counts too)
VAR _vtable =
    FILTER(
        ALL( Dates[MonthnYear], Dates[Month & Year], Dates[CurrMonthOffset] ),
        Dates[CurrMonthOffset] <= _CurrMoOffset &&
        Dates[CurrMonthOffset] >= _CurrMoOffset - [Rolling Average Months Value] +1
    )

// Average the total sales over the monthlt table above - easy peasy!
VAR _MovingAvg =
AVERAGEX(
    _vtable,
    [Total Sales]
)

// Stops calculation if after current month
VAR _Result =
IF( _CurrMoOffset <= 0, _MovingAvg, BLANK())

RETURN
    _Result
Interestingly, Financial Times does their quantitative graphics using ggplot2.
There’s actually an R package called ft_theme that enables you to transform your R charts into Financial Time format just by changing a single parameter.
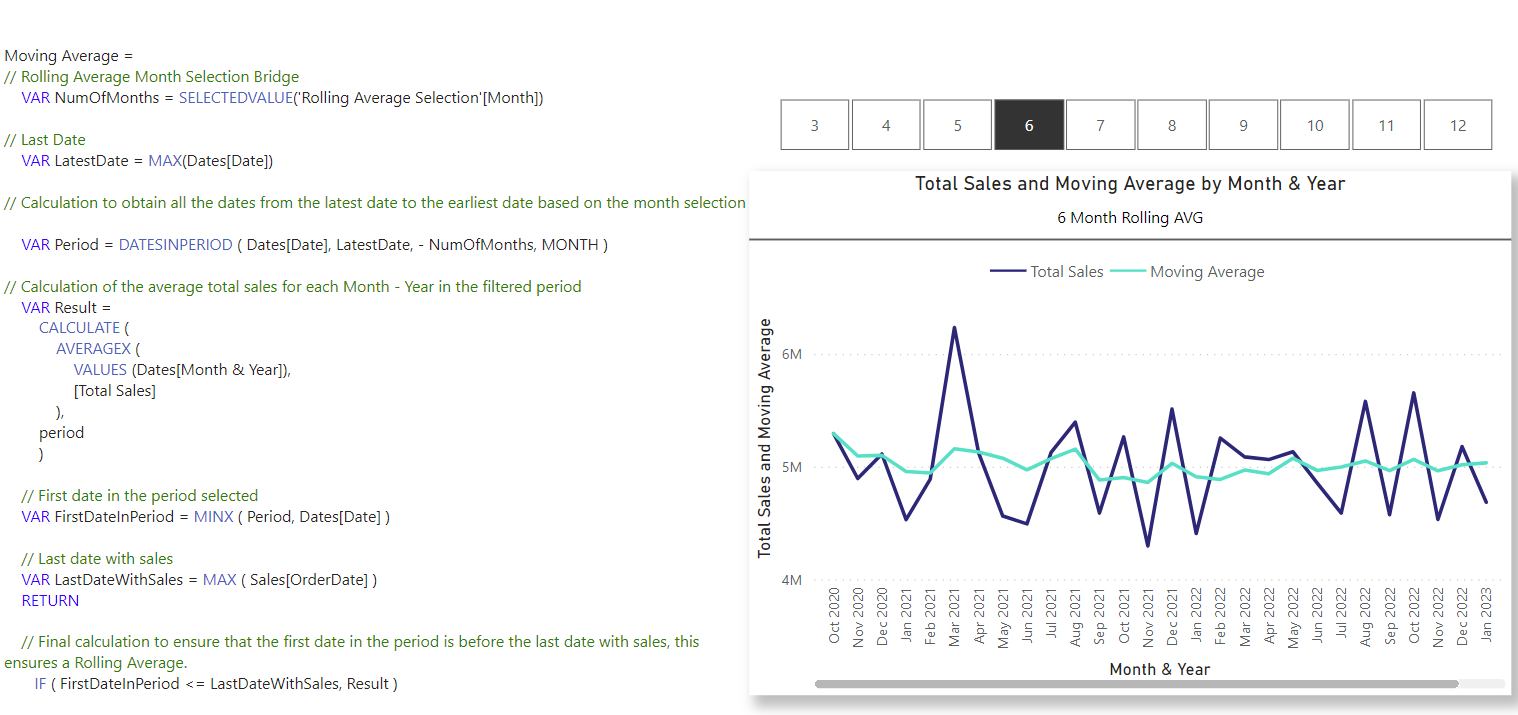
Rolling avg sales =

VAR _selectedPeriod = SELECTEDVALUE('Selected Months'[Selected Months]) //this is a created parameter with values from 1 to 12

VAR _lastDate = MAX(Dates[Date])

VAR _period = DATESINPERIOD(Dates[Date], _lastDate, -_selectedPeriod, MONTH)

VAR _result = CALCULATE(AVERAGEX(VALUES(Dates[MonthnYear]), [Total Sales]), _period)

RETURN

IF([Total Sales] > 0, _result)
I haven’t created parameters before, so definitely learned something new!
Cool, I went to a talk a couple of weeks back which the Head of Data Viz for the FT gave a talk, really interesting as he talked about how they started out as a small team and are now the largest team. It was also interesting to hear him say how more stories are being ‘data led’ now rather than a story occuring then the data is looked at or asked for.
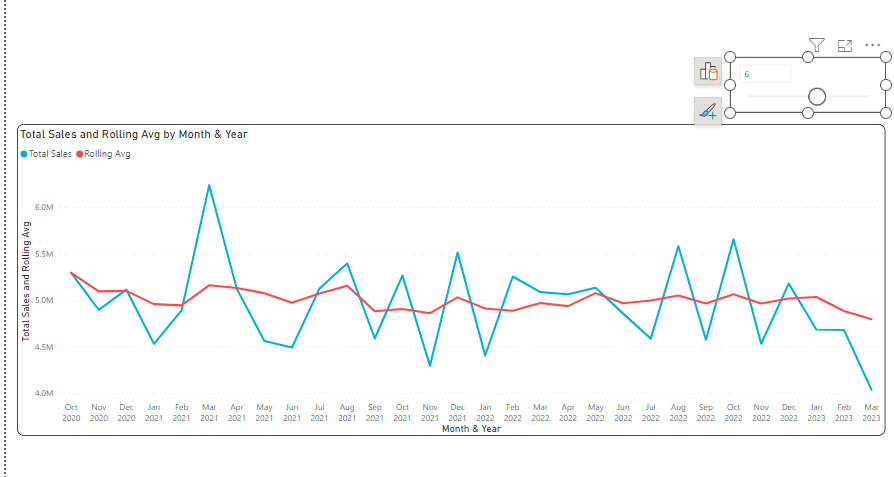
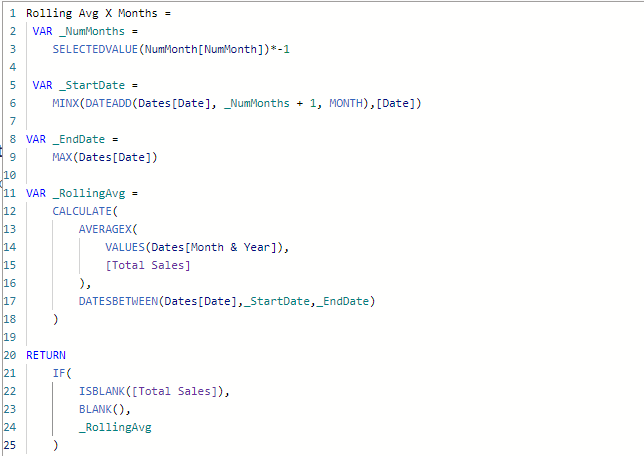
Rolling Average =

var _selVal = SELECTEDVALUE('Rolling. Avg. Number'[Rolling. Avg. Number]) --Rolling Avg. Number

var rollAvg = CALCULATE(
                            AVERAGEX(VALUES(Dates[MonthnYear]),[Total Sales]),
                            DATESINPERIOD(Dates[Date], MAX(Dates[Date]), -_selVal, MONTH) --Rolling Avg. using selected Rolling Avg. Number
                        )
var result = IF(ISBLANK([Total Sales]),   -- Show Rolling Avg. if there are sales
                BLANK(),
                rollAvg
                )

return

result
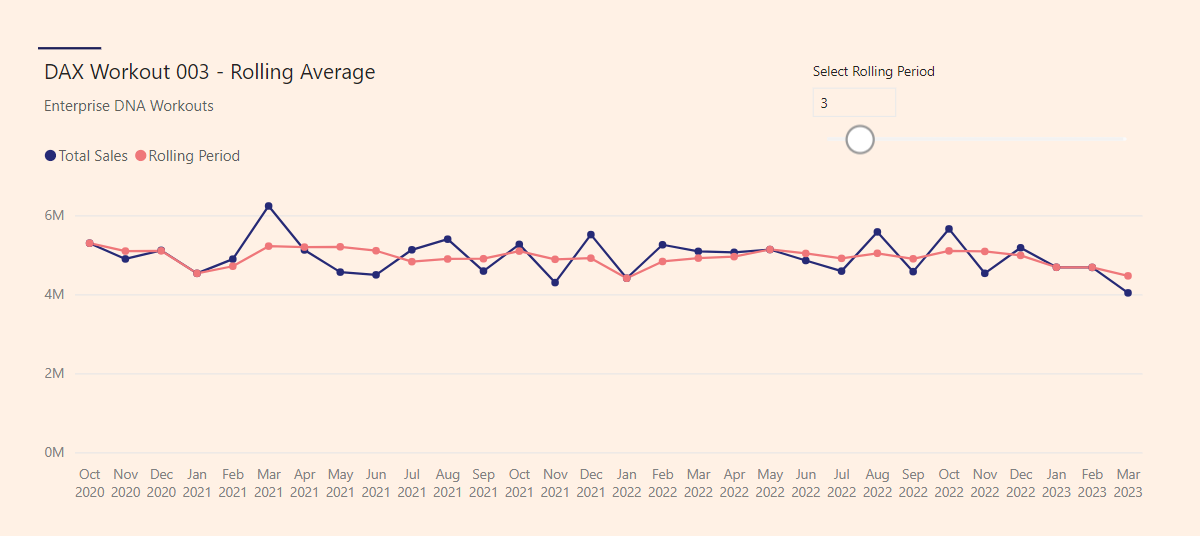
@tweinzapfel Here is mine for fun or somewhat fun. I had some help from @Greg with this. I had a crazy thought and decided to do it in Deneb. Thank you, @Greg. I didn’t add the slicer yet. I did do it the “normal” way by using the standard visual in PBI.
One of the things I like so much about it is that it’s a predictable, replicable pattern for every single measure. Once you get the general hang of it, it’s just filter table by offset conditions, aggregate over that table, rinse and repeat.
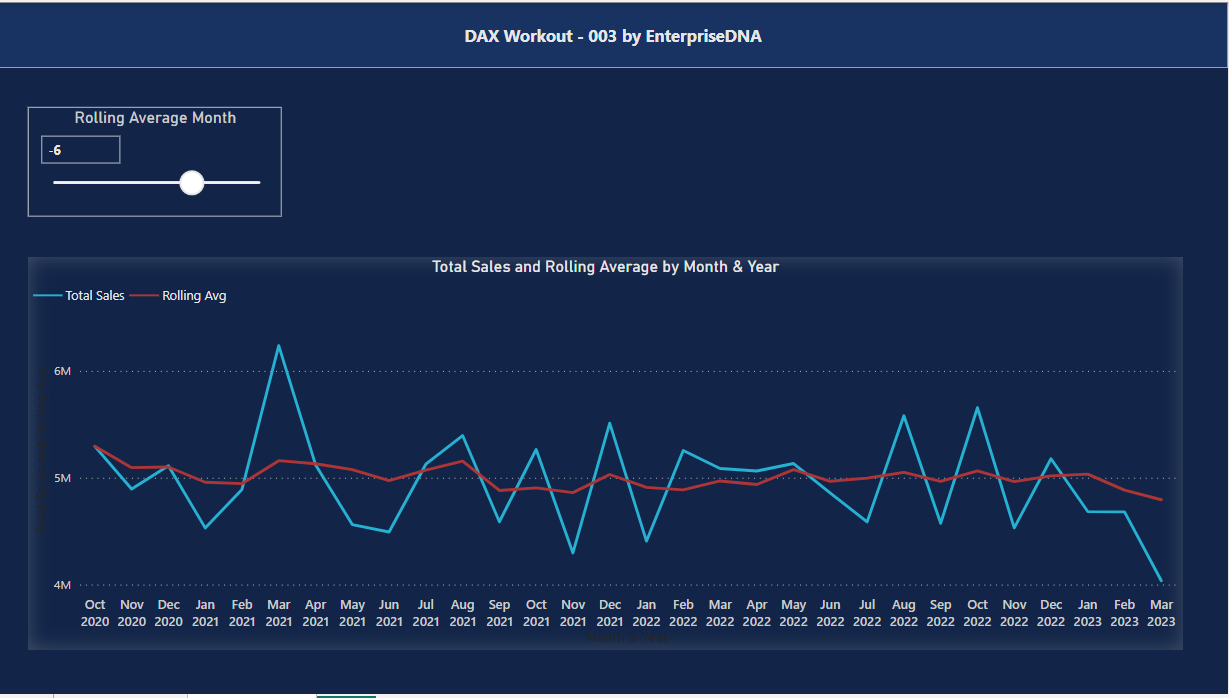
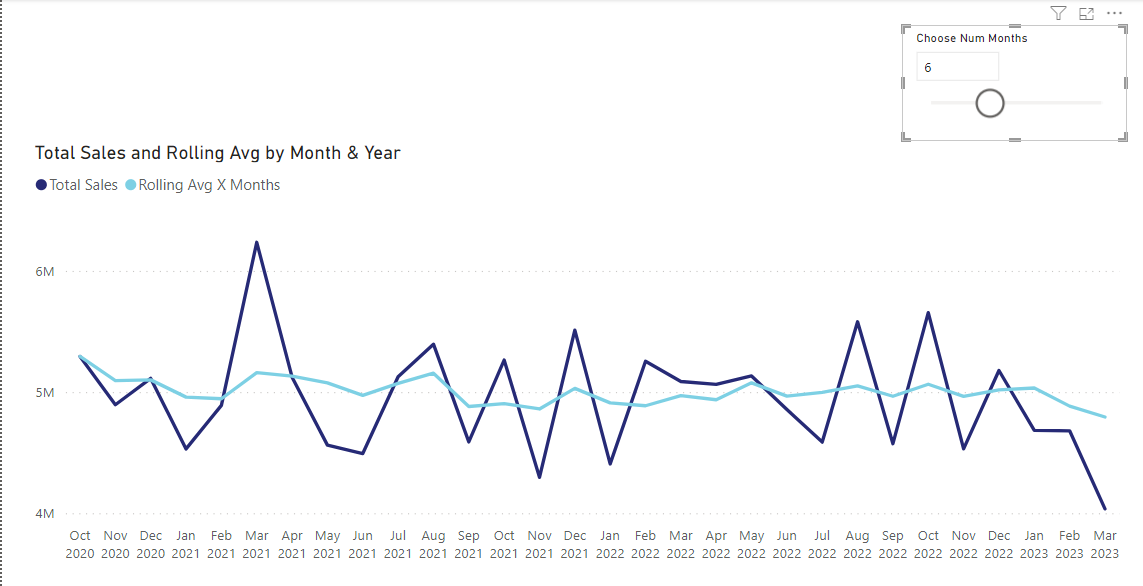
Mine is attached. One interesting thing that people may not be aware of is how to create a sliding slicer with just one value. The default slicer produces ranges so you can either choose between a “between”, “less than” or “greater than” which doesn’t allow for that user experience of using a slider to pick a single numeric number.
However, if you create a parameter (under the Modeling) section, it’ll allow you to create a slicer.
DAX Measure
Rolling Average =
VAR NumOfMonths = SELECTEDVALUE(‘Month Selector’[Month Selector])
VAR LastCurrentDate =
MAX ( ‘Dates’[Date] )
VAR Period =
DATESINPERIOD ( ‘Dates’[Date], LastCurrentDate, - NumOfMonths, MONTH )
VAR Result =
CALCULATE (
AVERAGEX (
VALUES ( Dates[Month & Year] ),
[Total Sales]
),
Period
)
VAR FirstDateInPeriod = MINX ( Period, ‘Dates’[Date] )
VAR LastDateWithSales = MAX ( Sales[OrderDate] )
RETURN
IF ( FirstDateInPeriod <= LastDateWithSales, Result )