Hello everybody, i share me solution for this great great challenge.
Workout 003_Posting.pbix (512.4 KB)
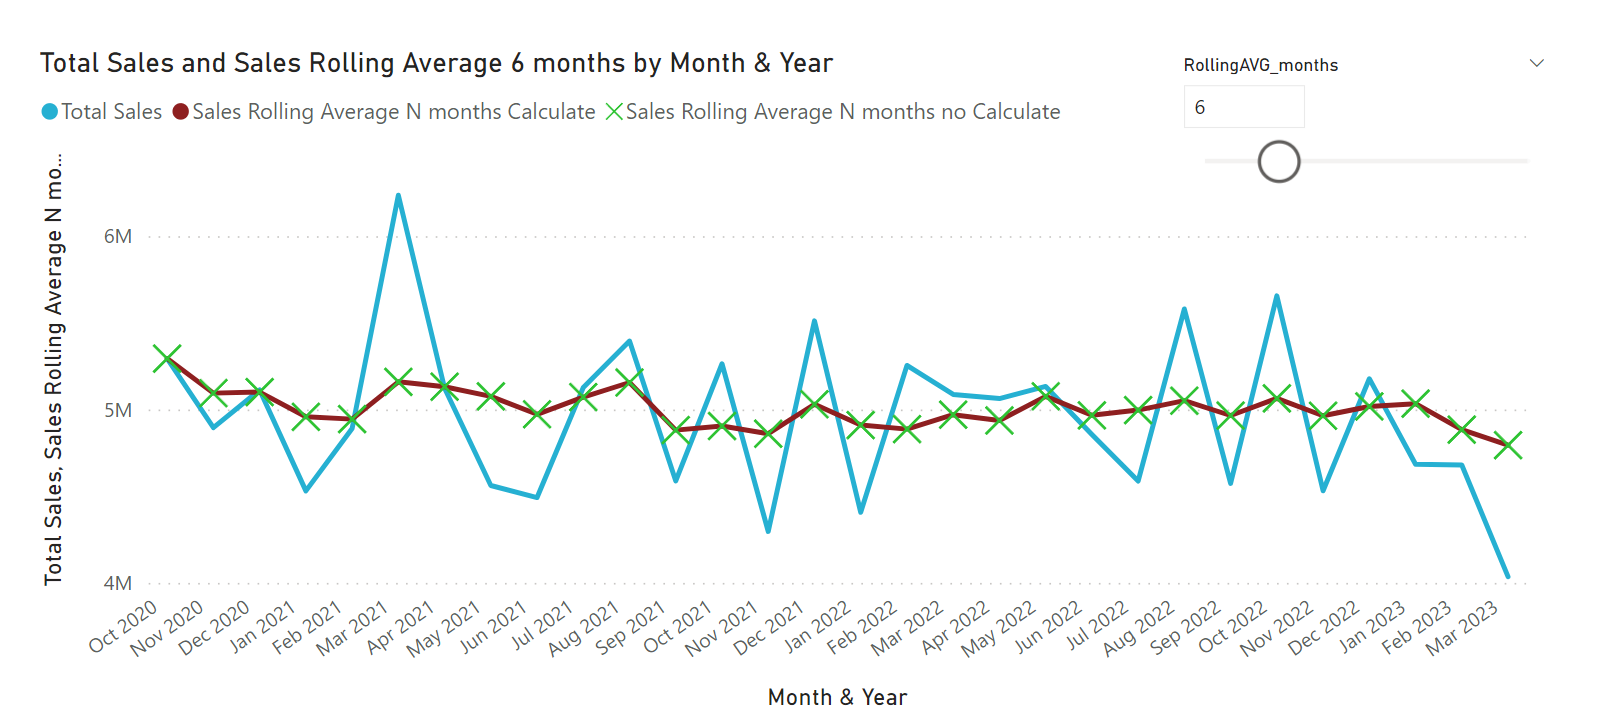
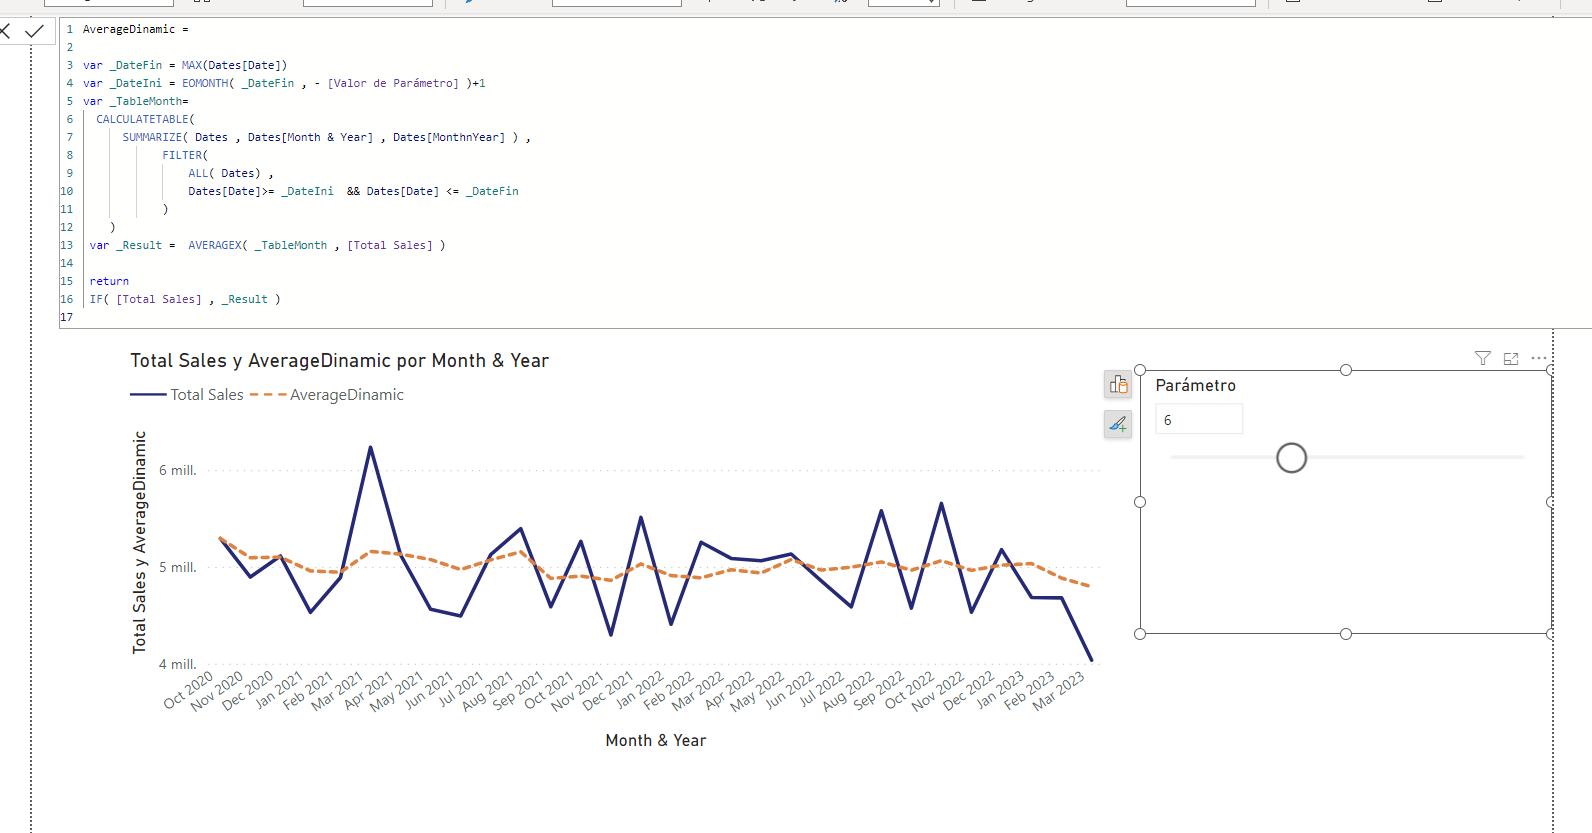
Hello everybody, i share me solution for this great great challenge.
DAX measure in Calculate and Calculate-free variant.
The longest time spent to find all Dates table columns of YYYYMM granularity… ![]()
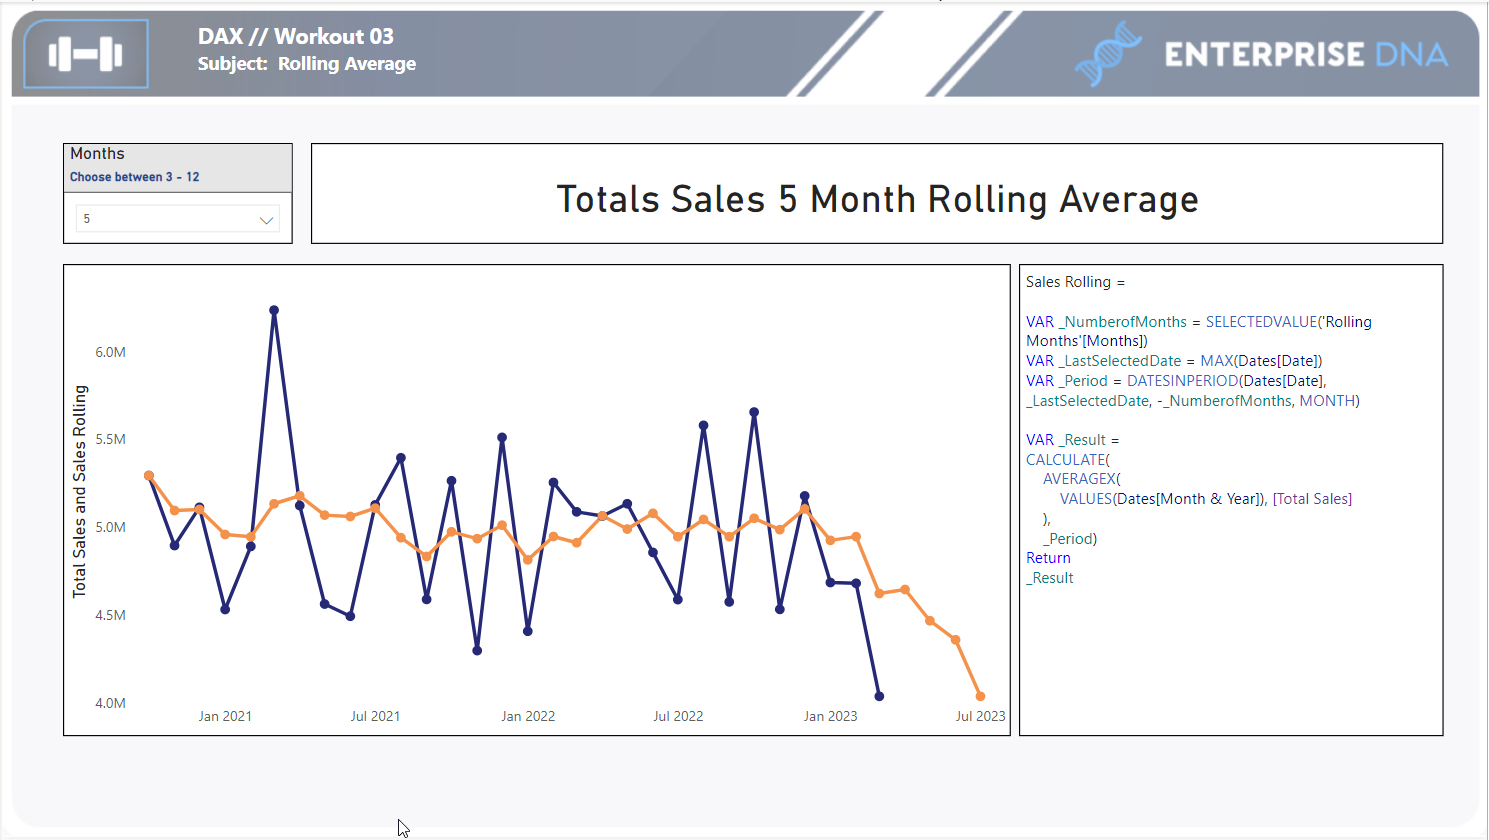
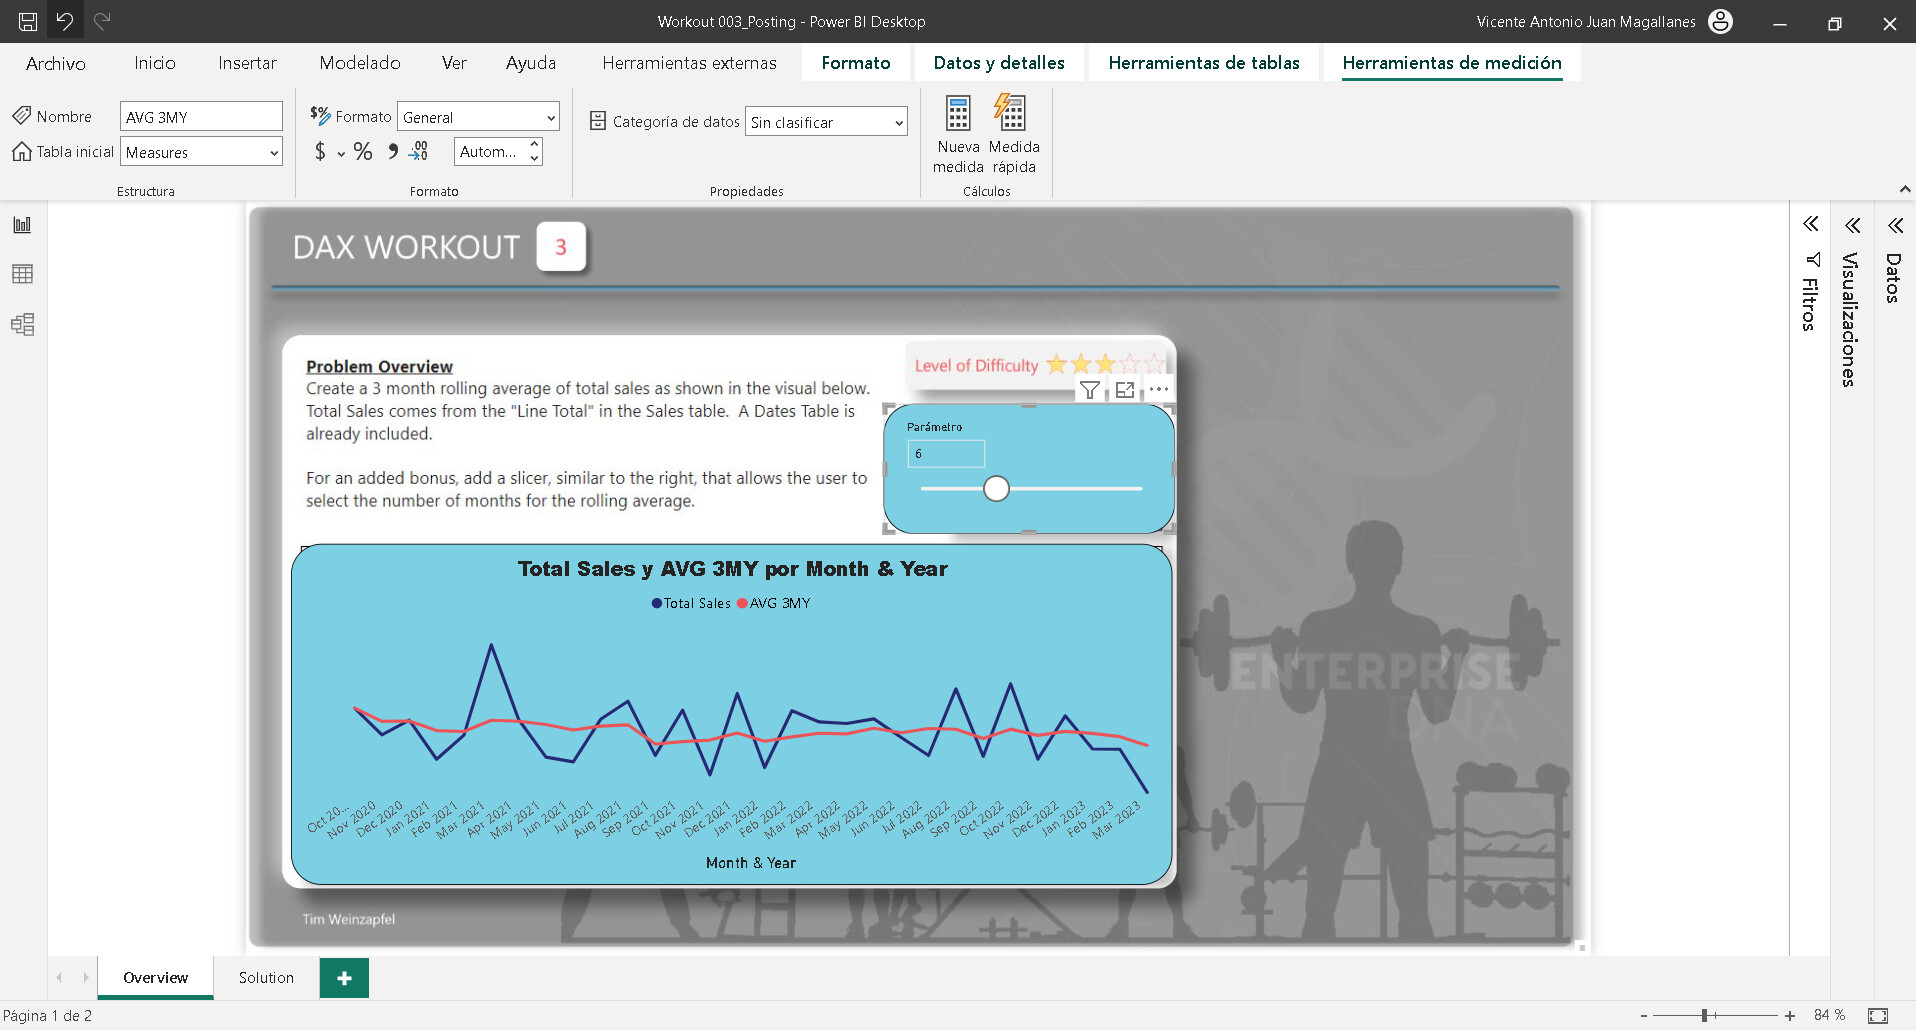
@tweinzapfel thanks for the workout, I thought this was going to take 5minutes until I realised months was more complicated!
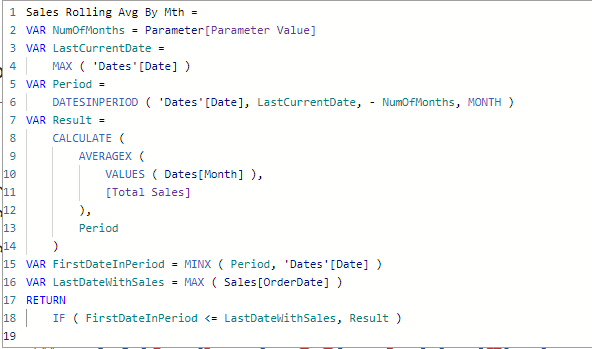
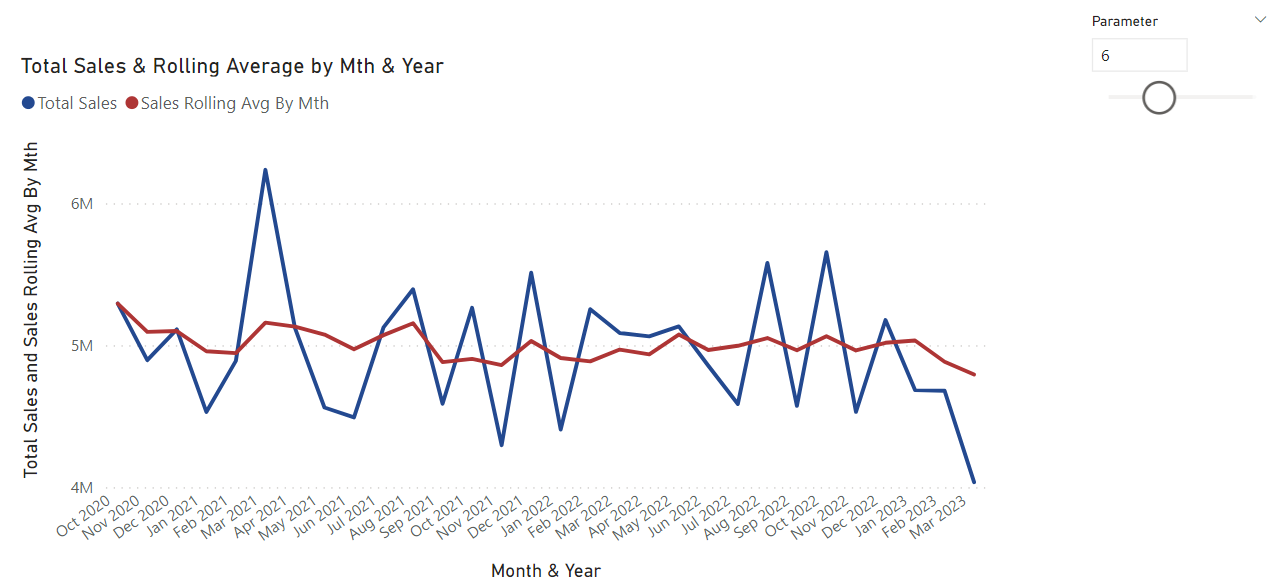
Here is my solution:
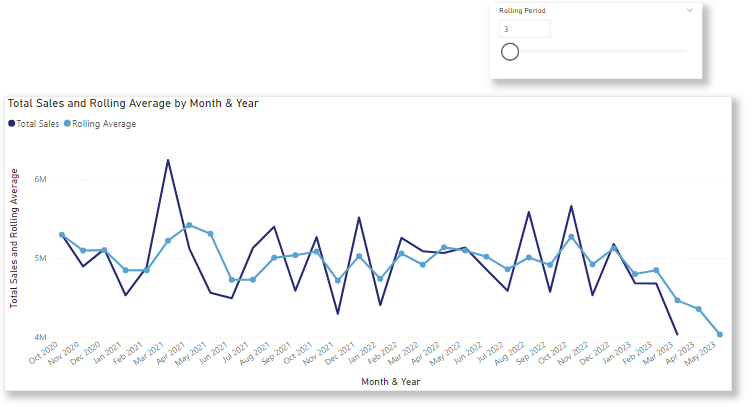
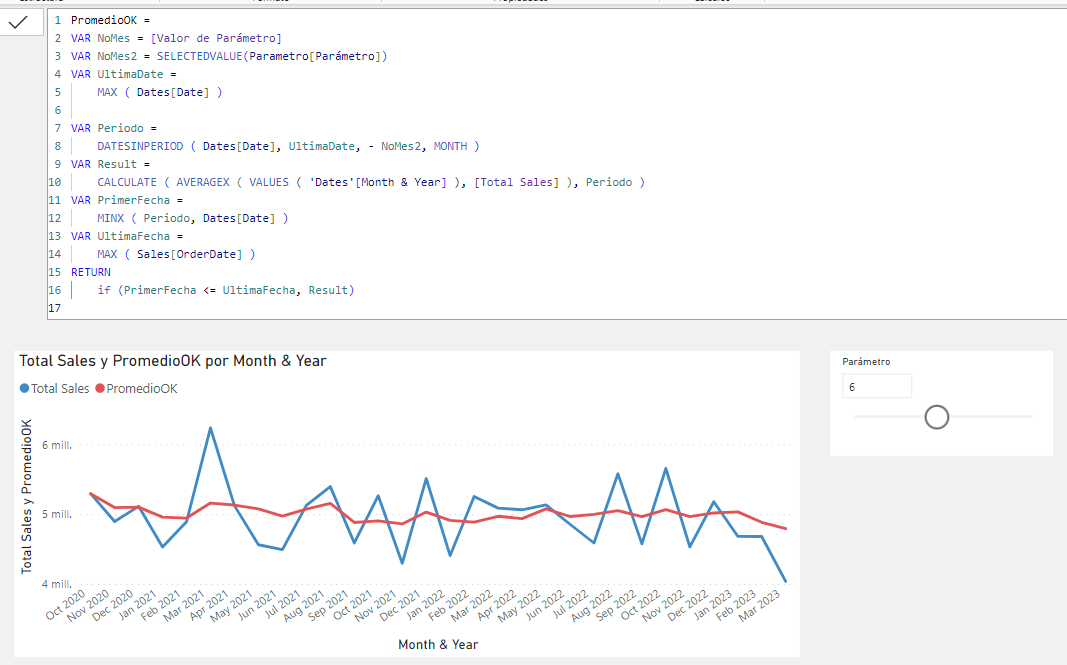
I’m a bit late to this one and I can’t add anything of much value to the submissions already created except one (pedantic, sorry) observation. The rolling average calculations should include a check to make sure that the average only starts once it has enough data points to look back at. In addition to checking that we’re not plotting an average on the future dates with no sales, we should also check that the first date in our lookback period is >= the earliest date with sales. If this is done, the moving average should only start plotting once a full lookback period of sales data has been plotted. So if the lookback period was 6 months for example, the first point on the rolling average line should be plotted on the 6th month. Any plots before this aren’t a 6 month average. This check could be done by adding a check to such as FirstDateInPeriod>=FirstDateWithSales where the second variable would be defined as
VAR FirstDateWithSales = CALCULATE(MIN(Sales[OrderDate]),REMOVEFILTERS())
and the resulting condition becomes:
IF ( (FirstDateInPeriod <= LastDateWithSales) && (FirstDateInPeriod>=FirstDateWithSales), Result )
We should also consider whether we want to include the last data point in Mar 2023. There are only Sales up to the 24th March 2023 so it’s not a full month. Given that the other month averages are based on full months it might be wrong to show the March value because it’s not comparable. If the company gets most of its sales in the last week of the month then showing sales and an average for this month could be misleading.
To add this extra check you would change the condition to check whether the LastDateInPeriod - VAR LastDateInPeriod = MAXX(Period,‘Dates’[Date]) - is <= LastDateWithSales. This would mean that Mar 2023 wouldn’t plot because the last date in the period is 31st Mar 2023 and the sales end on the 24th.
I hope this is helpful.
B
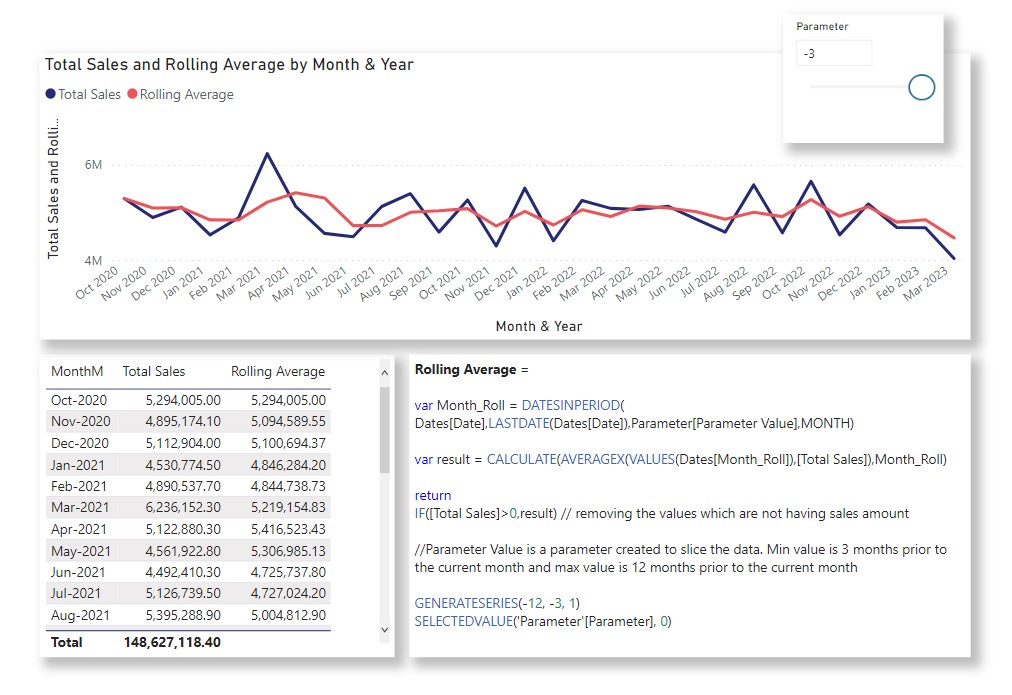
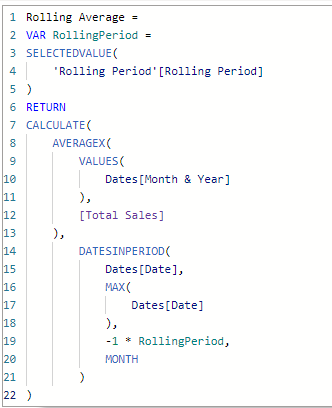
Rolling Average =

Var _Interval = SELECTEDVALUE('Rolling Month Average'[Rolling Month Average])
var _CurrentDate = MAX(Sales[OrderDate])
var _DatesInPeriod = DATESINPERIOD(Dates[Date],_CurrentDate,-_Interval,MONTH)
Var _SelectedPeriod = ROUND(DIVIDE(COUNTROWS((FILTER(_DatesInPeriod,[Total Sales]))),30),0)
var _RunningTotal = CALCULATE(SUMX(Sales,Sales[Line Total]),_DatesInPeriod)
Var _AverageSales = CALCULATE(AVERAGEX(Sales,_RunningTotal),_DatesInPeriod)

Return DIVIDE(_AverageSales,_SelectedPeriod)
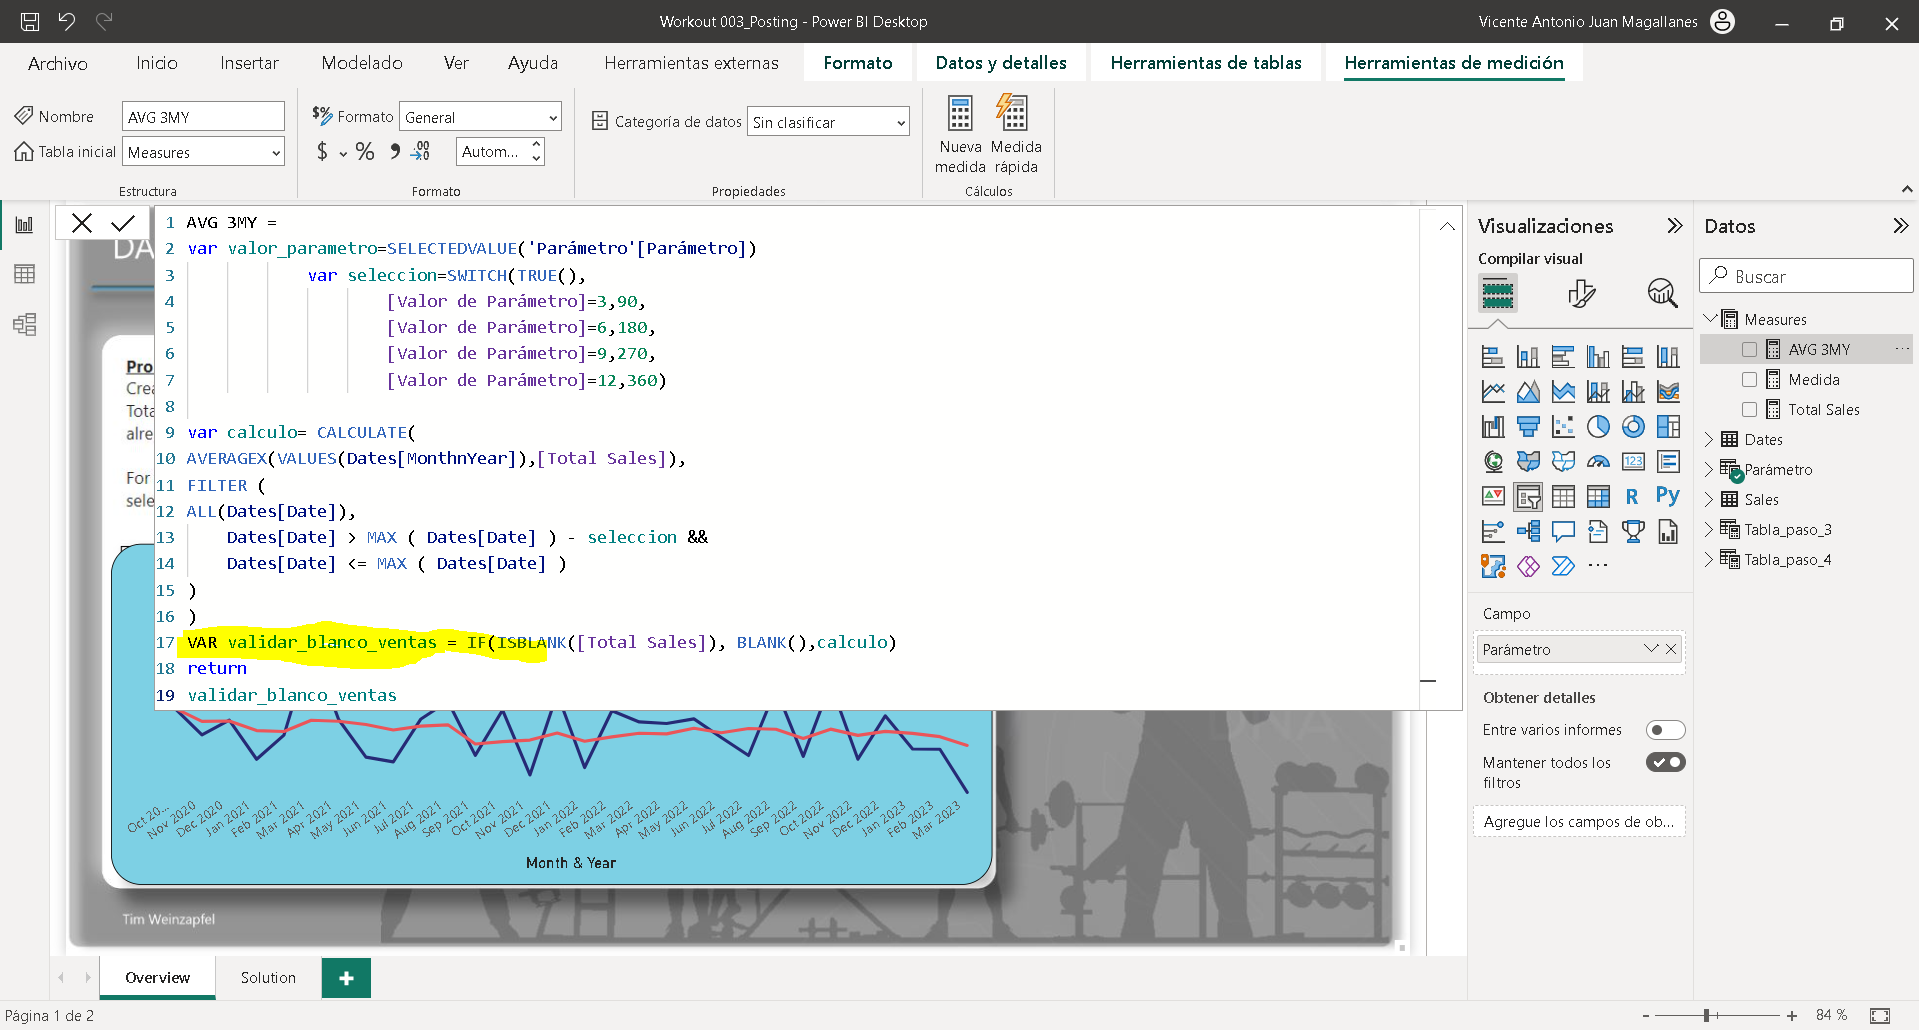
It’s only my second Workouts submission because after the first day, I realized I didn’t know enough DAX to participate in these challenges so I had to take some time off to get some proper learning before returning to practice using these workouts
Congratulations to me for being able to finally participate!
Here’s my DAX code:
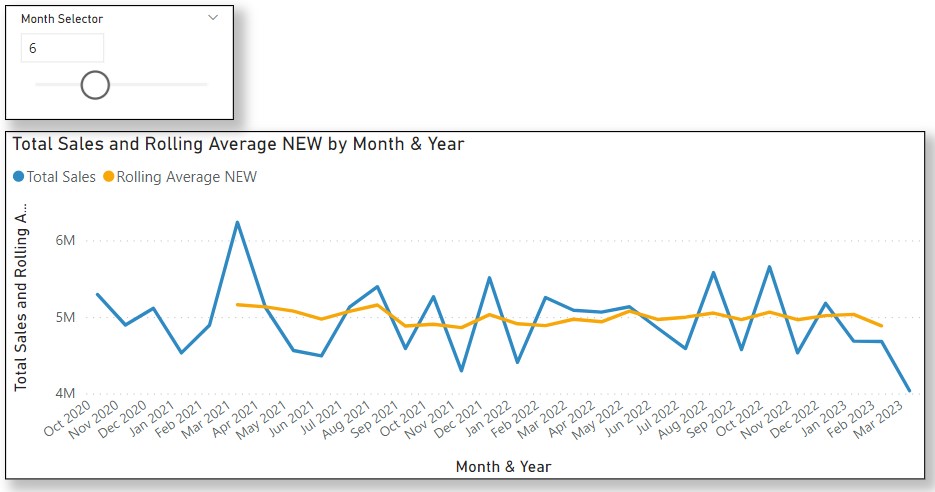
Rolling Average =
VAR rollingperiod = -'Number of months'[Number of months]
VAR rollingdates = DATESINPERIOD(Dates[Date], MAX(Dates[Date]), rollingperiod, MONTH)
RETURN
IF(ISBLANK([Total Sales]),
    BLANK(),
    CALCULATE(
        CALCULATE(AVERAGEX(VALUES(Dates[Month & Year]), [Total Sales]),
                ALLSELECTED()),
        rollingdates))
I’m a little behind on my workouts.
dwh-Workout 003_Posting.pbix (464.3 KB)
I’ve got two measures:
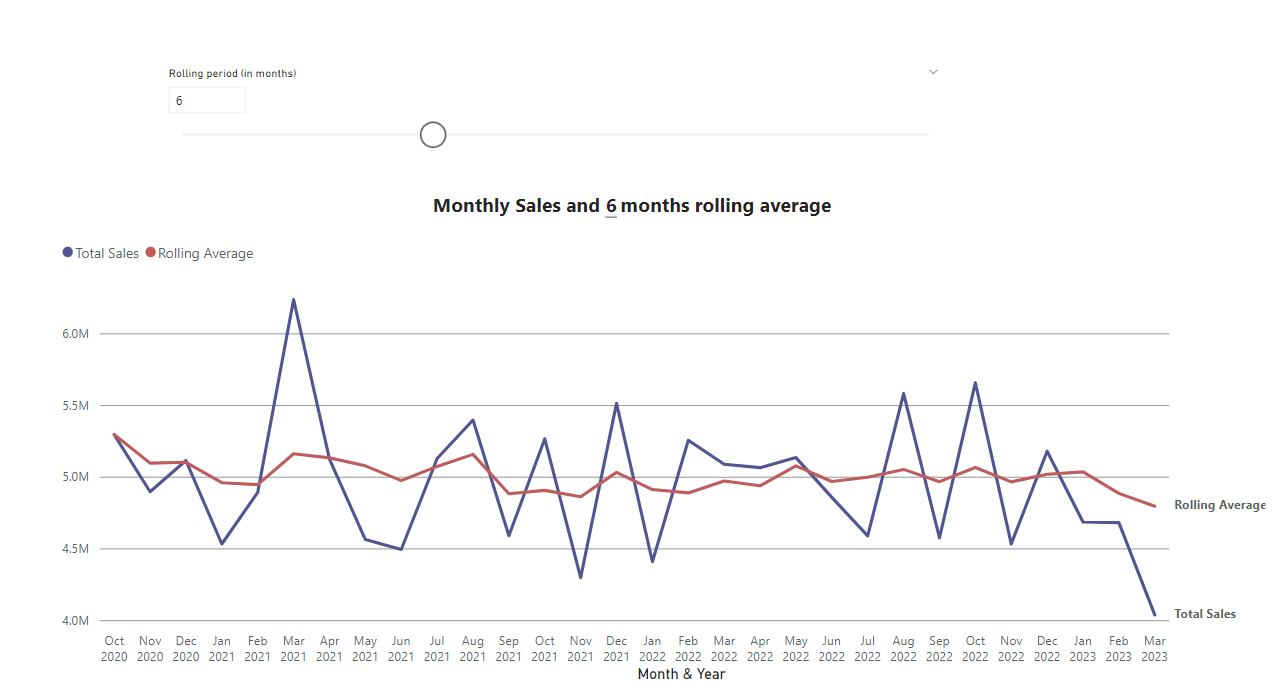
Rolling Average =
VAR __NumberOfMonths = SELECTEDVALUE(‘Rolling Average Period’[Rolling Average Period])
VAR __LastOrderDate =
MAX ( ‘Dates’[Date] )
VAR __TimePeriod =
DATESINPERIOD ( ‘Dates’[Date], __LastOrderDate, - __NumberOfMonths, MONTH )
VAR __Result =
CALCULATE (
AVERAGEX ( VALUES ( ‘Dates’[Month & Year] ), [Total Sales] ),
__TimePeriod
)
VAR __FirstDateInPeriod =
MINX ( __TimePeriod, ‘Dates’[Date] )
VAR __LastDateWithSales =
MAX ( ‘Sales’[OrderDate] )
RETURN
IF ( __FirstDateInPeriod <= __LastDateWithSales, __Result )
Chart Title =
VAR __NumberOfMonths = SELECTEDVALUE(‘Rolling Average Period’[Rolling Average Period])
VAR __Title = “Total Sales and " & __NumberOfMonths & " Month Rolling Average by Month & Year”
RETURN __Title