DAX measure - sum between two dates selected in the slicer

Hello
I attached pbix sample file with my case - this is not my source file, but refers to my main problem with measures.

How do you handle measures for tables that contain aggregate results. I am referring to the table template in the attached pbix file. At the moment, for each new data output - one access table that is created weekly, I am forced to make a copy of the measure in PBI with the changed date of the report.

I am thinking about measure like:
Total sum arrears on 2020-03-02, 
Total sum arrears on 2020-03-09,  
Arrears 11 Week = CALCULATE([Arrears];'Measure'[Data OB]= DATE(2020;03;09))

Total sum arrears  2020-03-16
Arrears 12 Week = CALCULATE([Arrears];'Measure'[Data OB]= DATE(2020;03;16))

Diff. week to week = [Arrears 11 Week] - [Arrears 12 Week]

In new week I have to create a new measure and change source of charts/visualisations after refreshing source data, despite the fact that main table does not change and only new rows are created for the new period - new week.
I need to to change source of measures on current week, last week,etc.

Added information about arrear/sales to fact table are not always the same - new parts appear, while others can be reduced. I would like to be able to take full advantage of the time intelligence functions and reduce the need to create the same measures for new report dates. I will be grateful for any suggestions.

I was thinking about a solution with the datebetween function and use of two slicers, only two measures(current week, last week) that will allow me to choose two periods that should be compared with each other and shown as a difference as change of arrears values week to week.Arrears.pbix (1.3 MB)

Thank you in advance,

Hi @Kamil,

Welcome to the forum.

Instead of hard coding dates, add a WeekOffset to your Dates table to make comparing last week to the week before fully dynamic and a breeze.

There are several posts on this subject to be found on the forum, so use the search option to find other relevant content. Here are a few to get you started.

I hope this is helpful

2 Likes

Thank you so much @Melissa
I intend to review all topics on forum.

Do you know any ways to use slicers in similar measures, because there is often a situation of comparing the current week to the period before 14 days, 21 or even several months.

Thank you in advance :slight_smile:

In that case it’s probably best to set up a What if Parameter for the WeekOffset number for the comparison period. You could show the Starting date of that chosen WeekOffset number in a card visual for example so your report consumers will have a better understanding of it’s place in time.

1 Like

@Melissa

I know I am asking you a lot but maybe you know some examples/topics on forum/pbix file using this method?

Ok for some reason you were misssing a Date table and I received errors when trying to add one so I copied your data to a new file and worked out an example for you.

First the Dates table is probably the most important dimension table in any model. Golden rule. If you have a date field anywhere in your model always add a Date dimension and mark it as a dates table!

I created a What if Parameter ( you can find that in the Modeling section on the ribon). Called it:
Comparison WeekOffset = GENERATESERIES(-52, -1, 1)

This creates a supporting table containing the numbers -52 thru -1 with an increment of 1.
And a measure:
Comparison WeekOffset Value = SELECTEDVALUE('Comparison WeekOffset'[Comparison WeekOffset], -2)

It is important to set a default value, as you can see above I’ve set that to -2. Nice thing to know is that you can have the What if Parameter automaticaly create a slicer on the report page, which I have done.

.
To illustrate I branched out of your [Arrears] measure. This will always calculate last weeks value.

Arrears LW = 
CALCULATE( [Arrears],
    FILTER( ALL(Dates),
        Dates[WeekOffset] = -1
    )
)

And this will calculate the selected comparison value.

Arrears Comparison Period = 
CALCULATE( [Arrears],
    FILTER( ALL(Dates),
        Dates[WeekOffset] = [Comparison WeekOffset Value]
    )
)

To give more meaning to the selected comparison period I’ve added a Card visual to display the start of the week date for that selection, like below.

Start of Week date comparison period = 
CALCULATE( VALUES( Dates[Start of Week date] ),
    FILTER( ALL( Dates ),
        Dates[WeekOffset] = [Comparison WeekOffset Value]
    )
)

Please note that all the calendar Offsets only work as long as the data in your report get’s refreshed.
I hope this is helpful.

eDNA - Arrears.pbix (158.1 KB)

1 Like

Hi @Kamil , we’ve noticed that no response has been received from you since the 26th of March. We just want to check if you still need further help with this post? In case there won’t be any activity on it in the next few days, we’ll be tagging this post as Solved. If you have a follow question or concern related to this topic, please remove the Solution tag first by clicking the three dots beside Reply and then untick the checkbox. Thanks!

@Melissa

Thank you very much for your help. The examples you sent me helped me come to a solution that is the most optimal for me today. I used two slicers because users have the opportunity to compare any two periods, not just the current vs lastweek, I will not use the parameter you mentioned.

However, I have another question because I am building my model right now.
I would like to do next step and receive value in my file regarding arrears&sales divided by using the dim BOM table. All details you can find in attached files.

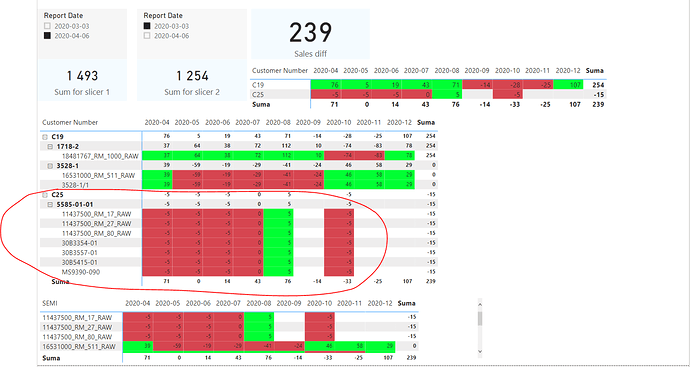
If the value of one product (in my model it is measure Sales diff) decreases by 5 piece (1 period vs 2 period) I would like to see that these 5 pieces of P/N generate a decline on: material #1, material #2 and OUT service that is needed to make it as part of BOM.

However, I can’t cope with the conversion of declines by using material consumption standard (table dimBOM, column Consumpion). For example we have PN1 and sales diff of 5 pieces in Aprlil but for there qty we should use 25 pcs of raw material as result of consumption standard 5 on material/bar. Right now I have in my model, in the value of the entire BOM on PN,SEMI,OUT RAW 5 pieces that come from the parent PN without taking into account the norms .

At the moment, it looks like the attached model - I added test excel sample and PBI file to the topic.
Could I count on your help and look at it?
I will be very grateful due to your PBI knowledgeBOM vs factSales.pbix (115.9 KB) BOM.xlsx (16.2 KB)

@Kamil, first please always create a new thread for each new question as stated in the forum guideline, here: How To Use The Enterprise DNA Support Forum.
.

I’m struggling to understand where the 25 pcs you mentioned are coming from because you have a Consumption of 0,5 for the RAW BAR material making 5 x 0,5 = 2,5 or am I missing something here?

Demand = 
VAR PN = SELECTEDVALUE( factSales[Part Numer] )
VAR SEMI = SELECTEDVALUE( dimBOM[SEMI] )
VAR Consumption2 = LOOKUPVALUE( dimBOM[Consumption], dimBOM[SEMI], SEMI ) // this is only possible with your bidirectional relationship, otherwise use VAR Consumption
VAR Consumption = 
    SELECTCOLUMNS( 
        FILTER( dimBOM,
            dimBOM[PN] = PN &&
            dimBOM[SEMI] = SEMI
        ), "__Consumption", dimBOM[Consumption]
    )
RETURN

IF( ISINSCOPE(dimBOM[SEMI]),
    [Sales diff] * Consumption2,
    [Sales diff]
)

.
Recommendations:

  • I’ve already emphasized the importance of a Date dimension table but it is still missing in your model(?)
  • If you don’t have a solid understanding of the bidirectional relationship - please don’t use it.

Hi @Kamil, you may also want to check this video where Sam talked about https://forum.enterprisedna.co/t/harvest-power-bi-slicer-selections-to-use-with-other-measures-advanced-dax/479. You might get additional tips here.