Please help? I really struggle to create DAX to accomplish the following:
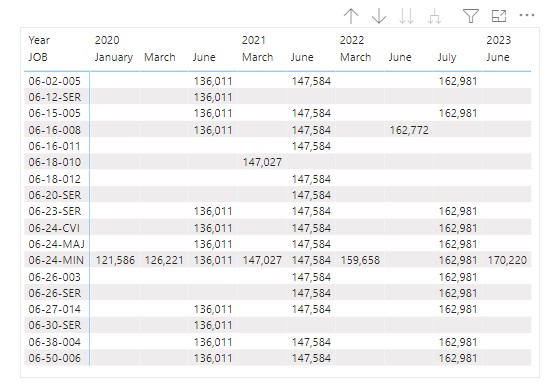
For each vehicle many jobs are performed at various mileage intervals. Each time a job is performed, the mileage (Meter KM) is captured. Below in the table you can see the mileage when different jobs in the JOB column were performed at various dates for one selected vehicle. (There are of course many more vehicles.)
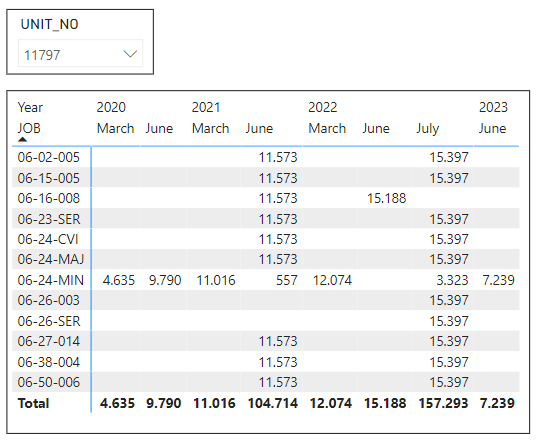
Question: I don’t want to display the actual mileage when each job was performed as you can see in the below table, but rather the difference between each value (km) and its previous value (km) for each job. This is to see clearly the interval in which the jobs were performed. This means e.g. for the first Job 06-02-005, 2021 June should not display147,584, but rather (147,584-136,011)= 11,573, and 2022 July should not display the 162,981, but rather (162,981-147,584=) 15,397.
**
All the data is captured in the same WO WITH JOB DETAIL table. Here is sample data from this table.
The data captured in Power BI is here.
Not sure if I should add a Date/Calendar table. Added Melissa’s extended date table in this Power Bi version.
You will note the interval between the various jobs differs. Some happen every two weeks, others once a year, and everything in between.
One would typically filter on a specific vehicle to monitor service intervals for its many jobs.
Thank you so very much for trying to help. I really do appreciate it!
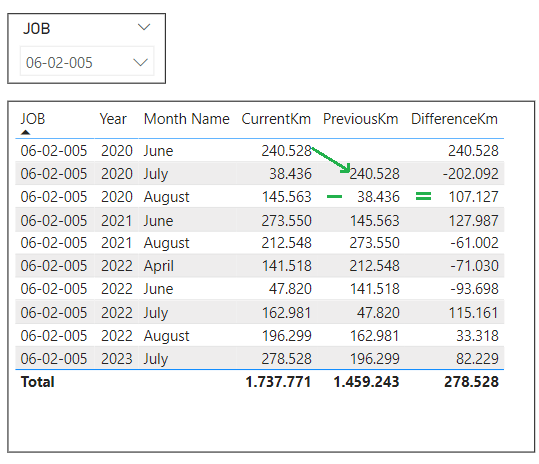
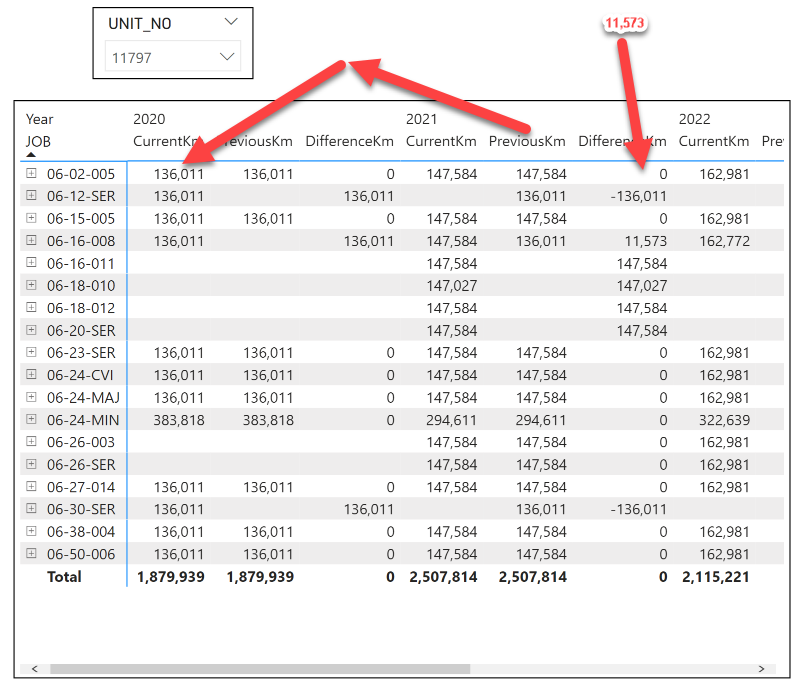
Unfortunately this is not working as I envisaged. If I swop the fields to the desired layout (see below screenshot), the measure does not work. Note how I need to filter on a specific vehicle. If filtered by a vehicle (number), it does not pick up the previous KM meter reading for the correct calculation. This does not work when showing just annual values, even less so when adding the desired month-level.
Will greatly appreciate it if you could please provide the pbix file.
Would it be possible to provide the measure in such a way that it only displays a value where there are two values to calculate the difference from, meaning:
if the “Prev km” value is blank, the “Diff in km” shows blank and thus no misleading high positive value
if the “total kilometers” value is blank, the “Diff in km” shows blank and thus no misleading high negative value?
Also, will the measure still stand up to the test should I drill down to month level where we have jobs that are performed every say two months?
I am still new to Power BI and do find DAX logic quite challenging (at present - let’s be positive!). You help is very encouraging.
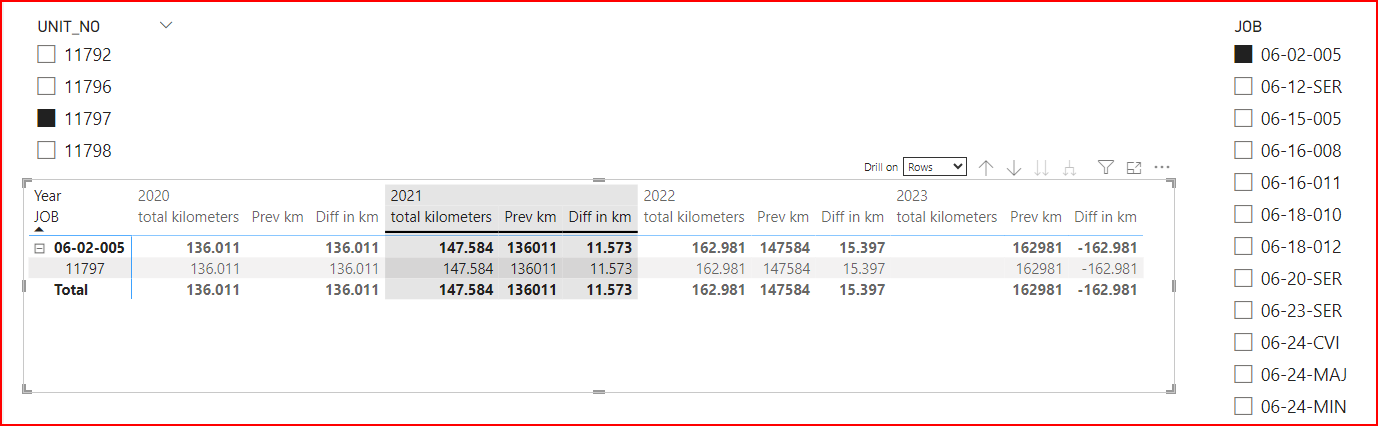
Thank you very much for helping again. I am very excited about your solution! Still testing it, but have one follow-up question if I may (see below).
Fist just want to say sorry for the slow reply. I am still learning and had to spend time to better understand the date table. Could not get your solution to work in the real dataset as I had incompatible date formats. Also, did not know about the “Sort by column” option. Now that I understand, all looks a lot better!
My question: admittedly most jobs occur more than a month apart, so your DAX based on months works fine. However, there are some bi-weekly jobs happening every two weeks. Currently the DAX cannot display these. How would I adjust your DAX to still be valid if I should drill down to week-level?
Unfortunately, I haven’t included any examples in my original dataset. Will it help if I create a new dataset with such examples, or would you be able to offer a solution without such a dataset?