Hi All,
Can you assist me with doing the DAX version of the below partial SQL Query
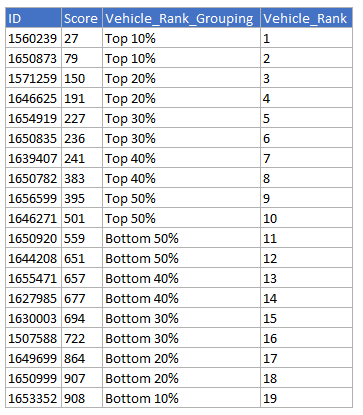
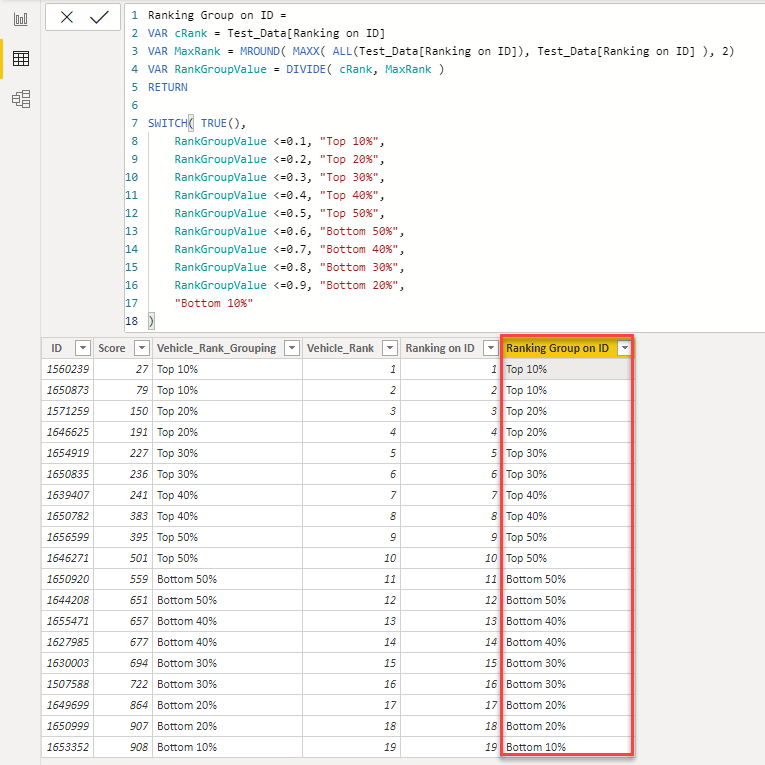
case ntile(10) over( order by Score asc)
when 1 then ‘Top 10%’
when 2 then ‘Top 20%’
when 3 then ‘Top 30%’
when 4 then ‘Top 40%’
when 5 then ‘Top 50%’
when 6 then ‘Bottom 50%’
when 7 then ‘Bottom 40%’
when 8 then ‘Bottom 30%’
when 9 then ‘Bottom 20%’
when 10 then ‘Bottom 10%’
else ‘Check’
end as ‘Vehicle_Score_Grouping’,
If any info is needed please let me know
I have looked at https://docs.microsoft.com/en-us/dax/percentilex-exc-function-dax
I do not understanding this Dax Function
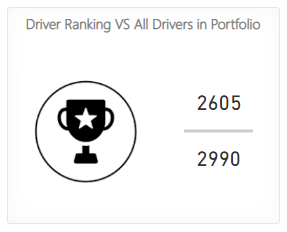
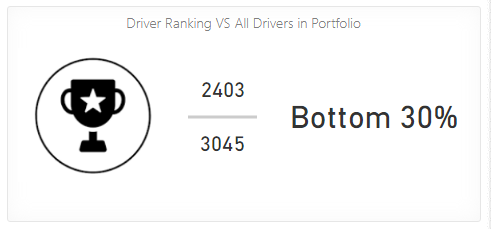
I am building a Dashboard using vehicle telemetry data and based off the counts of harsh braking , acceleration, Cornering, Impacts alerts etc I have come to a score (This Scoring calculation could be another topic I would like to dive into and discuss with the people of ENDA).
I would like to group the scoring of each vehicle as in the SQL query above for the Vehicle Summary page. Its the only thing im missing to complete this Dashboard.
I can do this in SQL as intended but need to keep this in Power BI as all my calculations are there.