Data Visualization Workout 013 - Grouping: Top / bottom & others

Workout 013 – Grouping: Top / bottom & others (Matrix table)
Difficulty rating: 4 out of 5

Intro note
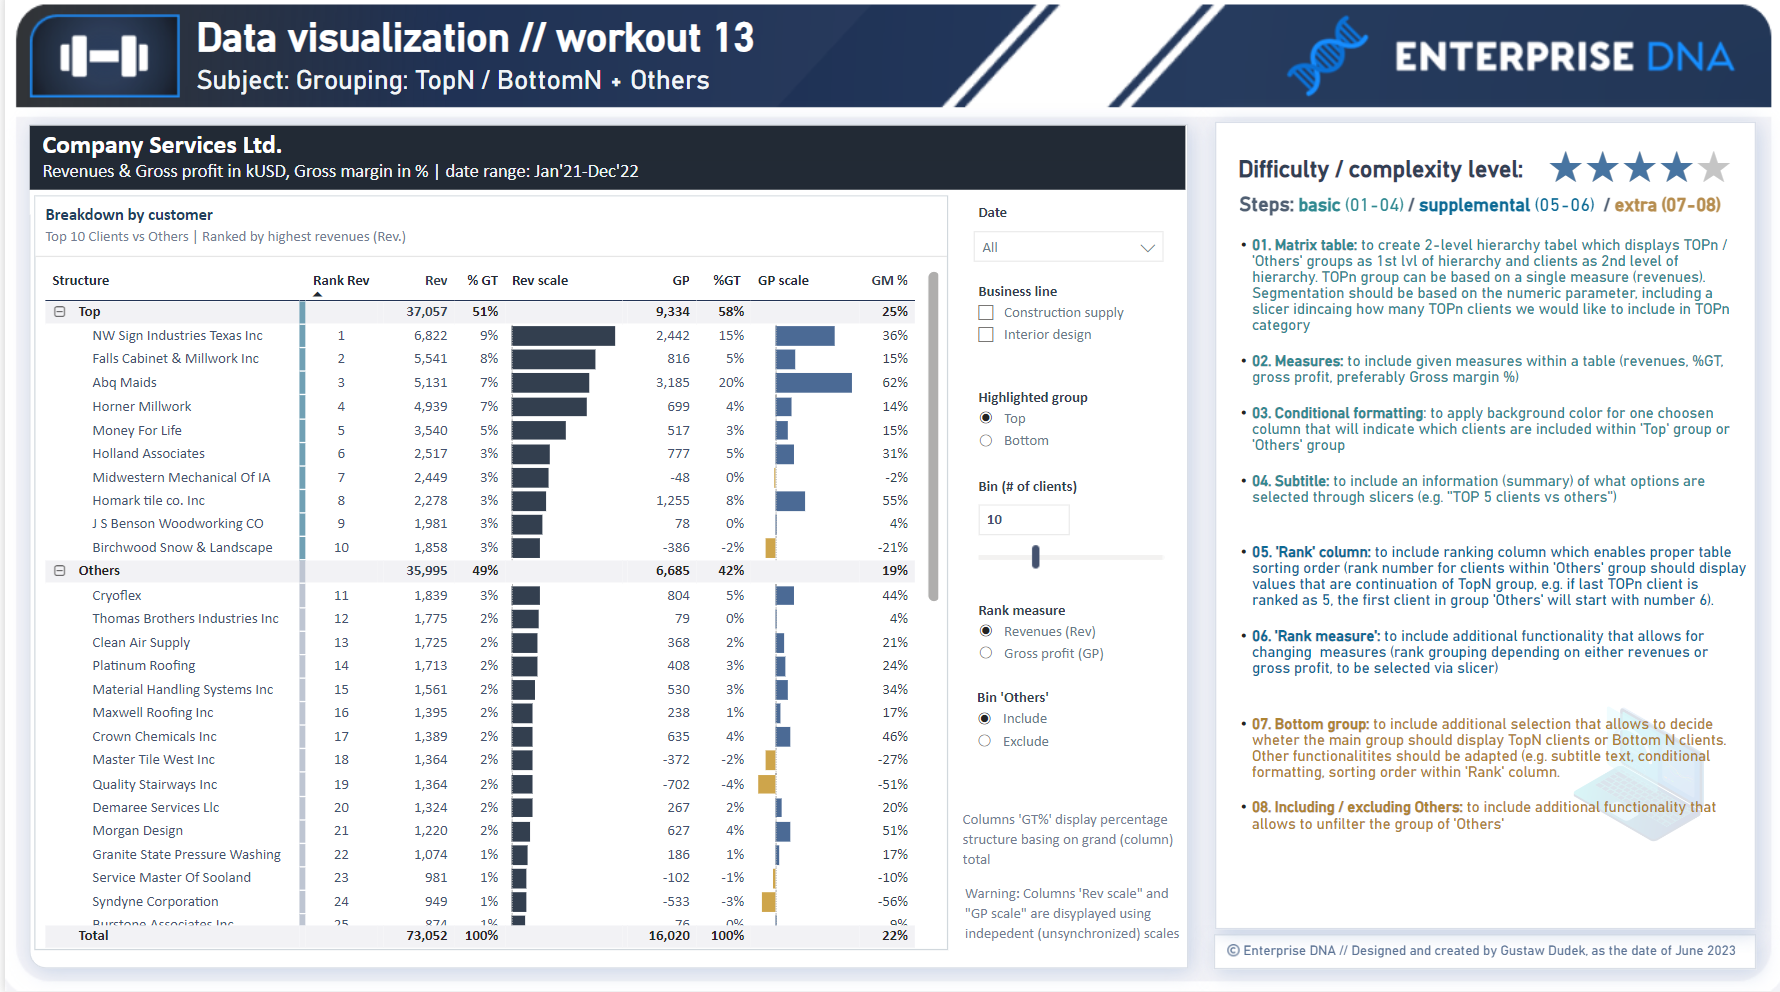
This workout combines various visualization techniques. The most important part of the workout is practice - entries does not have to include every element or functionality to be still considered as great . Please pay attention to the list of functionalities (provided in the screenshoot and in published-to-web report), which includes ‘basic’ elements (1st -4 th point), supplemental (5th - 6th point) and extra (7th - 8th points). I would kindly recommend to review blue section before executing orange section to provide proper flow of your work.

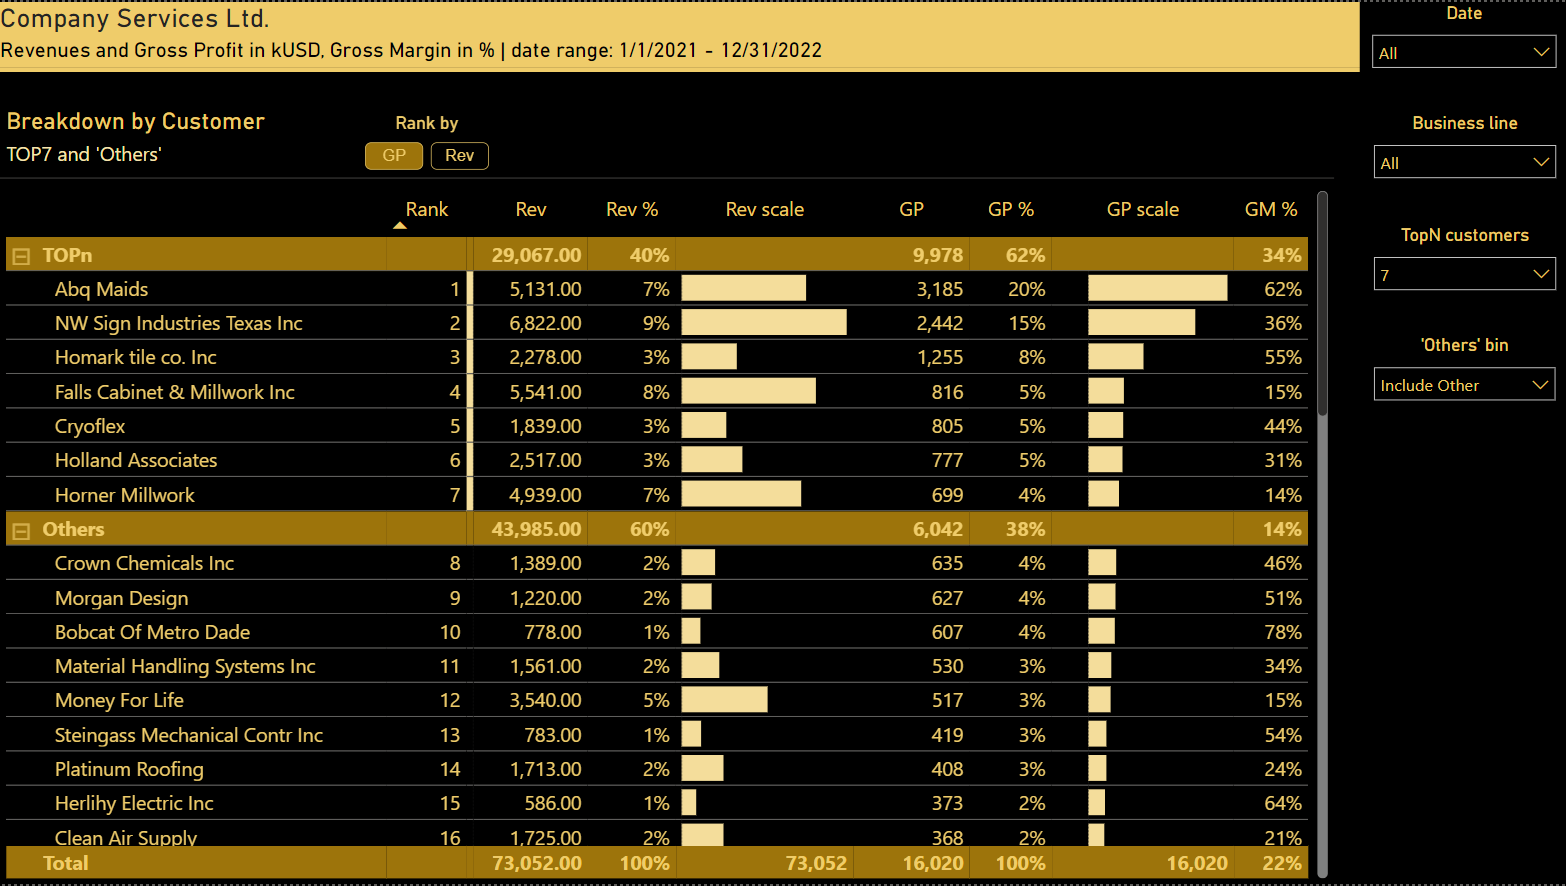
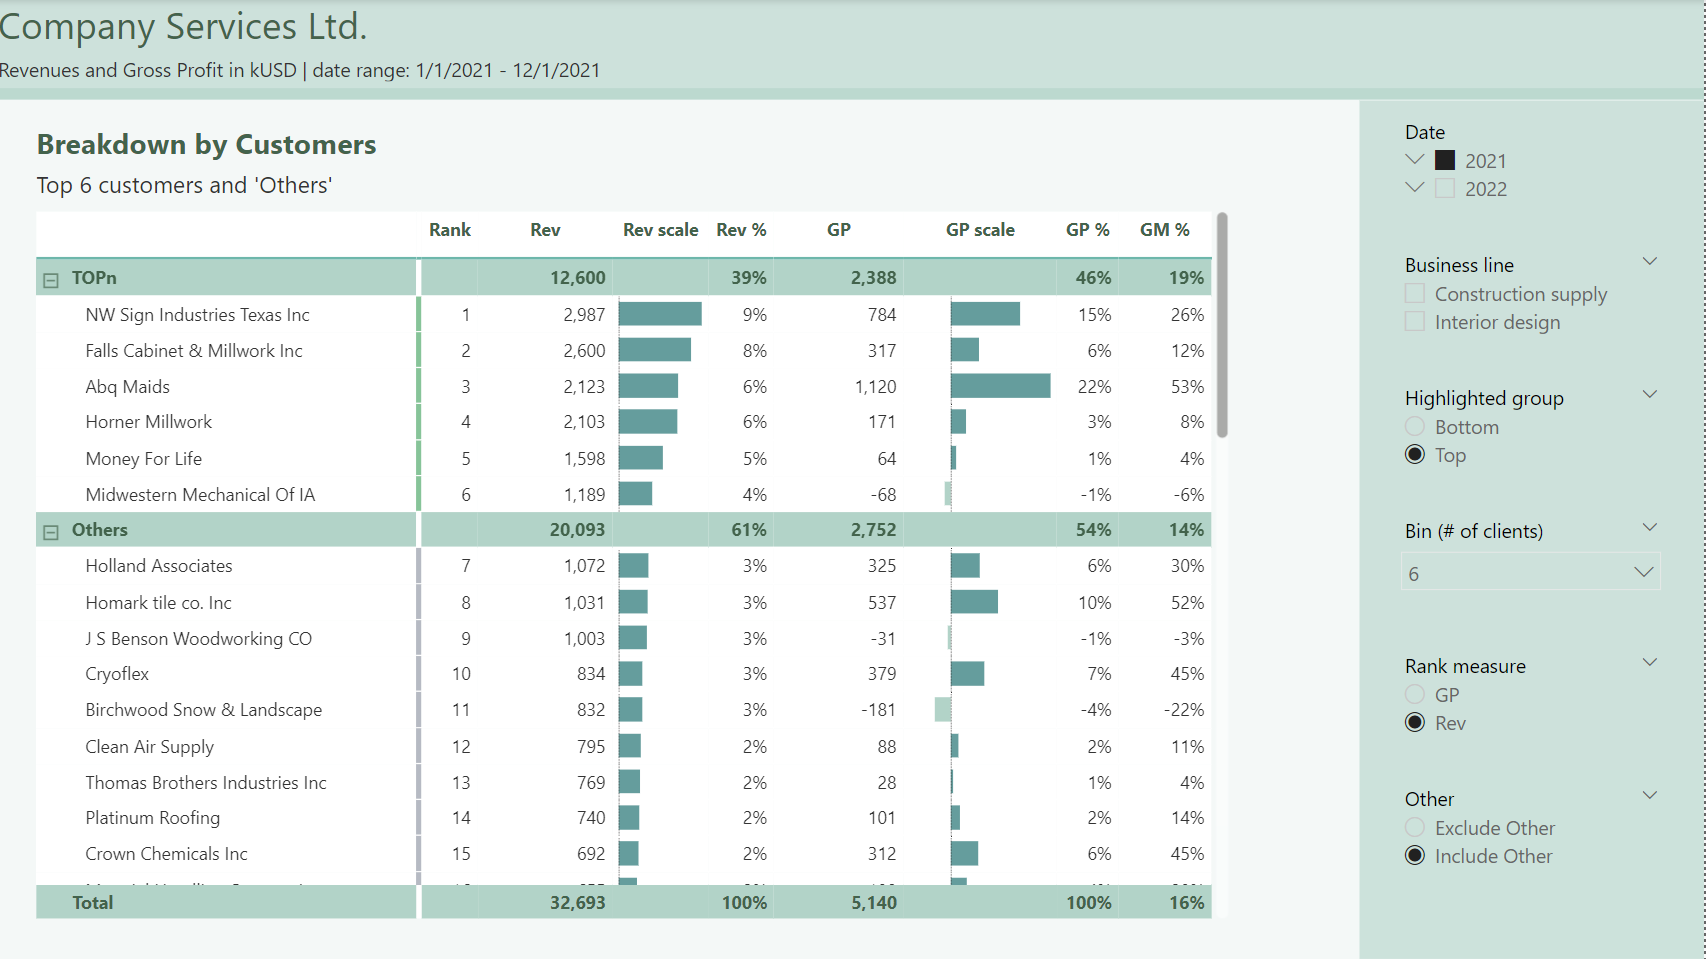
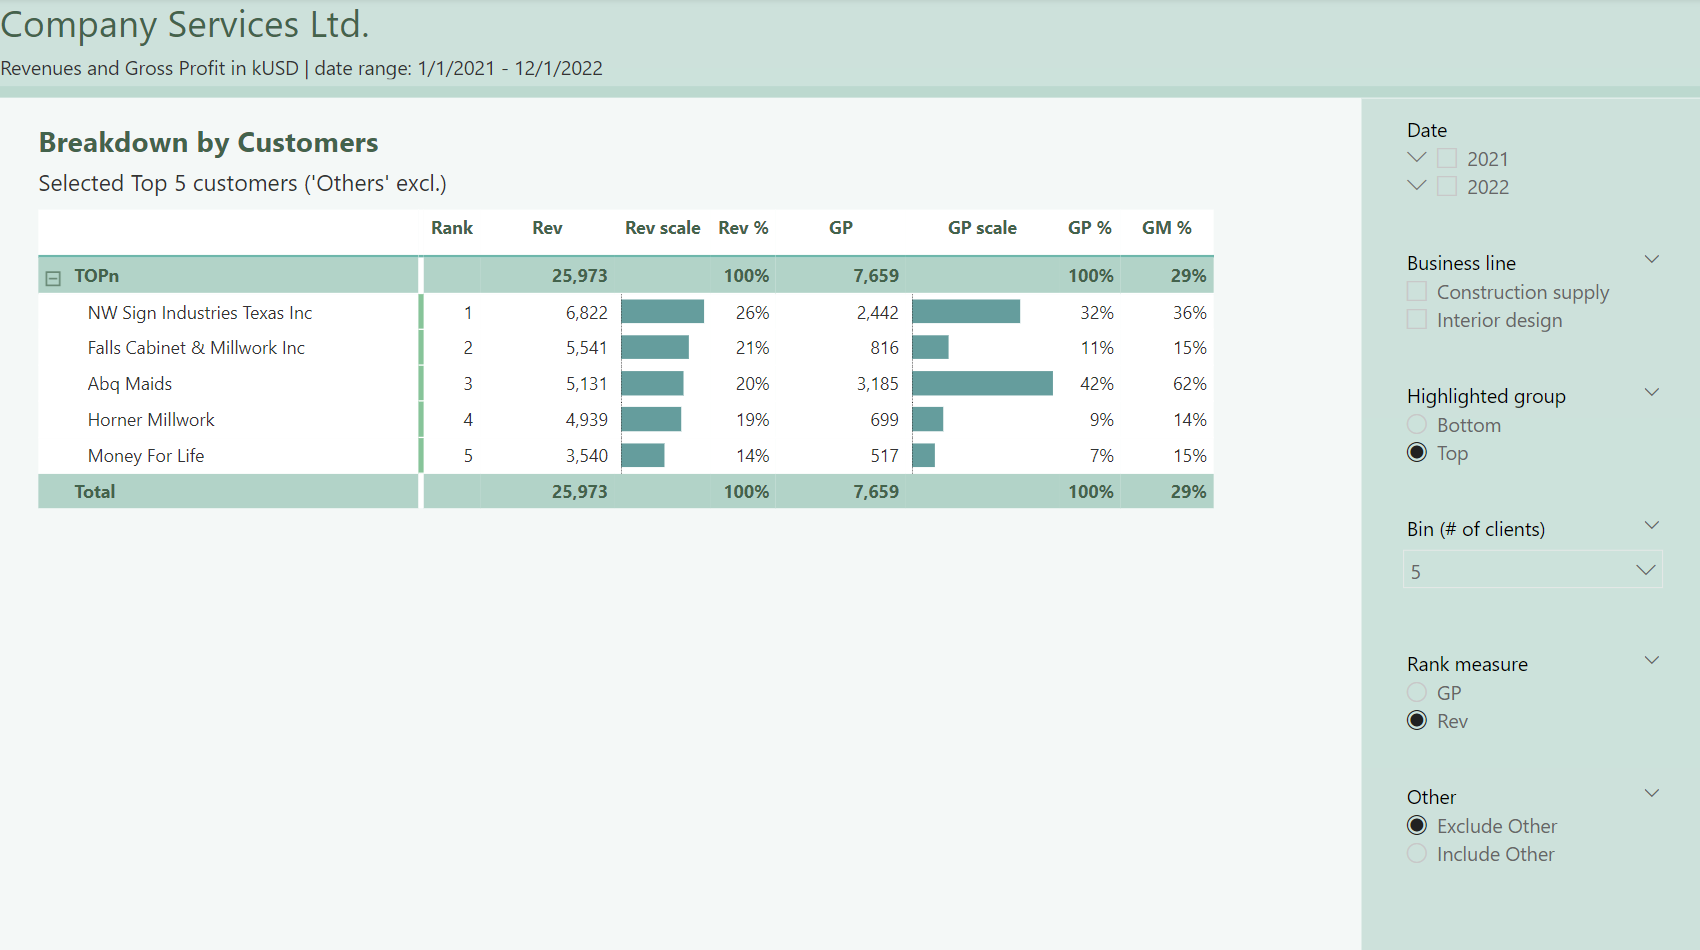
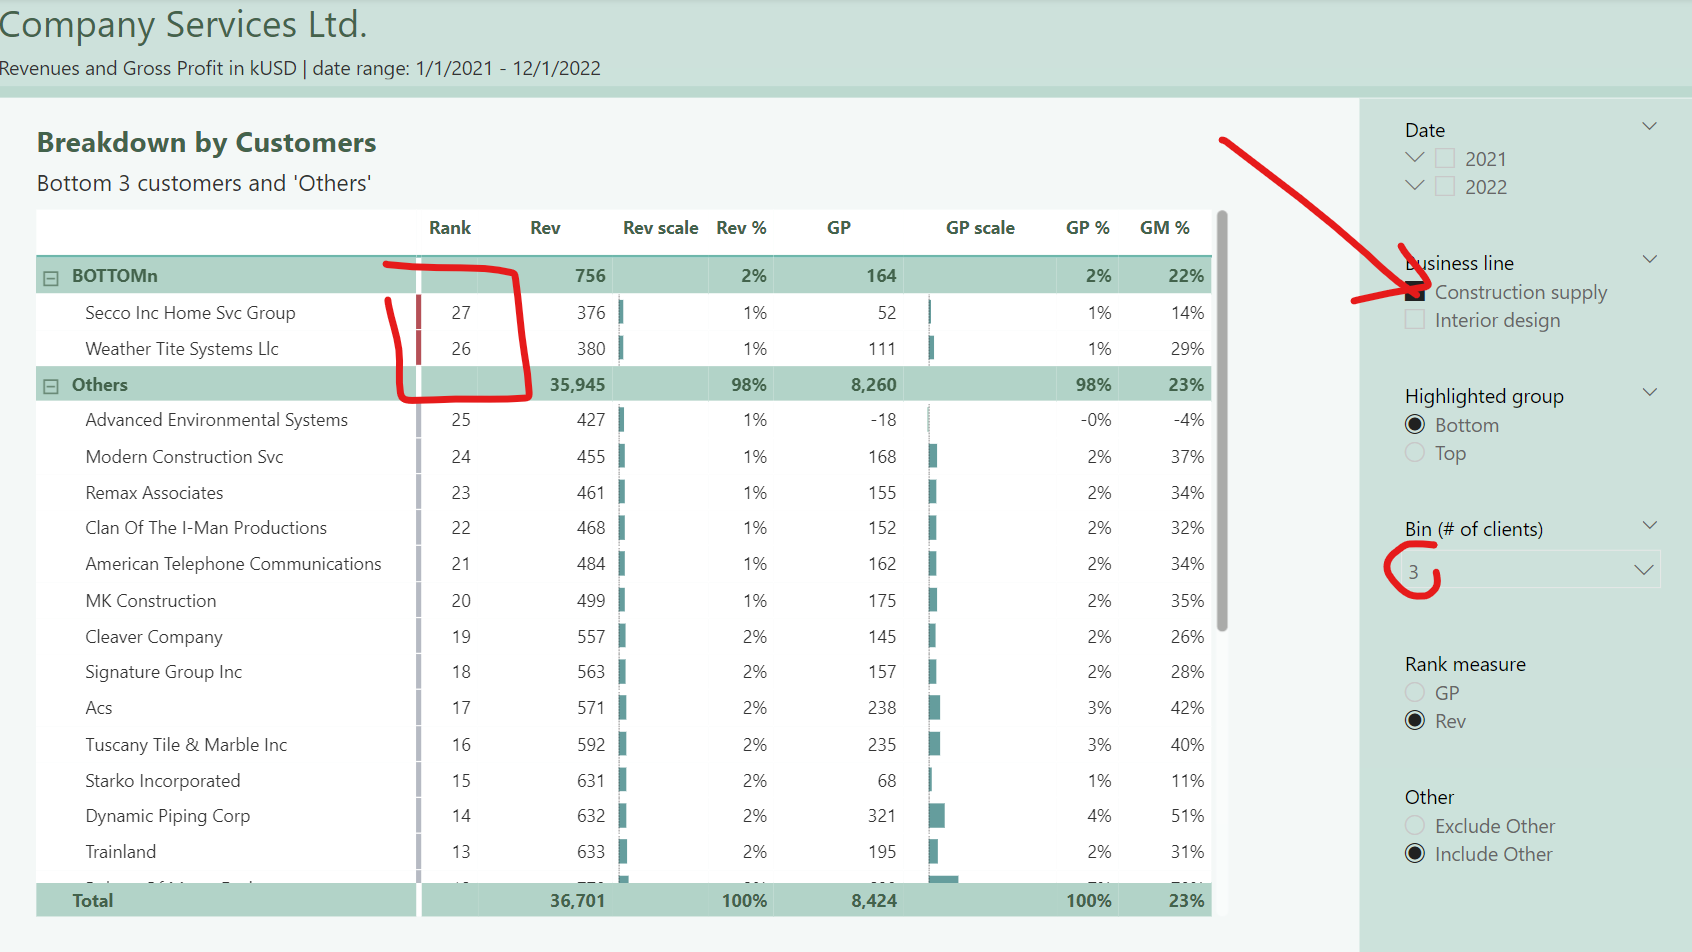
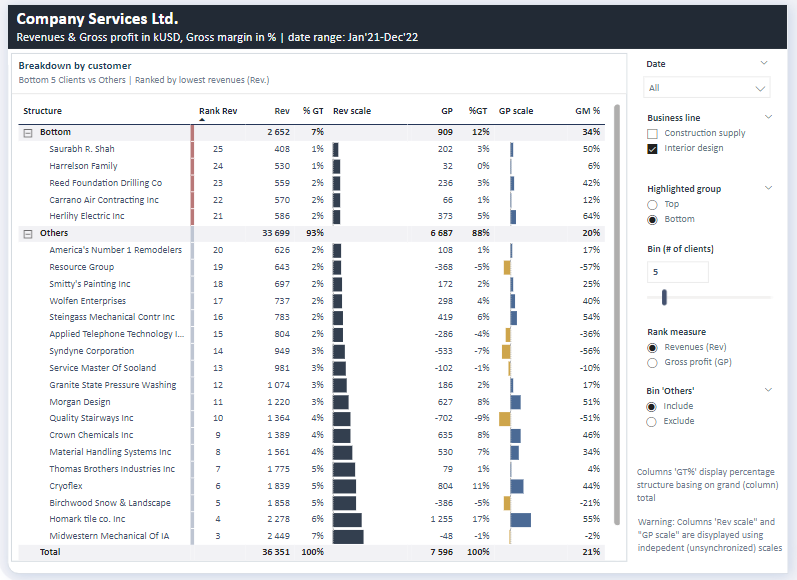
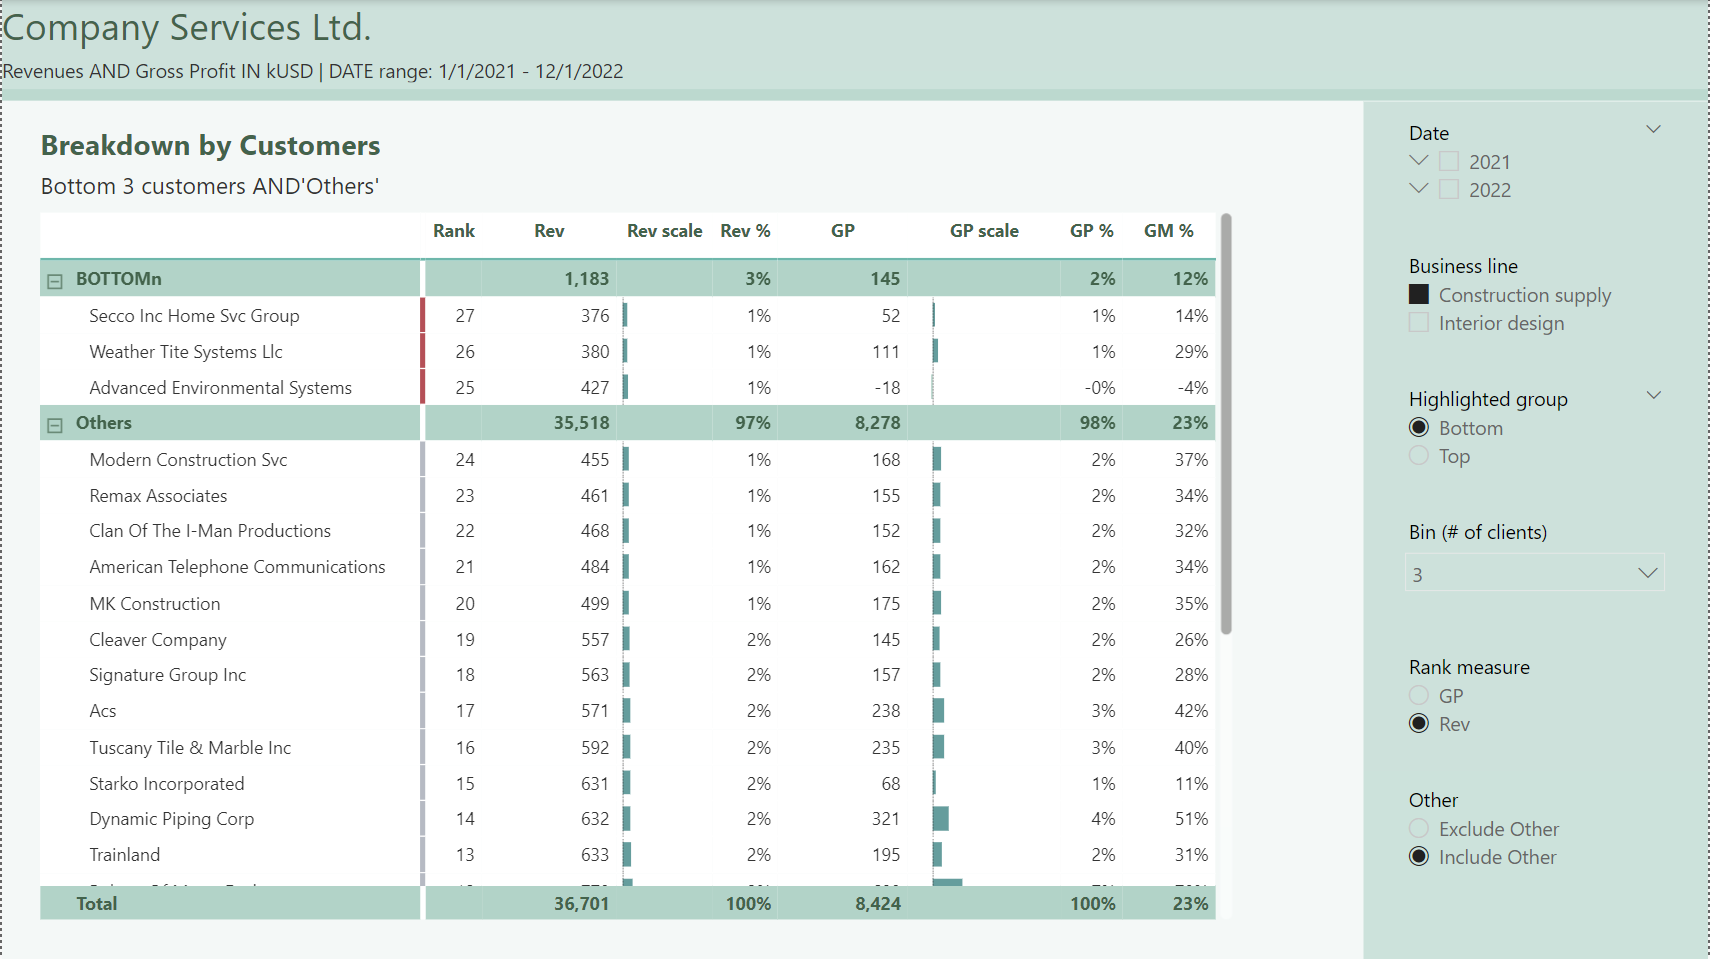
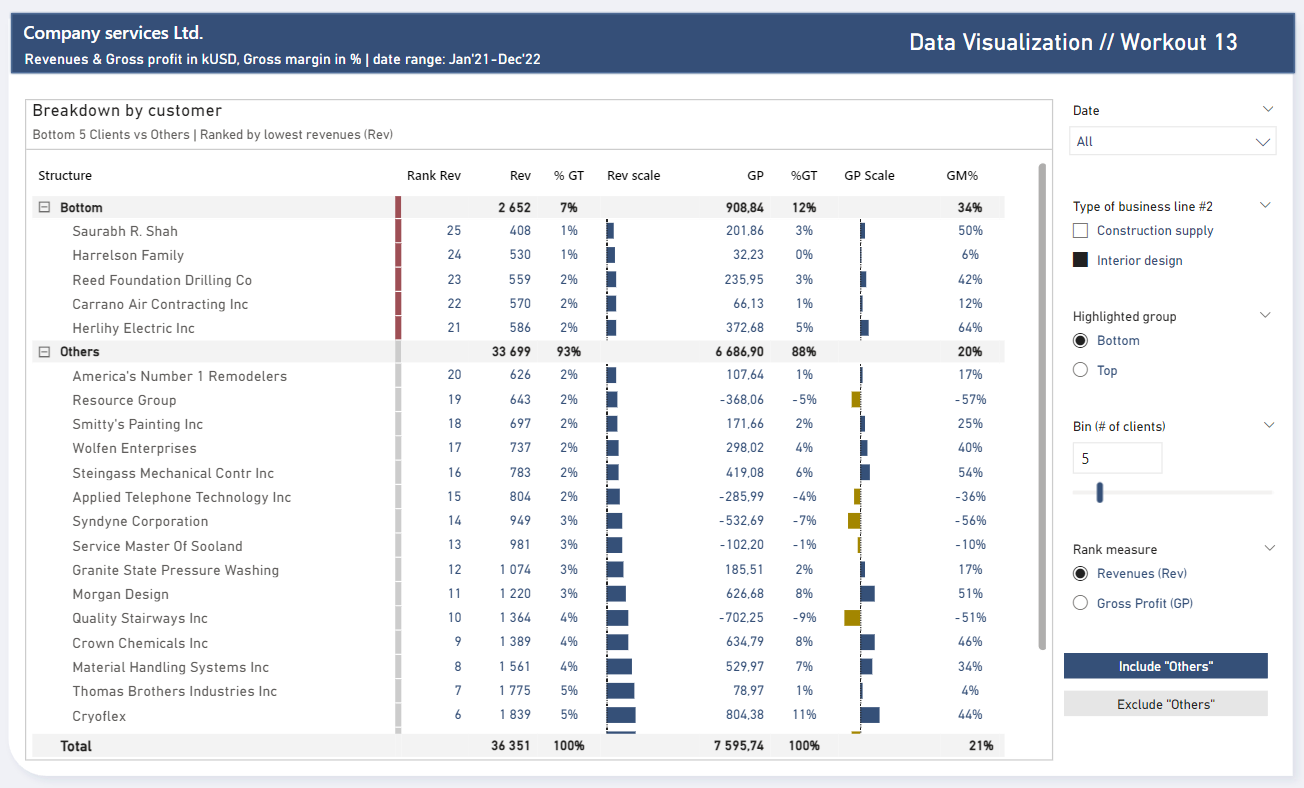
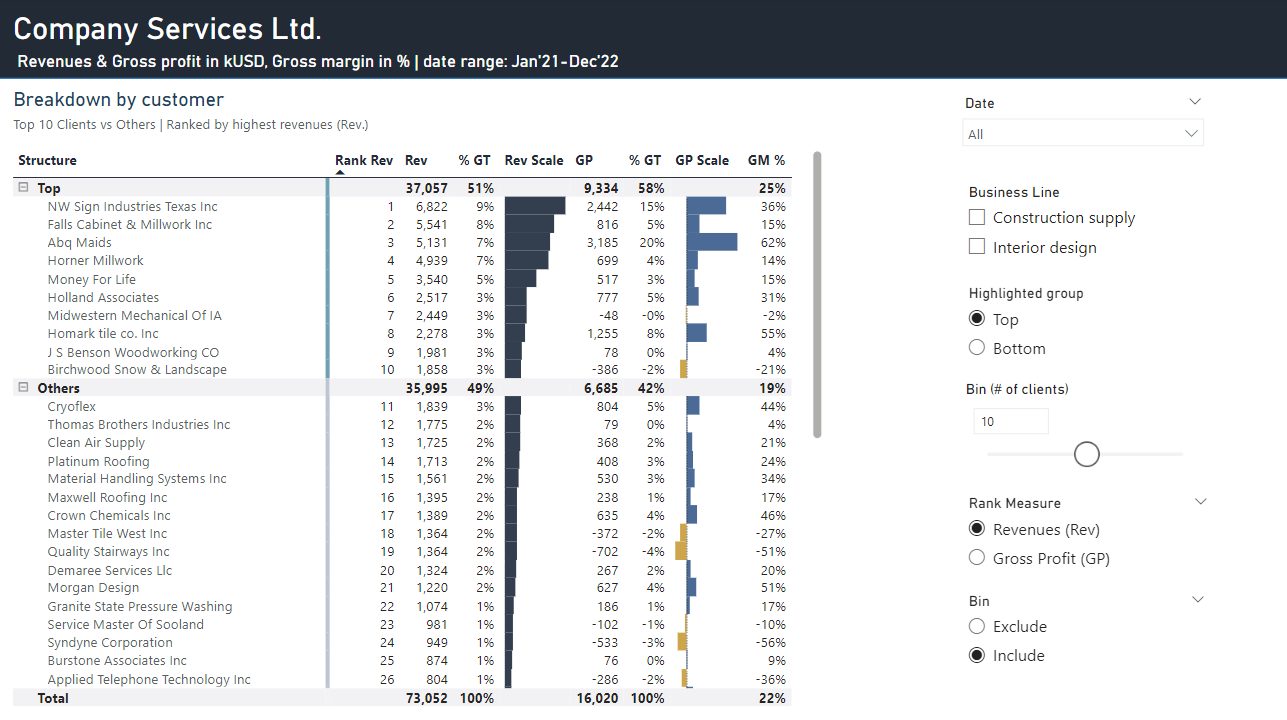
A good starting point is to implement fundamental points by creating the matrix table with 2 levels of hierarchy, where 1st level displays group (top vs others) and 2nd level displays given clients in adequte group (ranking group can be based on a single metric, e.g. revenues and can by dynamically selected through a single numeric parameter). Basic Matrix table can display only TOP vs others, without additional functionality to display Bottom clients. Realizing further points (blue and orange) will provide additional technical practice.

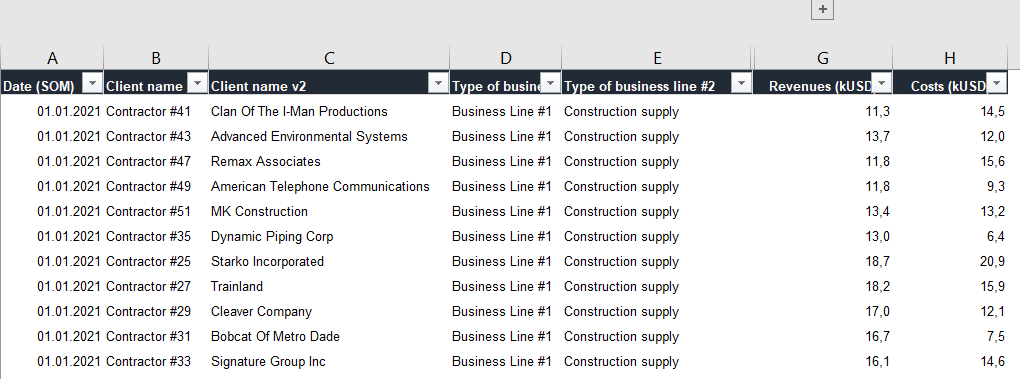
Following workout bases on the dataset that was provided during the workouts 002, 005, 006, 007, 012 - . If you have participated in abovementioned workouts - you can still use your already imported and fransformed database. Not all columns provided in the dataset have to be used in that particular workout but feel free to use other additional columns, /c ategories if you’ll find it useful.
Moreover, it you will find it useful, you might also add supplemental tables if needed (e.g. disconnected table that seve specific purpose in analysis)

**Also, feel free to use your entries as a part of your project portfolio, if it’s instrumental in realizing your goals.

Goals

In this workout, using the supplied dataset and reviewing the provided interactive report (link below) we are going to replicate the set of visualizations (Matrix table and set of slicers). Also, please feel free to add any extra visual if you would like to (provided that core visualizations are included in the first place).

013 - Workout - Top, bottom vs others - matrix table.xlsx (110.9 KB)

Core actions (practice) :

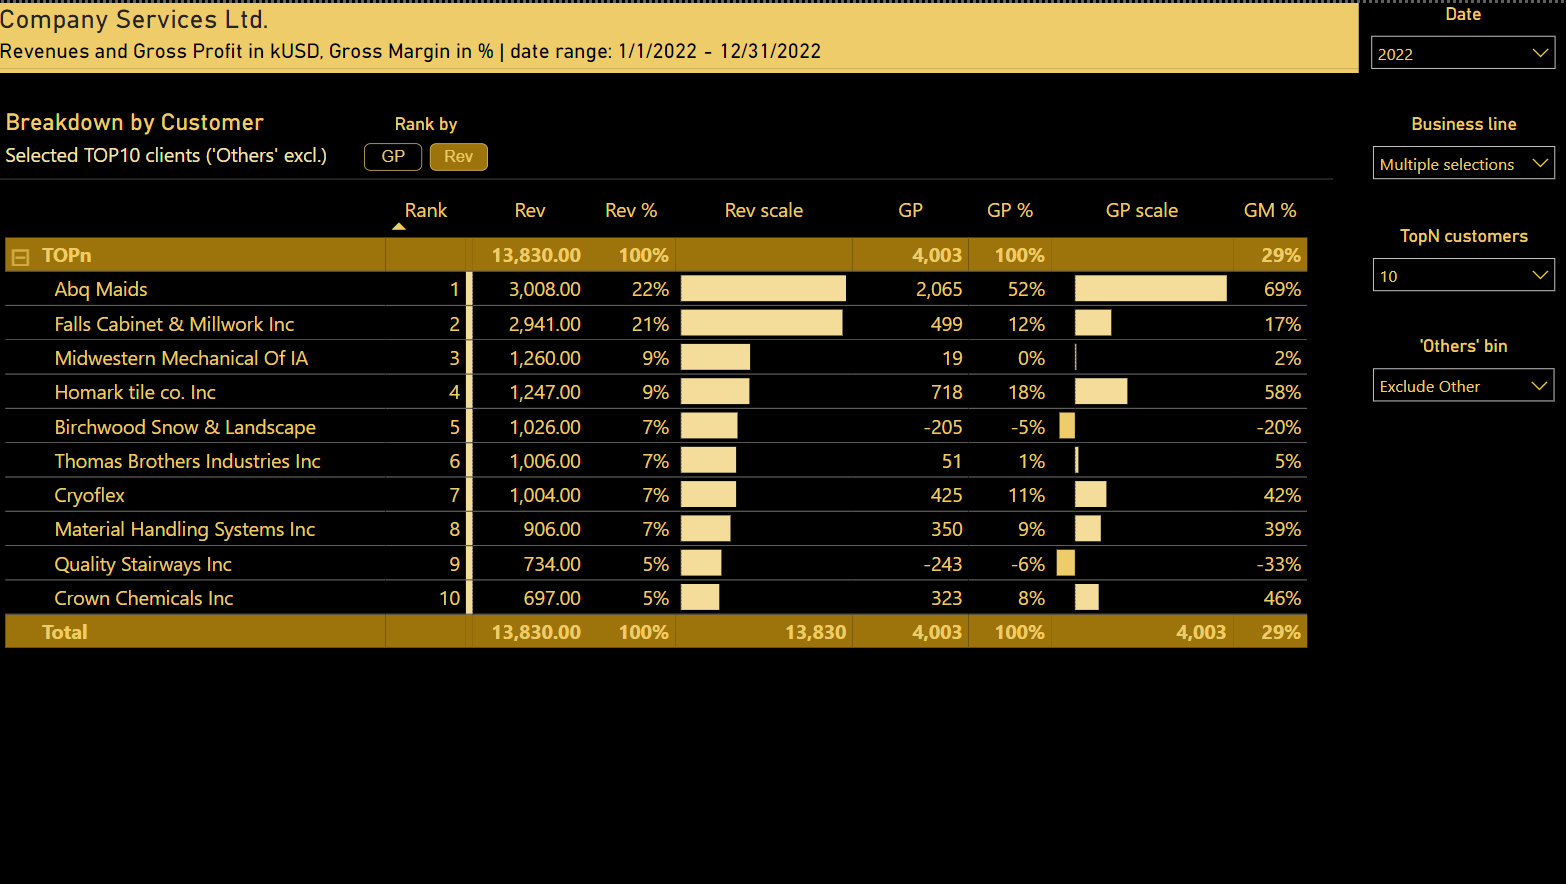
    • Creating dynamic TopN selector through numeric parameter
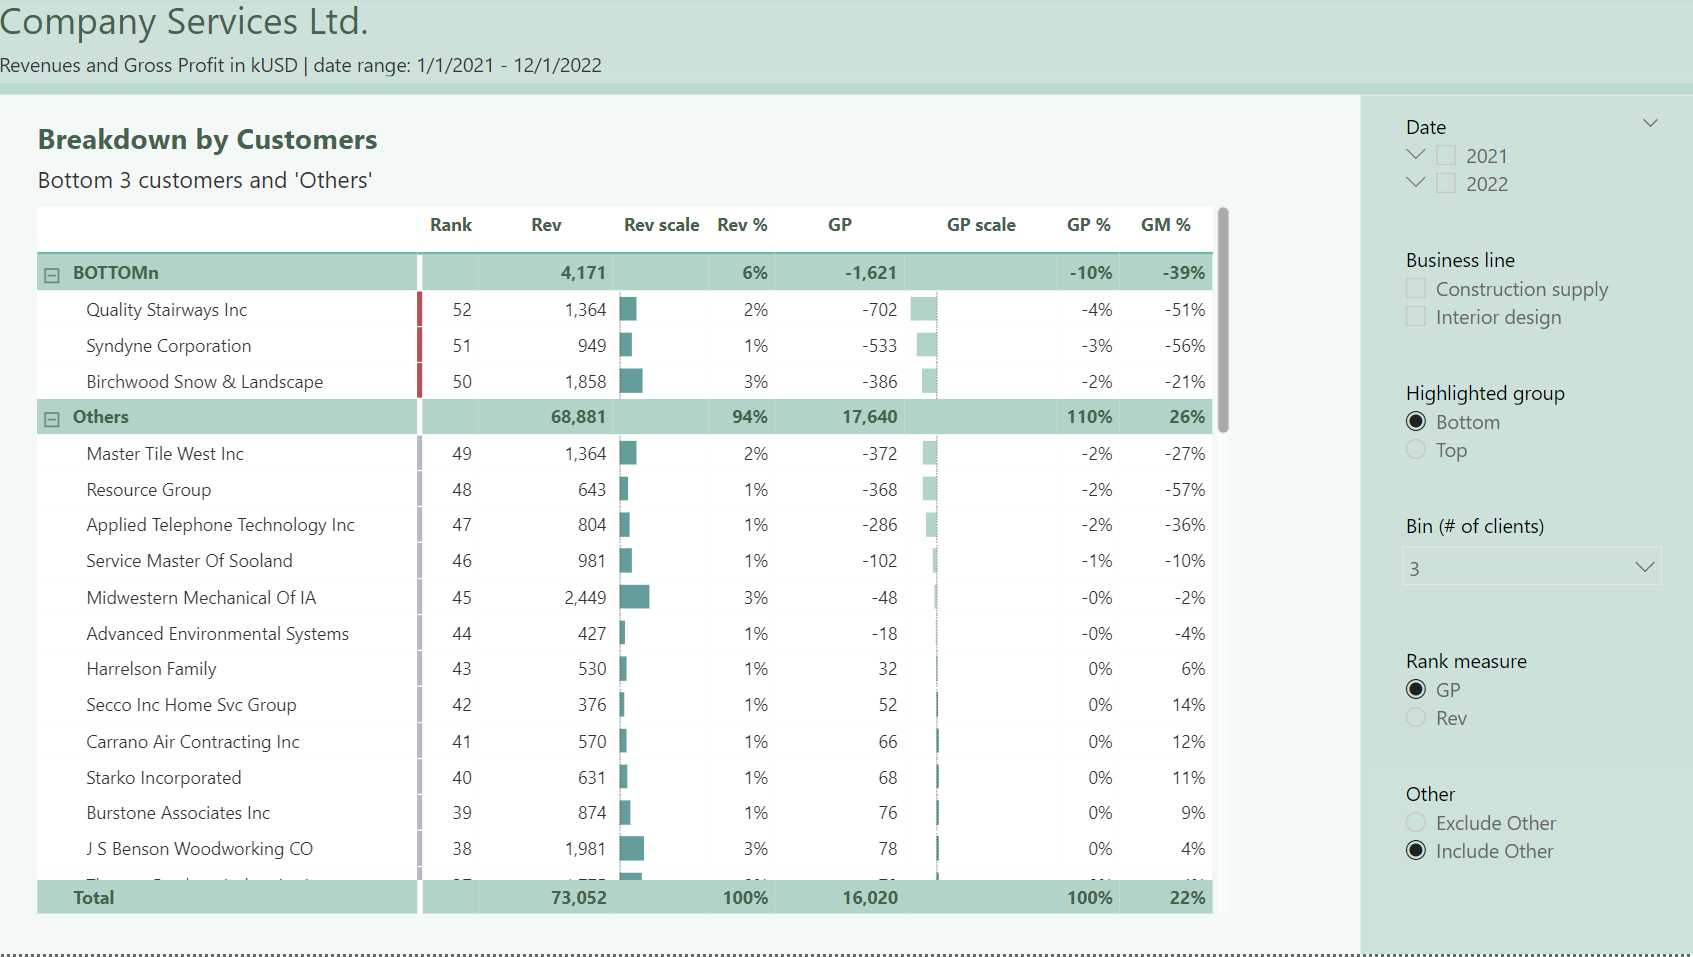
    • Introducing binning / grouping method: Top/bottom vs others within matrix table
    • Using subtitle section to provide additional relevant information
    • Using various dax formulas to provide certain effects (rankx and others)

Submission

Please load the supplied data (xls file) into a Power BI file, replicate visualizations (considerating list of points in the introductory report screenshot and the general design and functionality provided through interactive published-to-web report), and reply to this post including the screenshot (or a gif) of your solution along with the pbix file (please, include name or EDNA forum nick in the pbix name).

Period

This workout is released on Tuesday June 19, 2023, and the author’s solution will be posted on /Tuesday - Wednesday 27-28 June, 2023.

Additional materials

Link to the interactive dashboard:

Additionally, I also attach a link to @SamMcKay blog post / video, that can be valuable on certain stages during the practice.
https://blog.enterprisedna.co/group-customers-dynamically-by-their-ranking-wdax-in-power-bi/

Following solution can possibly be achieved through various approached and techniques, so please feel free to use any methods that you will find instrumental in the workout.

Have a great fun!

Best regards!

1 Like

The best

1 Like

Hello,
Thank you Gustaw for this workout, I find it extremely useful. I am uploading my solution. I was surprised that the only task I completely failed to solve so far is creating a hierarchy, as I thought it would be a simple thing :slight_smile: I guess creating a measure for this purpose was not a good idea. I hope to have time to look at it again this weekend, this time I’ll try with creating a separate table. This would probably also make it easier to create the slicer " bin ‘Others’ " , since my solution is based on bookmarks. I also had a problem with setting the desired sorting for the Rank parameter, the only workaround I could come up with was to add a hidden column for sorting :slight_smile: I’m very interested to see other solutions.
AS_Workout13

Aleksandra_Workout13.pbix (338.6 KB)

4 Likes

@Aleksandra, Very elegant table. It’s really awesome to see how you approached different functionalities (for example hidden sorting column or bookmark to include/exclude others). And you made it super fast :smiley:
Great work! Thank you for participation

2 Likes

Awesome Work Alex

1 Like

The result of my :drop_of_blood: :sweat_drops: and :face_holding_back_tears:
I tried but couldn’t get the top/bottom switch to work so elegantly omitted it from my submission. May give it another try later (hints much appreciated)

3 Likes

Hi Noemi, could you please share the pbix file so I can see how you approached creating the Top/Others hierarchy?

1 Like

I’ll do you one better and explain. BTW, I followed the clue in the description. :female_detective:

Summary

First of alI check out the recommended blog post. It seems straightforward, however, it depicts a static scenario but we need something more dynamic. I improved the bin grouping in the blog to reflect all of my scenarios. My TOPn range is 1-10, so I created the following table. The first column is the scenario ID which corresponds to the TOPn value selected by the user. (If your TOPn range is more than 10, then you need to add more scenarios.) 1000 is just an unrealistically high number in this dataset so will work fine for a long time even when new customers get added…

Selected value Bin Min Max
1 TOPn 1 1
1 Others 2 1000
2 TOPn 1 2
2 Others 3 1000
3 TOPn 1 3
3 Others 4 1000
4 TOPn 1 4
4 Others 5 1000
5 TOPn 1 5
5 Others 6 1000
6 TOPn 1 6
6 Others 7 1000
7 TOPn 1 7
7 Others 8 1000
8 TOPn 1 8
8 Others 9 1000
9 TOPn 1 9
9 Others 10 1000
10 TOPn 1 10
10 Others 11 1000

Then I used a similar countrows pattern from the blog but revised it to first filter this scenario table based on the TOPn selected value. So, if the user selected top 5, then only the two rows starting with 5 would be used for evaluating the measure. Finally, I created a dummy table:

Bin ID
TOPn 1
Others 2

Then I placed the bin column above my clients column in the matrix row section to create the fake hierarchy. The second column value ensures that the TOPn is on top.

What I do not like in this is that it is still “static”, i.e. the scenarios are hardcoded but I could not achieve this with virtual tables. If anyone figures out how to, let me know.

Also, no idea how to do the bottom “switch” with this so this might not be the way to go… :woman_shrugging:

2 Likes

Hi @Noemi
Wonderful explanation!

I’ve used quite similar technique with additional static table and binning method.
I believe that we might be able to create fully dynamic table basing on “generateseries” but It would need further tests.

Regarding the bottom bin → you can create exactly the same table as you have for TOP/others, but instead of TOP, you can use phrase Bottom. Both tables (your TOP) and additonal duplicated table for Bottom can be additionaly categorized by extra column with ID (e.g. section related with TOP would get ‘1’ and section related with Bottom woul get 1). Then the merged table will be sliced through slicer selection (either TOP or bottom). Rest is the case of adequate ranking if selection is either TOP or bottom

Yeah, I started thinking along these lines, got to the bottom scenario table with all the measures, etc. and when it came to visualizing, my first thought was I will need two tables with bookmarks for the user to switch between them, a merged table never occurred to me but what you write makes sense so I’ll give it a try. Thanks! Will report back soon…

1 Like

Thank you for your explanation @Noemi, I really appreciate it.
I saw the blog post, but had no idea how to apply it because of the dynamic TopN, since min and max is not static. I tried the approach of SqlBI (link), but I couldn’t make it work when the “Others” group should also be expanded.

I will try your way in that case - thanks again! :slight_smile:

2 Likes

Lesson of the day - always start fresh. I wasted so much time trying to make sense of the massive tangle of tables and measures related to the previous workouts with the same dataset (and I am pretty organized…) :see_no_evil:
After following @Gustaw’s lead took me down a rabbit hole I decided to start with a clean canvas. I tried NOT to use any of the measures I had already created because I no longer trusted them :radioactive: … so finally, I hereby present an alternative submission with all the features.

My top 3 tips:

  1. The “highlight” column is not just a UI quirk but the key to maintain proper ranking when switching from top to bottom. If you don’t believe me, check the interactive dashboard. Widen the column, and apply sort.
  2. The exclude/include others selection must change how the percentages are calculated. Think of all & allselected here.
  3. You may or may not need this but in the approach I was taking, once I had every column set up, chaos ensued. The matrix no longer made any sense. This is where I almost gave up. But all I needed was one measure to keep only non-blank items in the matrix.

Also, I found an error in the interactive dashboard (but only after finding it in mine).

This has to do with how rankx ASC is calculated. However, if I change the method, try to get rid of tied rank for blanks when filtering for business line, then the binning won’t work. At least I could not make it work.

All in all, great workout as always! Thank you.

4 Likes

hello,
Most of the hard work is done, but some issues still to solve

  • Top /other hierarchy
  • I did not change the way of calculating GT when only the Top group is chosen as no sense without hierarchy :frowning:
  • at the moment of loading I find that forget about the business line.
    I need to refresh my mind and come back to this


Workout 013d.pbix (135.8 KB)

3 Likes

I should have been working on student projects this week, but this hierarchy kept me awake, so I’m uploading a second solution :slight_smile:

I’m especially happy that I managed to create a supporting table (Top/Bottom/Others) that will automatically update, even if we change the number of available ‘bins’.
Conditional formatting doesn’t work for “Totals” the same way as in Gustaw’s solution when I select “exclude” - it always shows the color of the selected group, but I actually like that because it emphasizes that it’s not “Total” for all clients.

Of the problems I still see is sorting. Currently, ‘top’ and ‘bottom’ groups are set to always be at the top of the table.
And there is also the issue noted by @Noemi with incorrect number of clients displayed when using the “business line” filter and the “Bottom” group, but I have no idea how to solve this.
AS_Workout13
Aleksandra_Workout13.pbix (356.8 KB)

5 Likes

@Noemi , @Aleksandra
Spectatular work. Your solutions looks amazing (both in terms of the design and the included functionalities). Thanks @Noemi for catching the issue with bottom ranking.
As a quick fix, we can introduce additional filter to the table which on which we execute the rank, so blank will not be considered as first or last item (depending on type of sorting) so the first non-blank item will get e.g. #1 instead of #2 and allows to display e.g. all 5 items instead of 4.

LOL you make it sound so simple. But this time it was. :wink:

1 Like

It works! Thanks for tip :slight_smile:

1 Like

Pavlo Tomkovyd Revenues & Gross Profit.pbix (123.0 KB)

Nice challenge :slight_smile:
Thanks

PS. I have no idea how to change my nickname))

4 Likes

Hello Friends!

Find below my solution for Workout 013 (pbix includes some additional tables and measures related with previous workouts).

Workout 13 - Gustaw Dudek.pbix (1.4 MB)

I have to sadly inform you, that all workouts are temporarily paused. I’ll keep you informed about any further changes and plans.**
That way, I would like to say that I genuinely appreciate all your time put for our workouts so far. Literally each of your posted solution was phenomenal, thoughtful and just great.

And don’t worry. We gather here really phenomenal people and I’m really glad that through this amazing Enterprise DNA initiative we had a chance to meet each other. Feel free to reach me out on Linkedin (otherwise I’ll reach to you, but your message would help me to identify your Linkedin profile), and we will come up with something.

Besides, let me know which workout(s) was your absolute favorite so far! : )

See you soon

3 Likes

@Gustaw,

Thanks for putting these all together. Absolutely wonderful stuff. I hate to hear that it’s ending, too. That’s a disappointment.

1 Like