Thank you ![]()
It wasn’t easy.
4 Likes
Hi there,
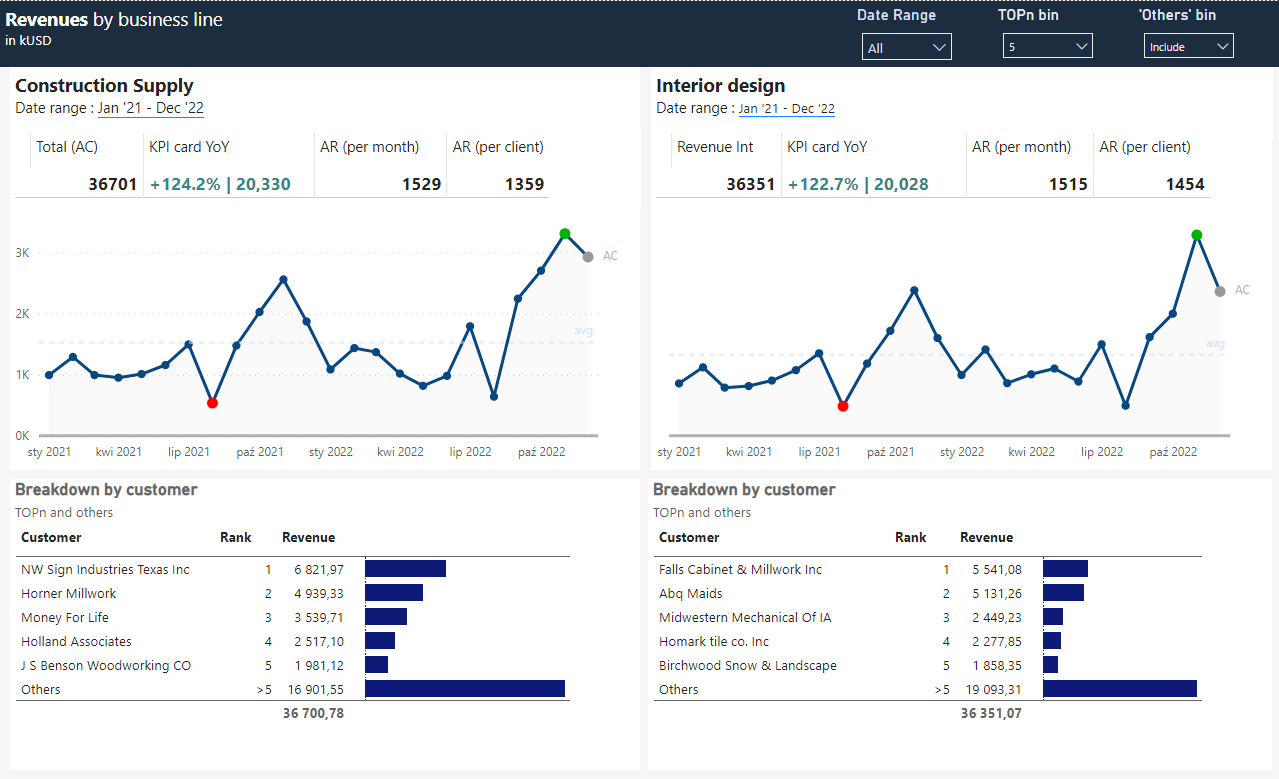
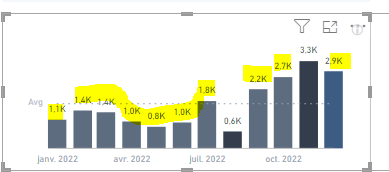
How is everyone getting the marker with the dark border and white centre? I have searched the format pane but can’t find it
2 Likes
Hi Kim.
Either by using conditional formatting in “Clustered column chart” for given data point, and then switch back to line chart and apply another layer of marker (conditional formatting in column chart produces additional bottom layer marker) or to add two measures, turn on markers for each measure and adjust sizes so one will be smaller and second bigger (which creates expected effect).
Hope it will help.
All the best!
2 Likes
Wow, that’s next level. Thanks Gustaw, I will see if I get time as I am still make final finishing touches.
2 Likes
At first glance at this workout I immediately thought “4.5 stars, surely not, how hard can a bar and line chart be?” Boy was I wrong…probably the hardest dax I have written and I am very pleased with the result. I think I overcomplicated by highlighting top 2 values and lowest value but time well spent and can be reused. Also first time using TopN and other which is also very useful.
Ran out of time to do unified axis and markers which I will attempt next challenge.
Thanks Gustaw for a challenging workout.
Workout #7 Revenue Analysis Kim Cook.pbix (266.6 KB)
3 Likes
Wow, You did rank for others with “>”
I was struggling with it really a lot of time and only errors were appearing. After taking inspiration from your formula it takes me 2 minutes.
Apart this interaction working - I still not find solution for this.
For me You are the hero of this workout ![]()
Submission 2
a lot of extra coffee, even more bugs, but the improvement was done ![]()
Thanks @KimC for inspiration for rank Others with “>”
workout 007c.pbix (105.8 KB)
2 Likes
Hey @renata_kulagowska<
I am glad it helped you. I originally found https://goodly.co.in/top-n-and-others-power-bi/ very helpful.
thx. I will look ![]()
Hello Friends!
Find below my origin visualization set (PBI file may include some additional tables / measures related with other workouts if they’re based on the same dataset).
Workout 007 - Gustaw Dudek.pbix (1.1 MB)
Have a great day!
hi Sir @Gustaw
As I am beginner
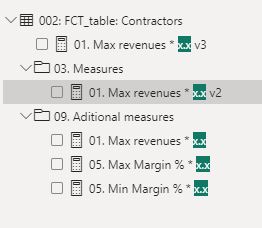
Still I am not getting it was is the login Behind multiplying by *1.1
1 Like
Hi @gilda.klein
Certain measures are calculated to adjust the max value in y-axis scale for very specific visualizations. By multiplying max value x given number (i.e. 1.05-1.15x) we allows additional scale raise, which, in some cases can further improve the label visibility (or visibility of other elements).
1 Like
Thanks Gustaw,
For the Explanation
1 Like
Hi. How do you make the include and exclude others bin work? I downloaded Gustaw’s pbix, but still don’t get it.
Thanks in advance
Hi,
I am new member here and a beginner power bi user.
Are there tutorial also how to make this workout.
Thank you.
1 Like
hello ,
if you ask about ranking for example look at measure (measure Table/Rank of customerOther) in this you at the end have statement
If(SELECTEDVALUE(OtherBin[OtherBin]) <>“Include”,TopnC,RankOther)
Base on this part of statement it works.
The same you will find in Revenue column. column is base on Topn measure ( Measure table / Topn) there you find part " SELECTEDVALUE(OtherBin[OtherBin]) = “Include” " too.
Usually should use this kind of statement together with IF or switch function.
Hope it helps ![]()
1 Like
Hi @EnanBahadur the idea of these workouts is to try and build them yourself. Some of these techniques are a bit more advanced than beginner level.
@Gustaw supplies his completed file at the end of each workout so, for areas you struggled recreating, you can pick apart his file to help you understand how he build the magic.
1 Like
Hi,
To practice, I’m reproducing the solution, but I’m having trouble replicating the conditional formatting of the column visualization.
Do you know where my formula issue comes from?
Thank you in advance.
007 Workout - Remi Martinato.pbix (342.3 KB)
1 Like