Workout 006 – Contractors profitability – bookmarks & bookmark navigator
Difficulty rating: 2.5 out of 5
Intro note
After a few tough workouts that included variety of different dax techniques, this time we are going to put less focus on that matter and address a quite relevant UI/UX aspect, which in PBI is heavily related with bookmarks functionalities.
This technique is fairly simple yet very powerful and I strongly believe that it’s going to save hundreds of ‘clicks’ and make even complex visualization switches quite comfortable - which also helps us to expand our creativity (if it’s a simple process, then we know we can implement them more often in our projects).
During the workout, I kindly ask to focus on a very specific bookmark functionalities, which are: turning off the “Data” option and turning “Selected visuals” on (when updating the bookmark), creating bookmarks groups (similar as groping the objects but this time we are going to group bookmarks) and incorporating bookmark navigator (to further saves a lot of clicks comparing to button creation in a standard way). Whenever sth will need further explanation or guidance - please, feel free to ask on the forum.
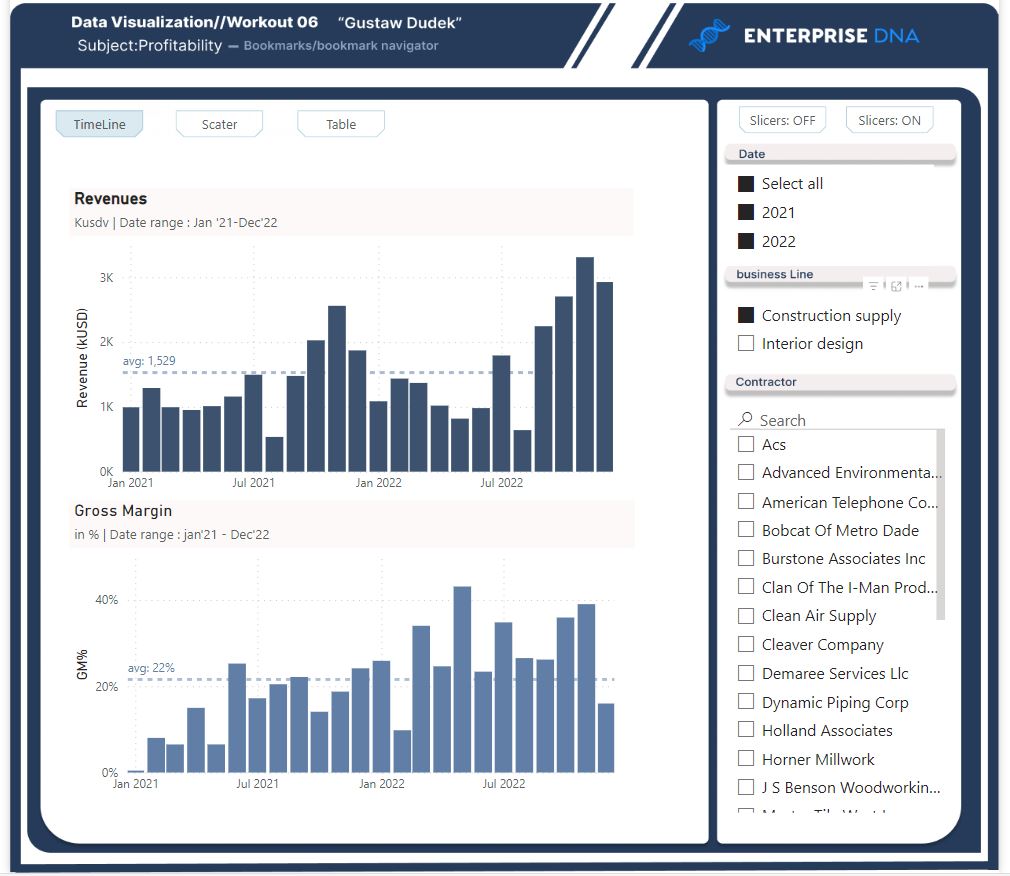
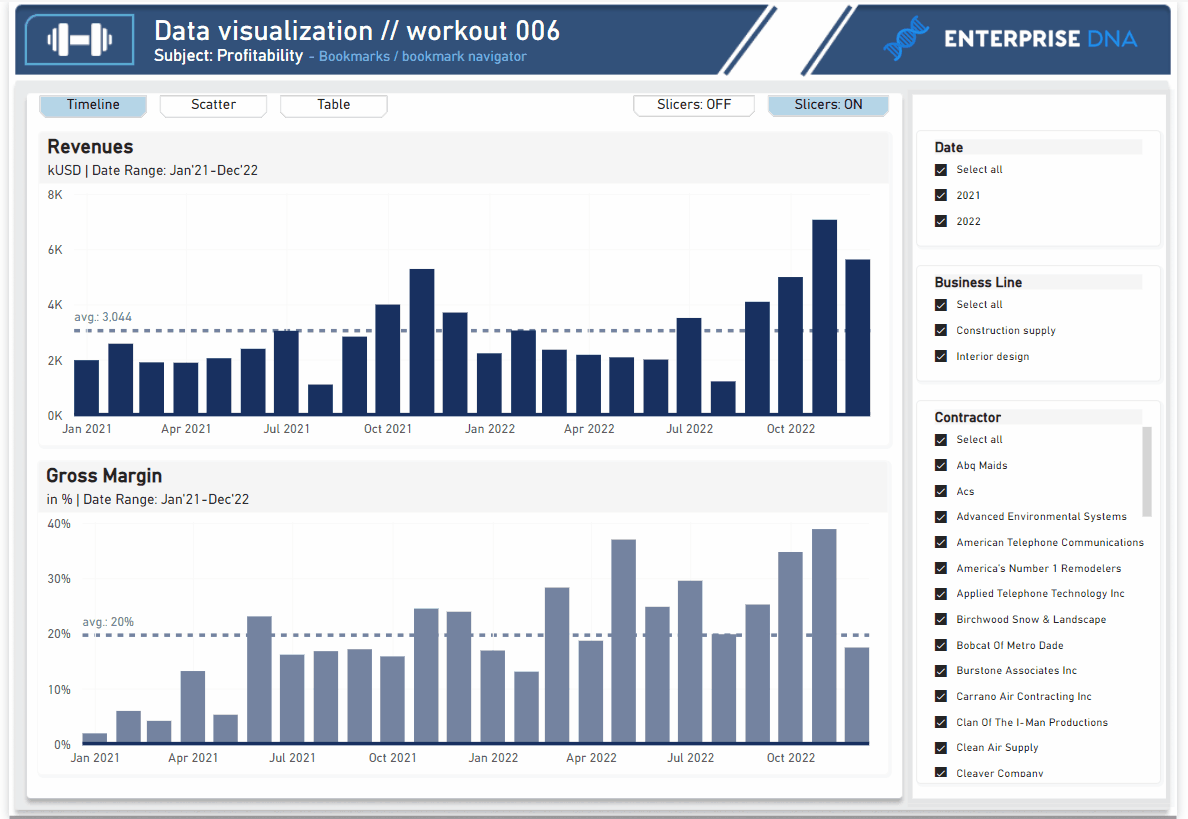
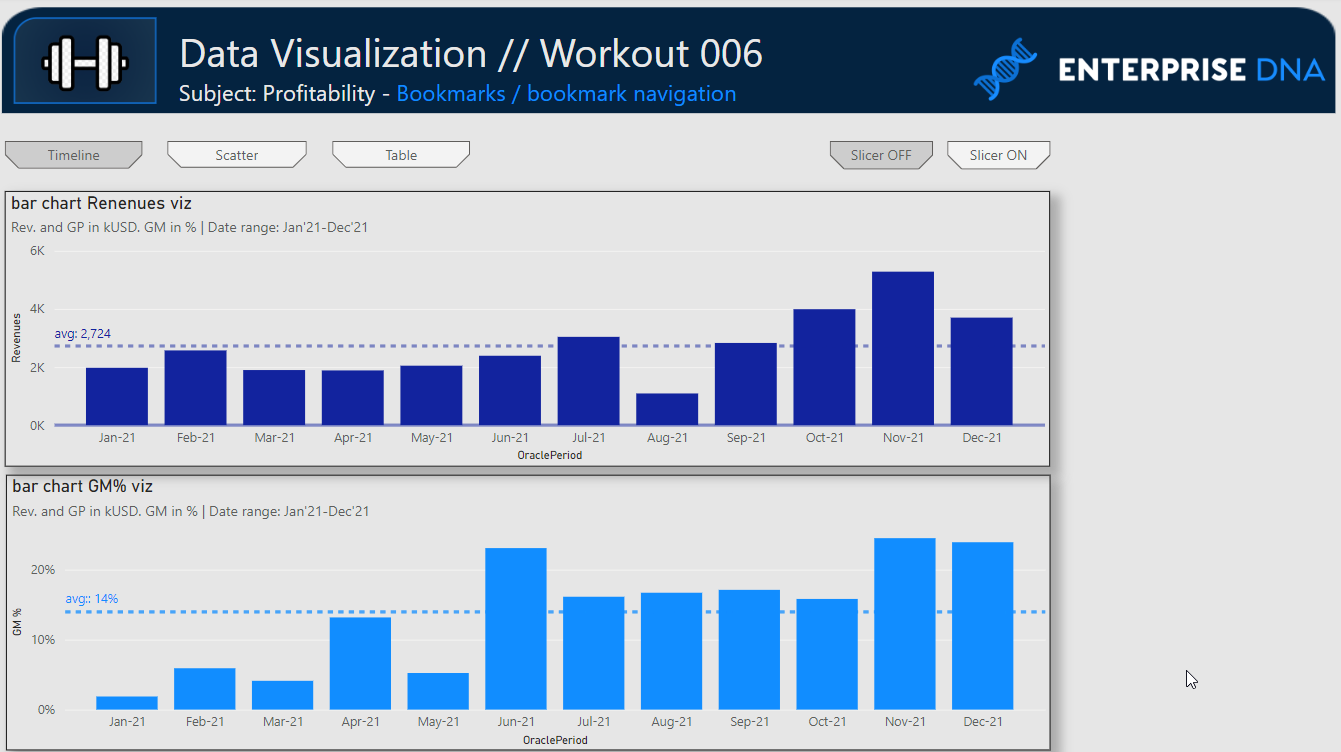
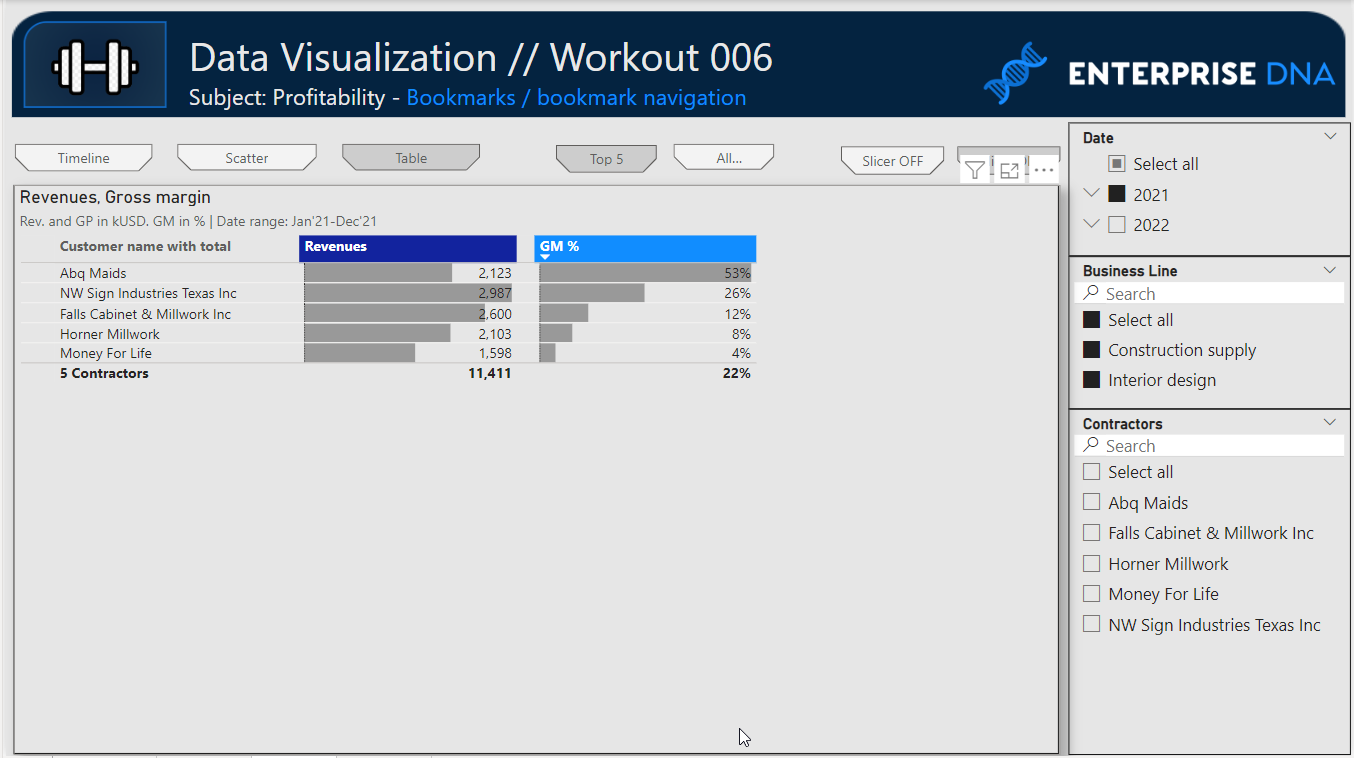
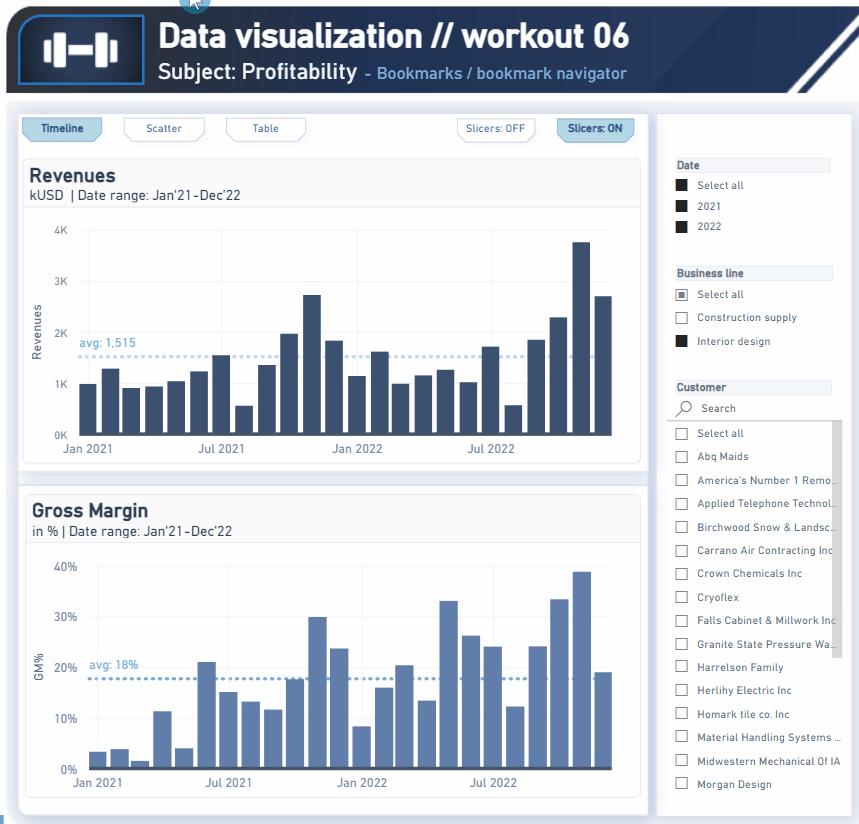
Three included visualization (column chart / scatter chart / table) include only basic formatting options and does not include any more complex PBI functionalities. This are basic visualizations that allows us to create user experience though bookmark implementation.
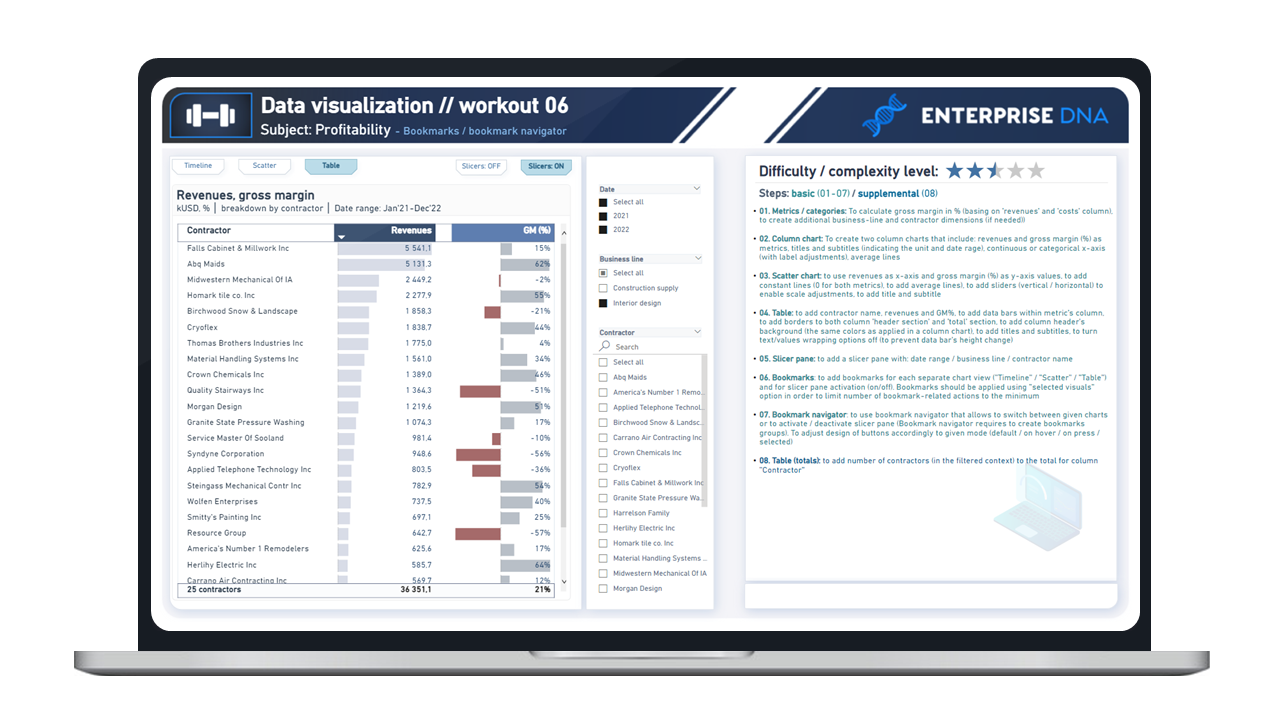
This workout combines various visualization techniques. The most important part of the workout is practice - entries does not have to include every element or functionality to be still considered as great . Please pay attention to the list of functionalities (provided in the screenshoot and in published-to-web report), which includes ‘basic’ elements (1st-7th point), and supplemental (8th point).
Following workout bases on exact same data source as provided in workout 002 and workout 005 - if you already participated in one of this two workouts - please feel free to reuse your already transformed datasource / model / measures etc.
**Following workout does not require to use each column. Nevertheless, please feel free to use any columns and any data which is valuable from your perspective. Feel free to use your entries as a part of your project portfolio, if it’s instrumental in realizing your goals.
Goals
In this workout, using the supplied dataset and reviewing the provided interactive report (link below) we are going to replicate the following set of vizualizations (left section in a report screenshot), including the column charts, scatter chart, table, slicer pane and bookmark navigation experience. Also, please feel free to add any extra visual if you would like to (provided that core visualizations are included in the first place).
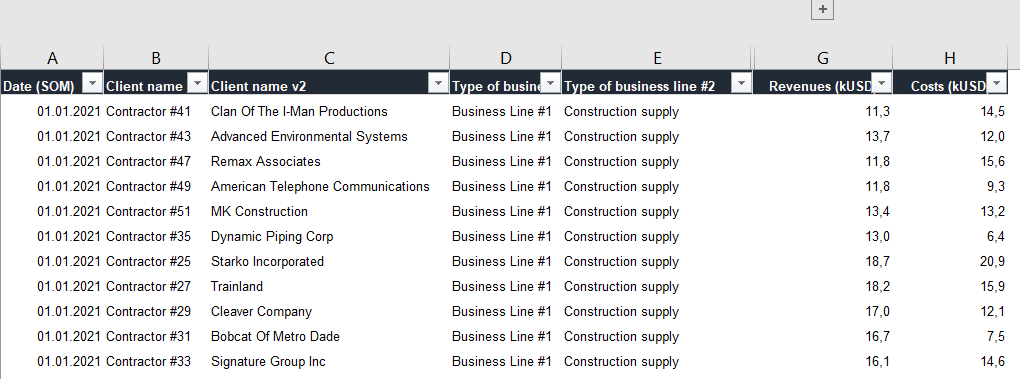
006 - Workout - Contractor profitability (bookmarks).xlsx (110.9 KB)
Core actions (practice) :
-
- Making basic calculation (gross margin)
-
- Implementing basic formatting options in column & scatter chart and in a table
-
- Using object grouping
-
- Using bookmars and bookmark groups
-
- Using bookmark navigator
Submission
Please load the supplied data (xls file) into a Power BI file, replicate visualizations (considerating list of points in the introductory report screenshot and the general design and functionality provided through interactive published-to-web report), and reply to this post including the screenshot (or a gif) of your solution along with the pbix file (please, include name or EDNA forum nick in the pbix name).
Period
This workout is released on Tuesday April 05, 2023, and the author’s solution will be posted on Monday/Tuesday May 8-9, 2023.
Additional materials
Link to the interactive dashboard:
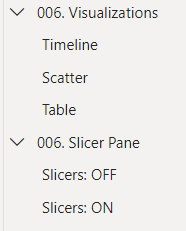
Sample view of grouped bookmarks:
Sample view of grouped objects:

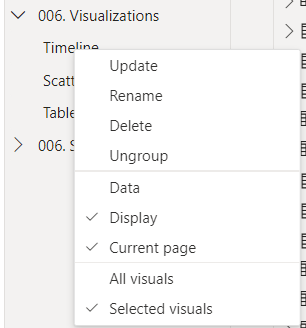
Sample view of used bookmark options:
Sample presentation of following workout:
Have a great fun!
Best regards!