@Remi10 , Please, try to resize the object (width / height)
Indeed, by adjusting the size, I have the same cursor as in the solution. Thank you.1
1 Like
No problem. Glad it worked!
1 Like

Hi! It’s totally “optional” functionality.
It gives you the ability to show only certain data labels when you present two metrics at the same time on your bar chart (in my case it was intended to be used when you have selected “Both metrics” in “Displayed as” slicer). Please, check my interactive version to see available scenarios for label visibility.
Hope it will help, @AlexandreAndrade ![]()
1 Like
Ok. I didn’t realise when and where it worked
1 Like
Hi everyone, here is my solution to this amazing workout.
Although I was doing the exercise after Gustaw shared the solution, I tried not to cheat. I only glanced at the tooltip because I didn’t have much time to look for the trick.
Pbix
Workout 005_AA_Final.pbix (913.6 KB)
2 Likes
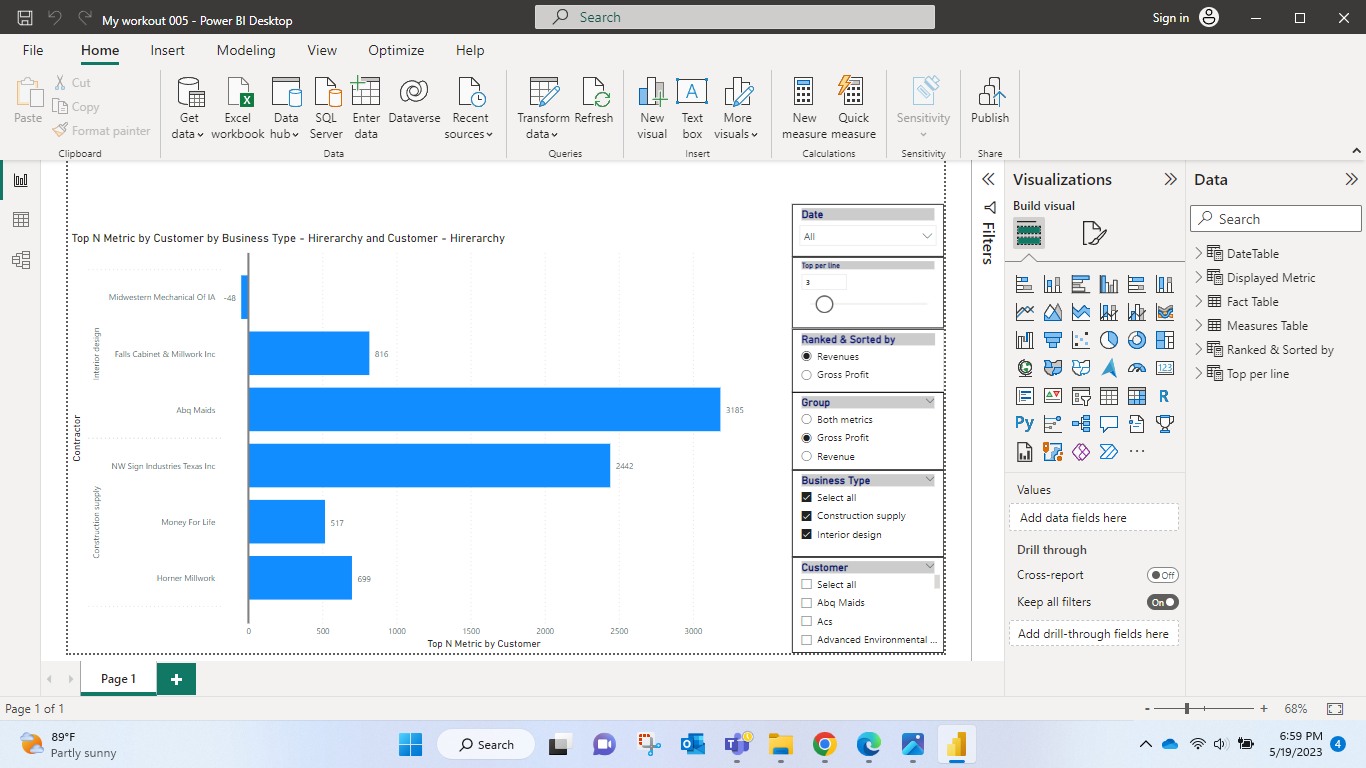
Hi all,
Few of the requirements are met but i’m stuck at some places.
- I am getting the correct names and values but sorting is not working.
- On selecting both metrics in the group, how to get values for both?
Here’s the attached solution along with ss.
My workout 005.pbix (95.9 KB)
@Gustaw - Okay almost finished (~75%). I am stuck on the “applying the Top N” value and limited the number of rows.
Anyone help or guidance you want to give?