hi, thanks for the very interesting subject. please find my solution. I still have to fix few things, but it this time to upload my first entry ;-).
k regards
Roberto
Workout 002 - contractor profitability - Roberto Ravani.pbix (165.1 KB)
3 Likes
@Gustaw I hope to be able to finalize my workout on time… but would you have an application for gifs to offer me please for the presentation? Thanks
2 Likes
Hi Gustaw,
Thanks for a great workout. I found the supplemental questions quite challenging and haven’t quite nailed everything but have run out of time. I have learnt so much and will use these techniques in the future.
Workout Ch2 ScatterGraph KimC v1.pbix (202.5 KB)
3 Likes
Hi @Remi10
Personally, I use ScreenToGif app.
Looking forward to seeing your great entry!
Best regard!
2 Likes
Hi Gustaw,
Thank you for the opportunity to improve my Power BI knowledge with your tasks. Glad to share my work.
Workout 002_EDNA_AngelinaM.pbix (488.2 KB)
2 Likes
Hi everyone,
This training was difficult and without much time to search I saw some entries to try to find a solution, specially to group/segment part.
Here is my solution:
Pbix
Workout 002_AA_Final.pbix (901.4 KB)
2 Likes
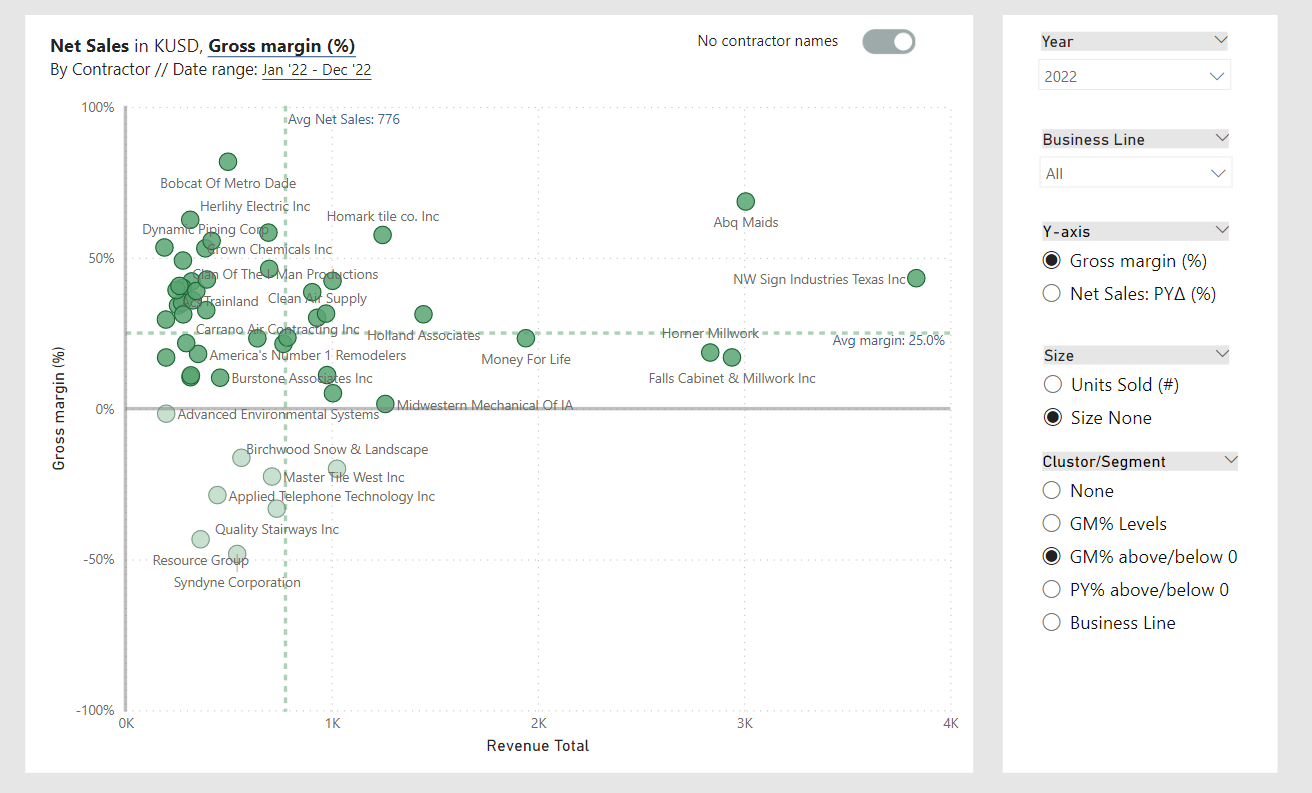
Here is my submission for Contractor’s Profit Analysis workout.
I would like to express my gratitude to the Enterprise DNA team and Gustaw Dudek for creating these workout challenges. It provides a great opportunity to develop skills and learn more about data analysis and visualization in Power BI.
Data Visualization Workout 002.pbix (273.6 KB)
3 Likes
@naby.khalid
Wow, that look fantastic!
Really awesome work, so much details.
I genuinely congratulate and thank you for participation in the workout!
2 Likes
Hi @jtej001.
This looks spectacular! I believe you replicated every single element of origin visualization.
Really nice looking custom legend and great combination of field parameters!
Congrats, and thank you for participation!
1 Like
@rhix Wow! This is absolutely amazing. I like everything you’ve done here. I also appreciate your additional effort to add a few extra valuable visuals (cards / line chart) besides of the core.
Your final version looks like a holistic dashboard, that provides possibility to interact between scatter charts and your extra visuals - so end-user can quickly see detailed information regarding given contractor!
By all means, feel free to use that report as a part of your portfolio (of course that’s your intention) ![]()
Thank you for participation!
1 Like
@Roberto2 , this is awesome piece of work!
You actually already had a ton of work behind you - y-axis change, size, “metric” clusters - all well done!
I also really like the simplistic layout, it look cool!
Congrats and thank you for participation!
1 Like
Hi @KimC !
This entry looks amazing! I like everything here, but besides of core elements, I really appreciate your individual approach when it comes to button design (show/hide labels) and colors for given clusters / segments.
Field parameters works perfectly! That’s a lot of really great (and appreciated) effort!
Congratulations, and thank you for your second participation in the workout!
2 Likes
Hi @AngelinaMihejenkova ,
Superb work! I think you included entire set of elements from the provided list.
All works phenomenally. Besides of core field parameters - I like how you set up the custom legend.
A very minor modification that we could perhaps introduce is sort order in the legend (meaningful especially when it comes to GM% levels selection).
Awesome work! Congrats, and thank you for participation!
1 Like
Hi @AlexandreAndrade
Phenomenal work! Everythings works perfect.
When in comes to the small details, i really like your individual approach in designing the button and added white space between consequtive rows within the table (in the custom legend)!
Big congratulations and thanks for the 2nd participation in the workouts!
2 Likes
Hello Friends
Find below my origin visualization set.
002. Workout - Gustaw Dudek.pbix (1.0 MB)
Best regards!
4 Likes
Thank you, Gustaw,
your comments are very valuable to me. ![]()
1 Like
Hi,
I am practicing reproducing solutions identically and I would like to understand the logic of data classification.
Could you explain it to me quickly?
Thank you
1 Like
Thanks for this awesome workout @Gustaw !
I’m really happy with how mine turned out:
I also made (a really long) video on the process of solving this challenge. Looking forward to the next one!

7 Likes
Here is my submission for Contractor’s Profit 002 Workout
I am really happy to work on this By creating disconnected Table and using field parameter
Gustaw Dudek Scatter plot workout 002.pbix (287.9 KB)
2 Likes
Bit late to the party but I was on holiday last week and ordered to stay away from my laptop…which I mostly obeyed ![]()
Learnt so much from this, I did have to borrow the Conditional Formatting Switch measure but understand it now.
Data Visualization Workout 002 - Contractor’s Profit Analysis.pbix (253.0 KB)
Update - Realised, in my gif, my metric selected in the top left box is displaying Net Sales when Gross Margin is selected and vice versa. This has now been rectified in my published to web version and I’ve included an updated PBIX file.
1 Like