The starting place to many successful Power BI data solutions is the star schema data model.
Goals
• create a relational data model from a flat-file data source
Tasks
Produce a Power BI file that:
• creates fact and dimension tables from the flat-file sales data provided
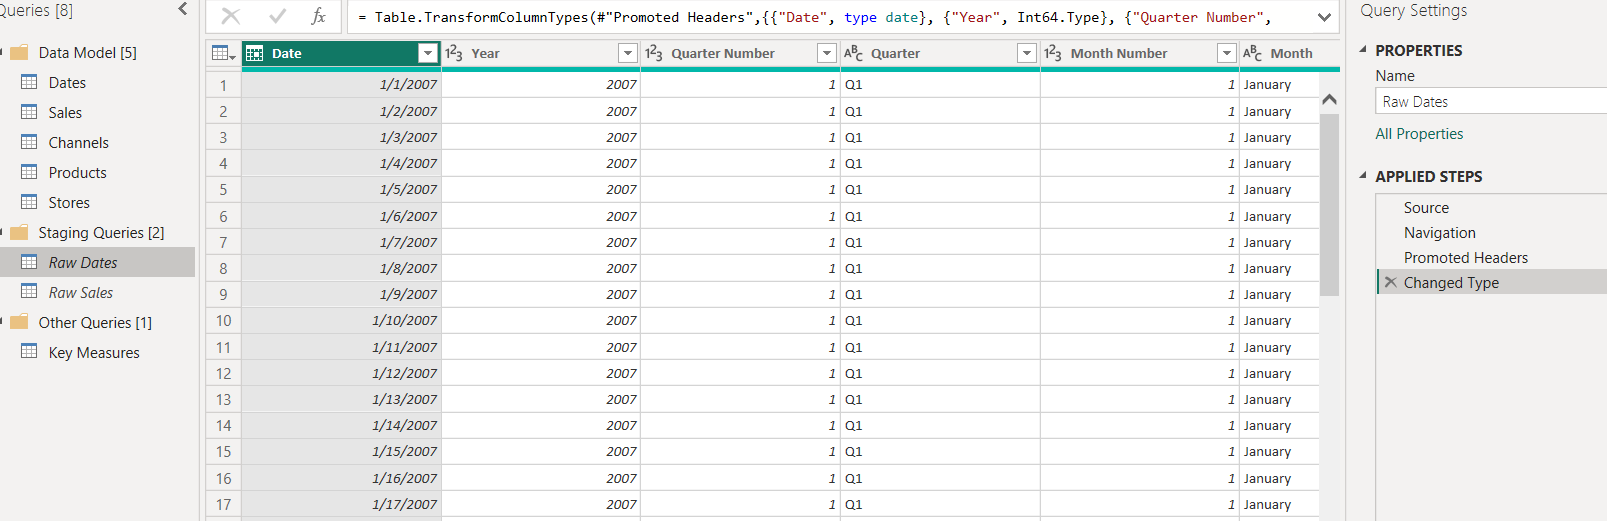
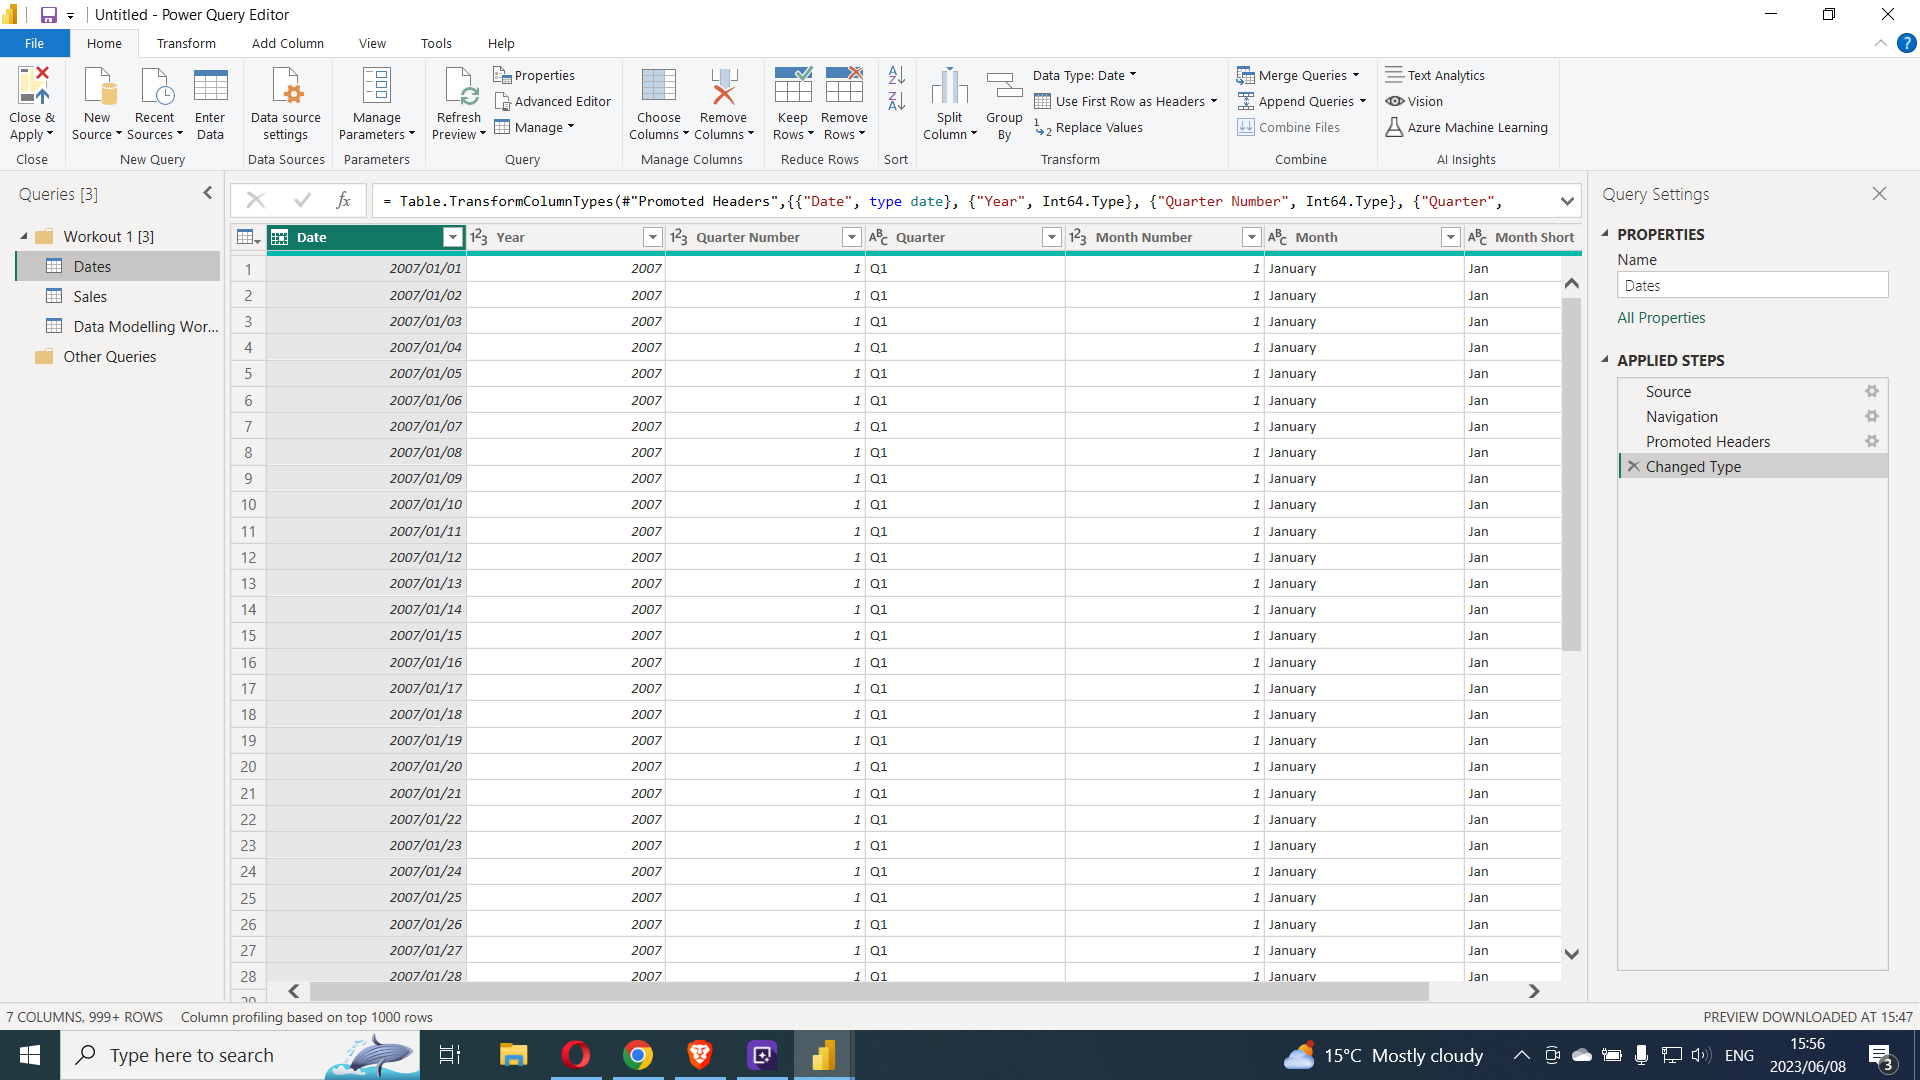
• creates a [Dates] table from the flat-file dates data provided
• creates a [Key Measures] table to house the DAX measures created from the DAX data provided
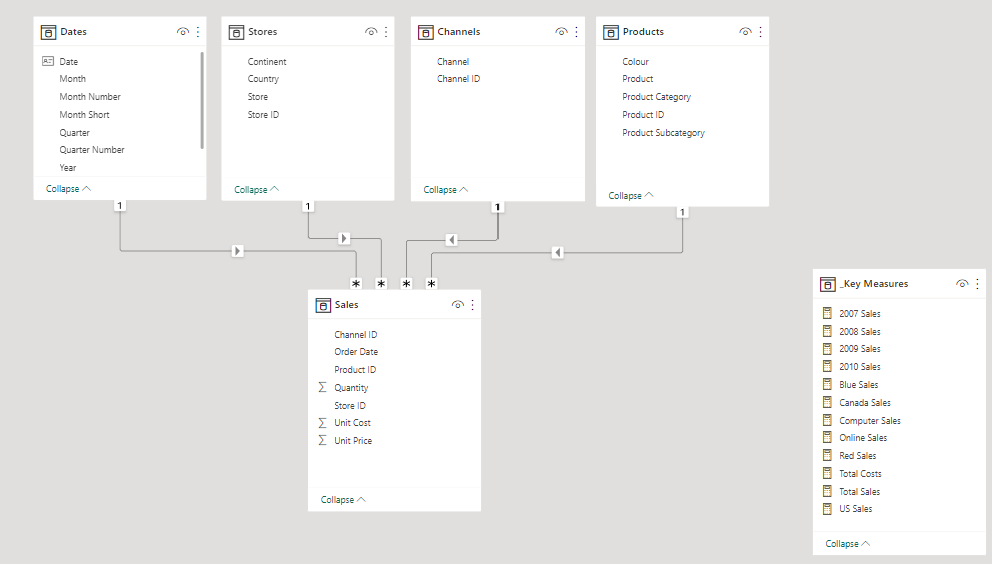
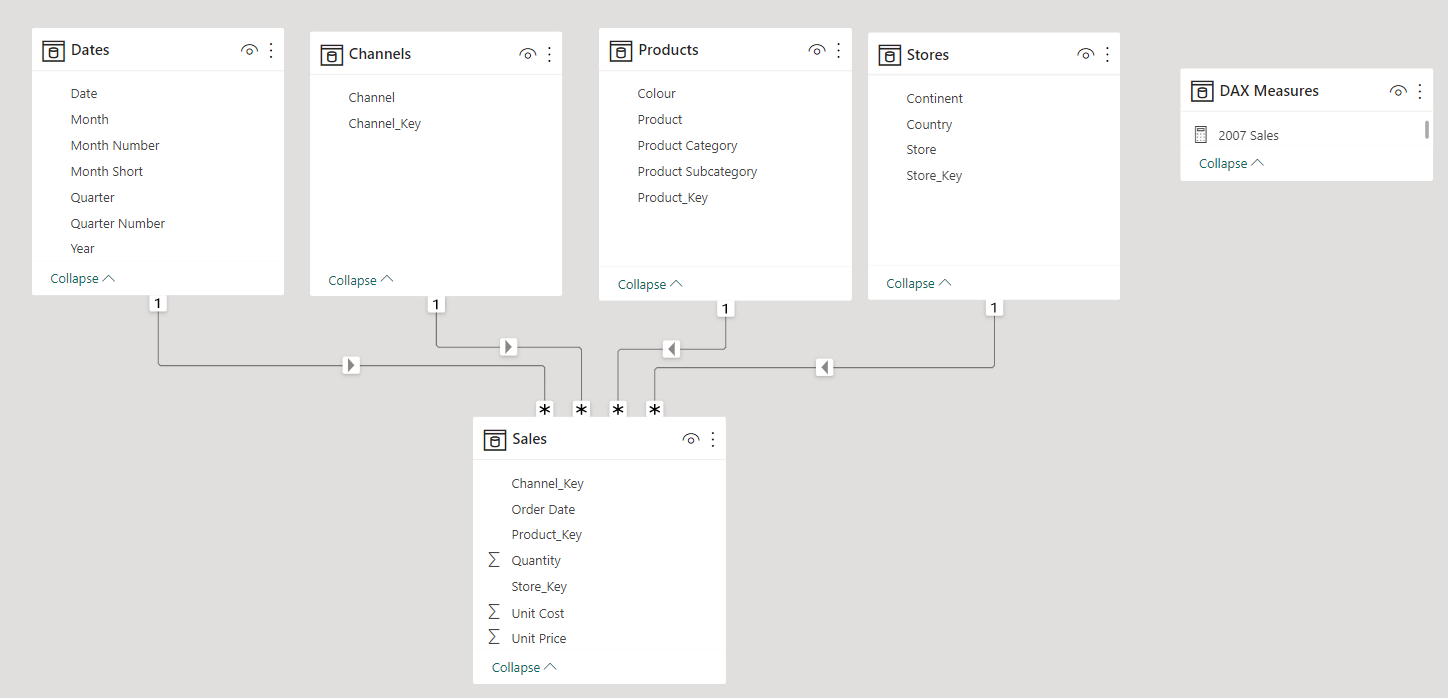
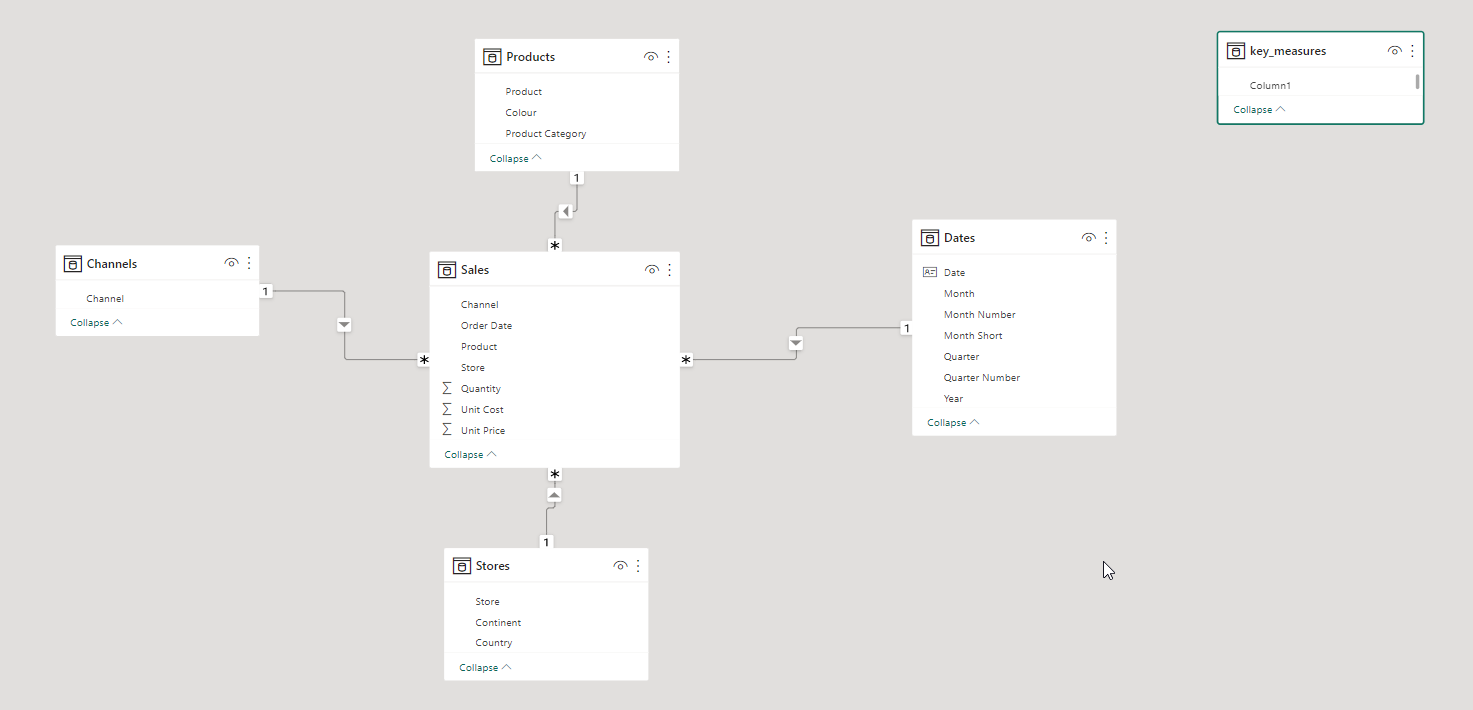
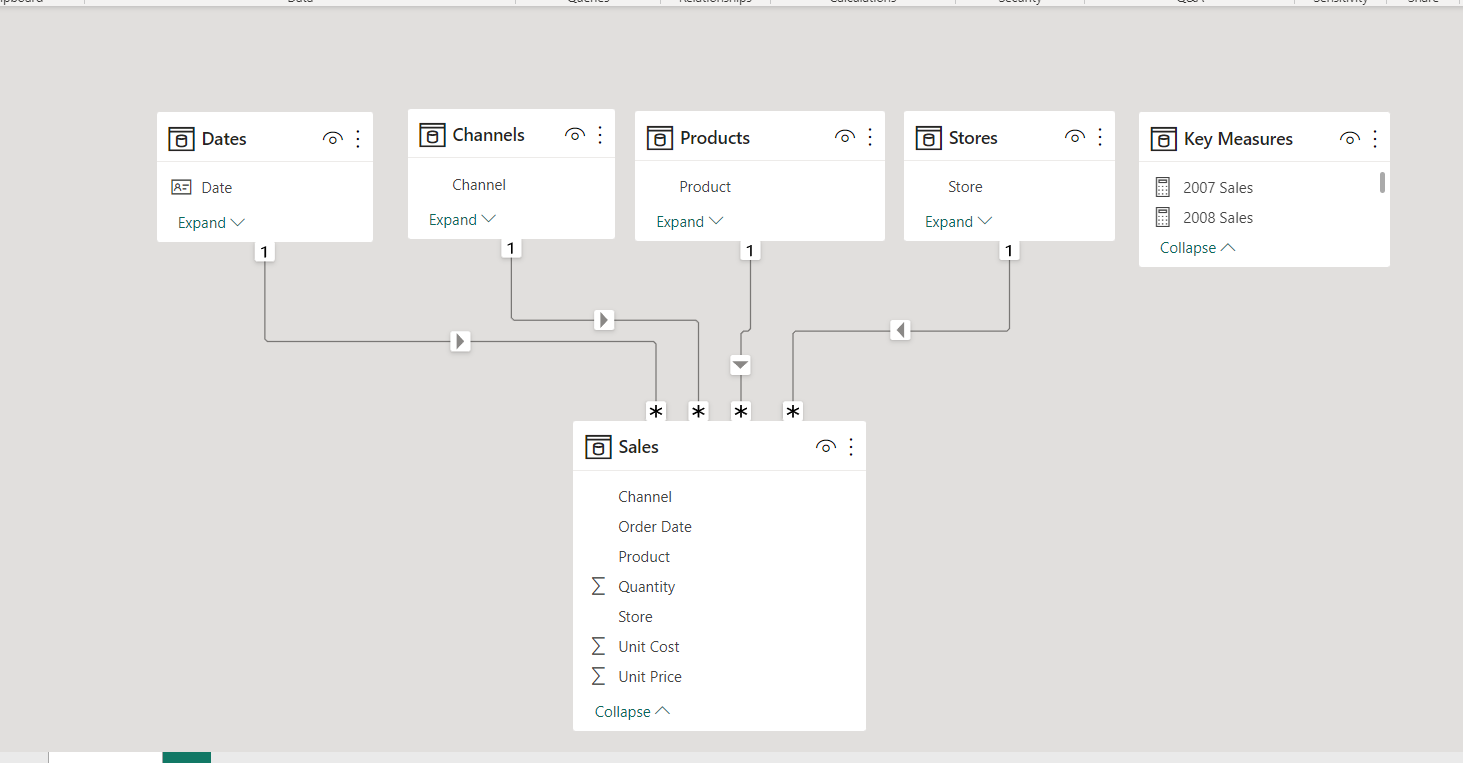
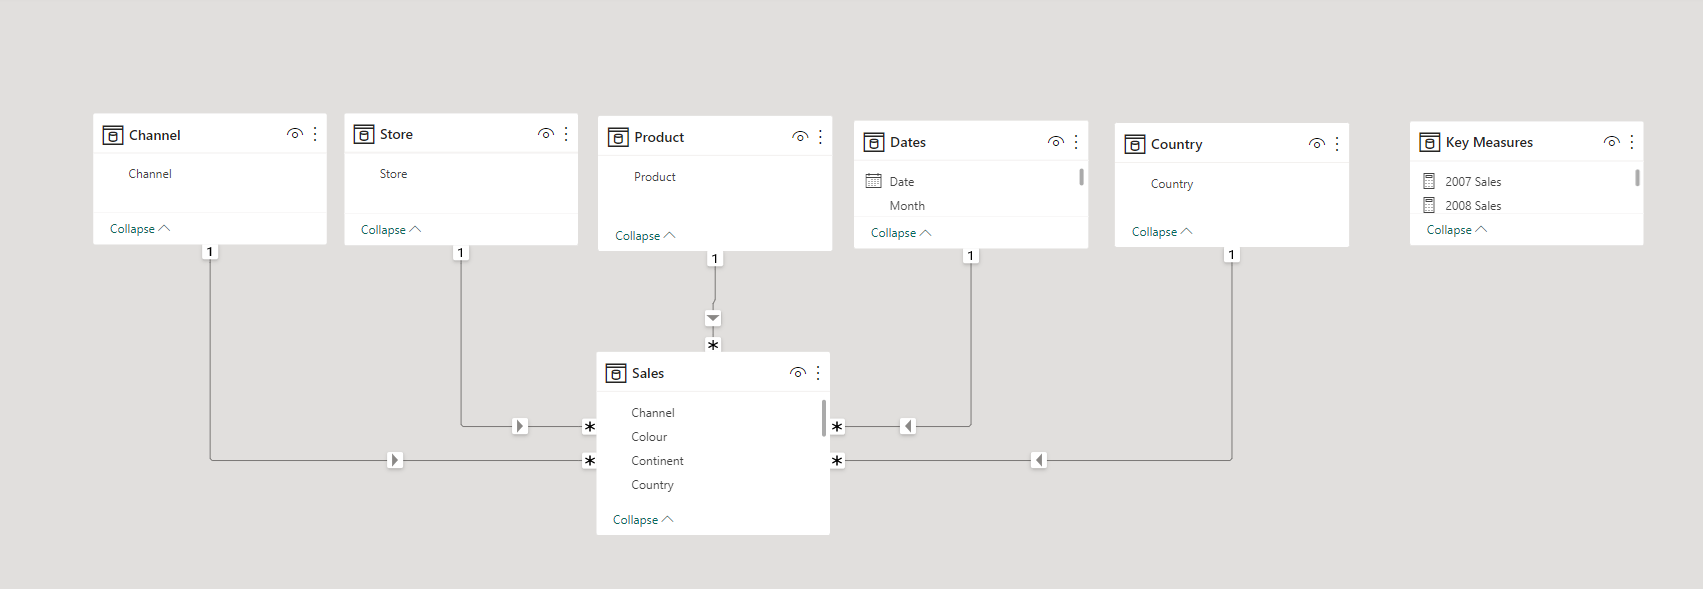
• links the various tables into a full star schema using only 1-to-many relationships and a waterfall layout
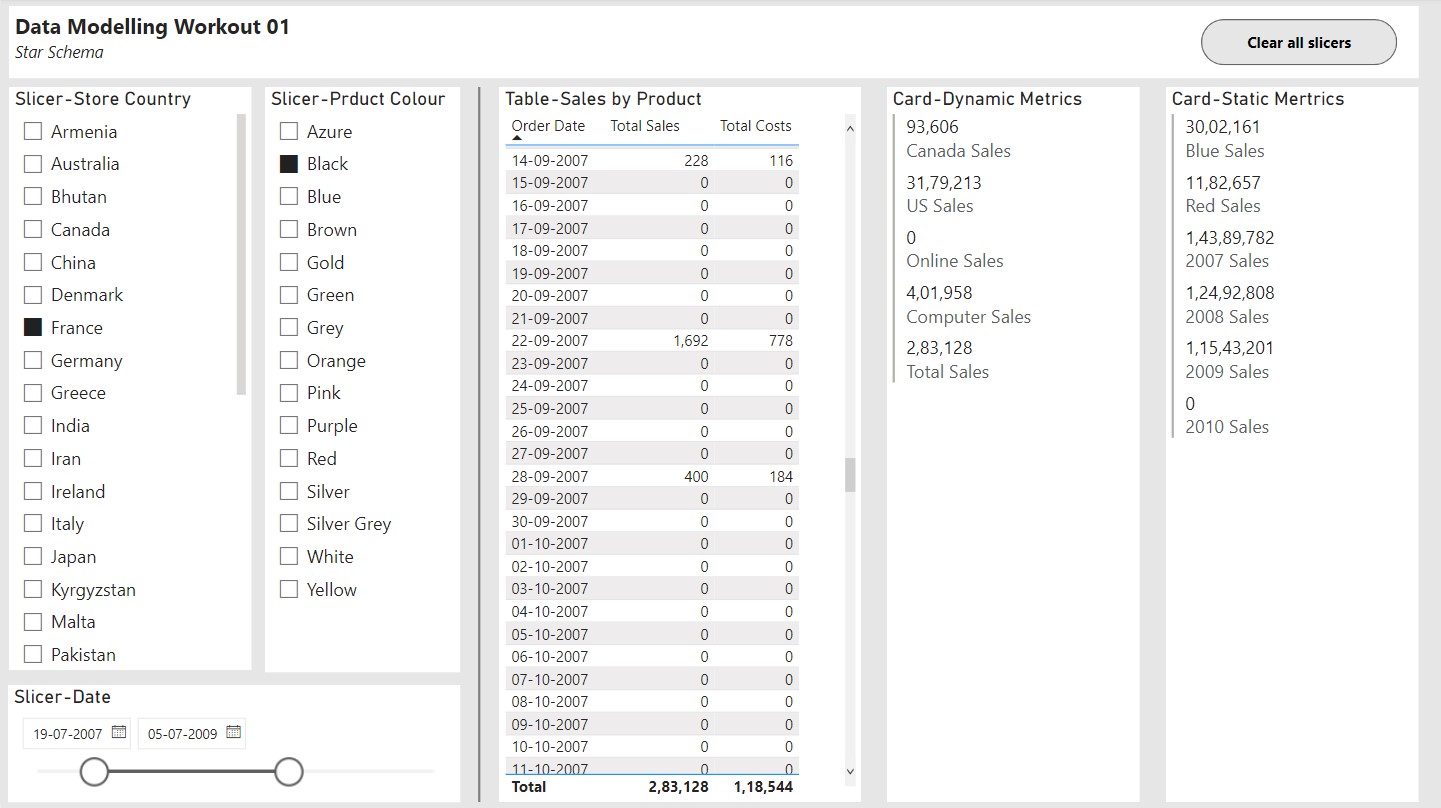
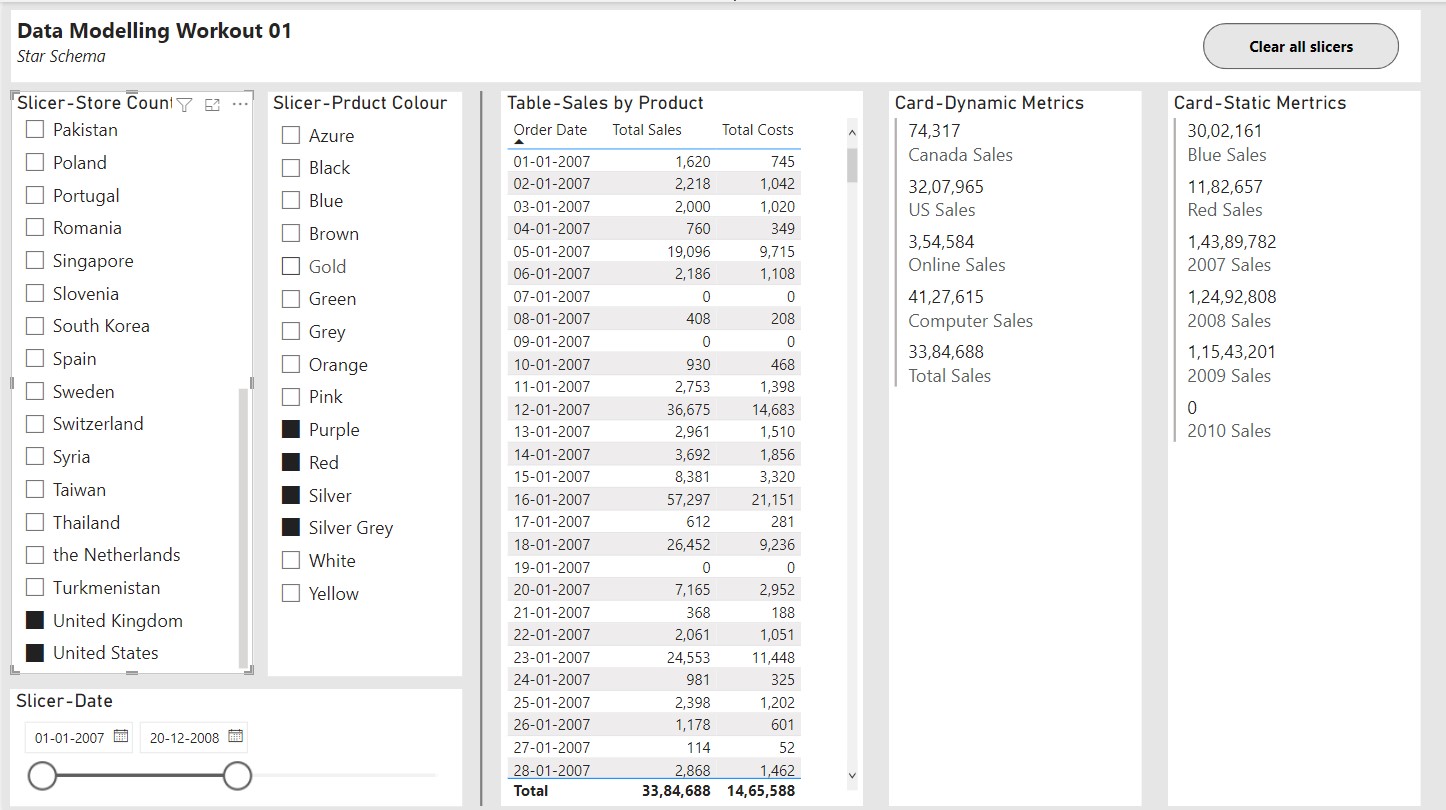
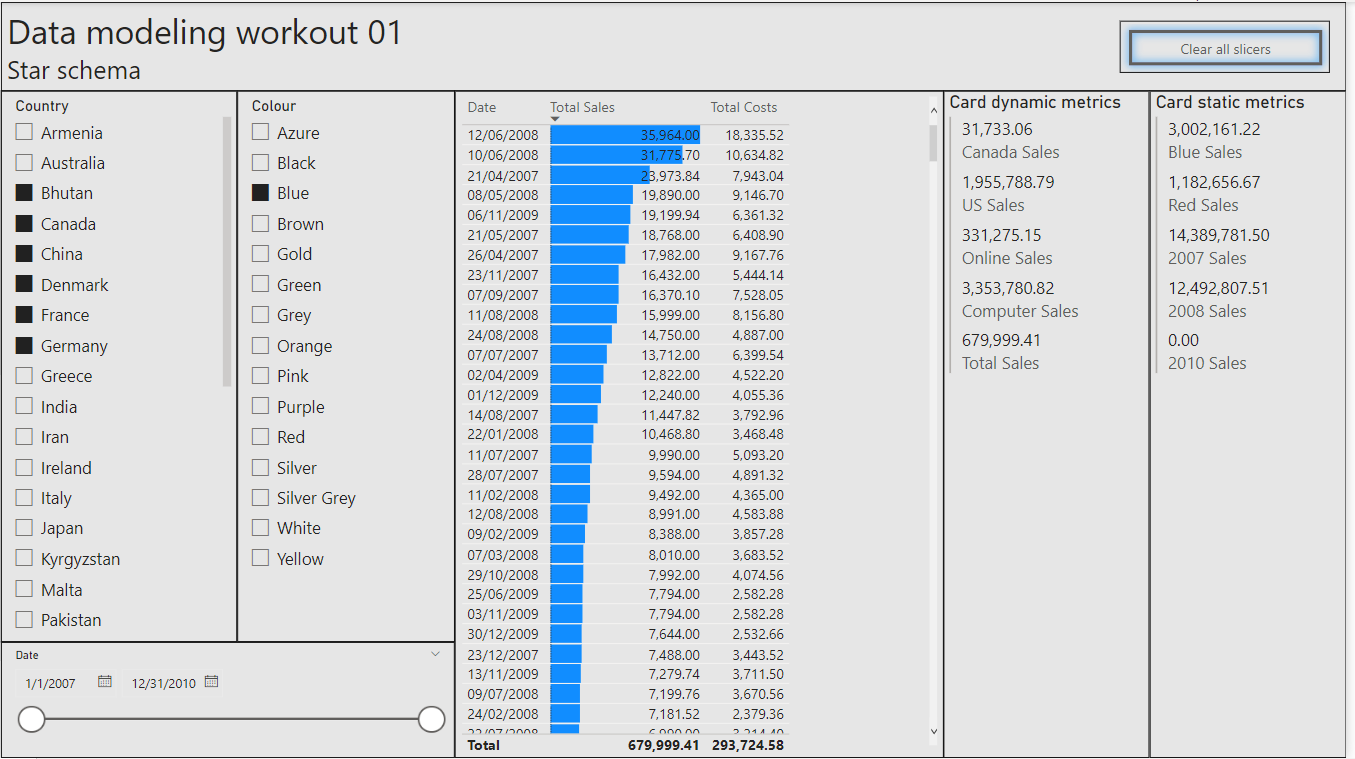
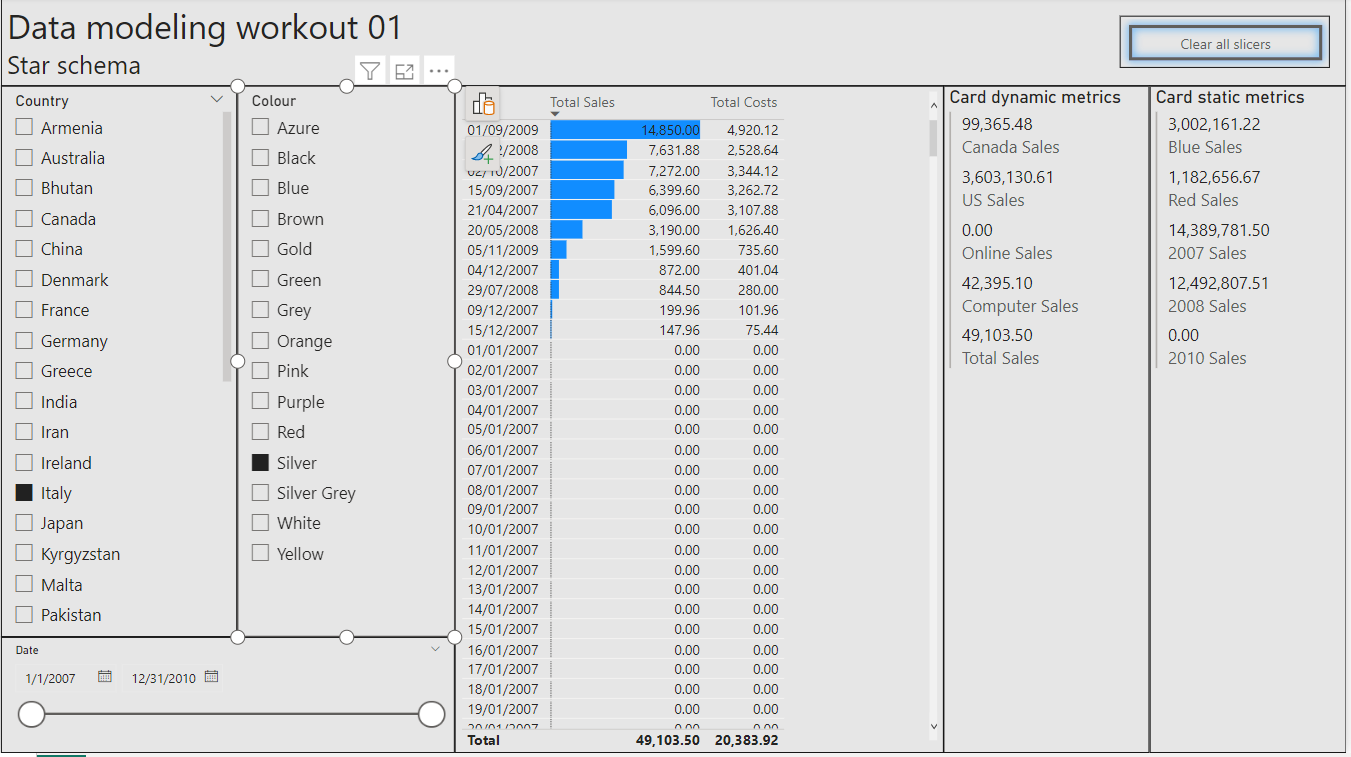
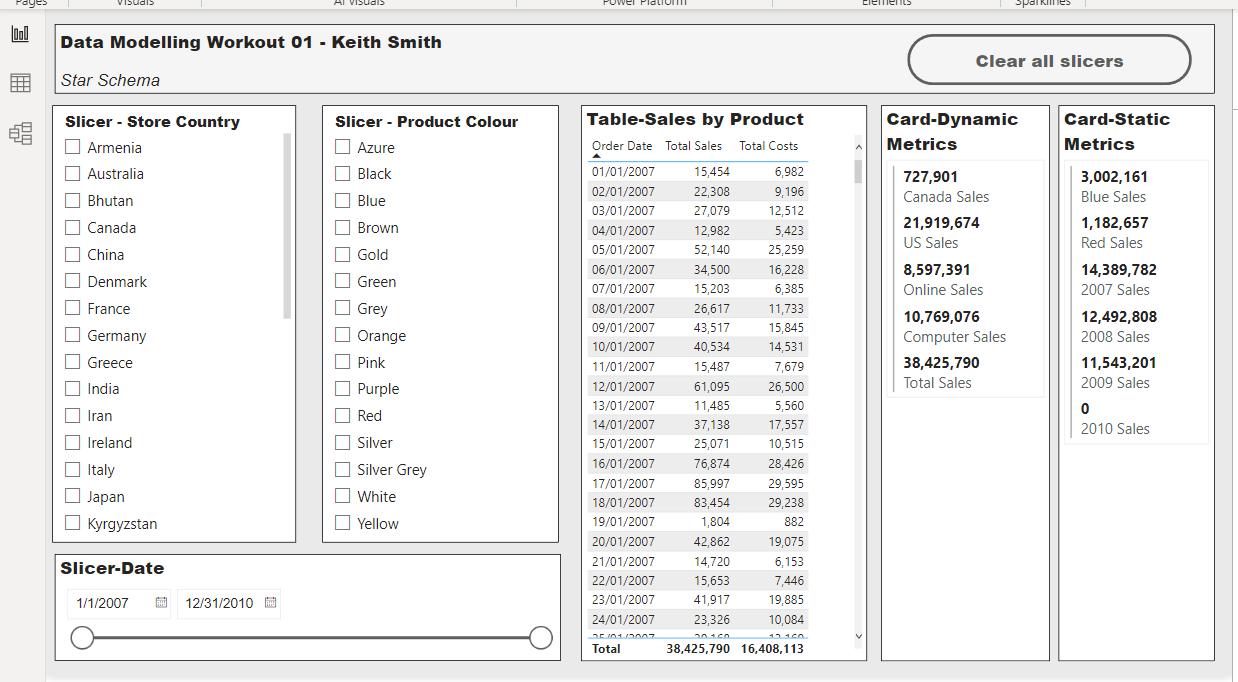
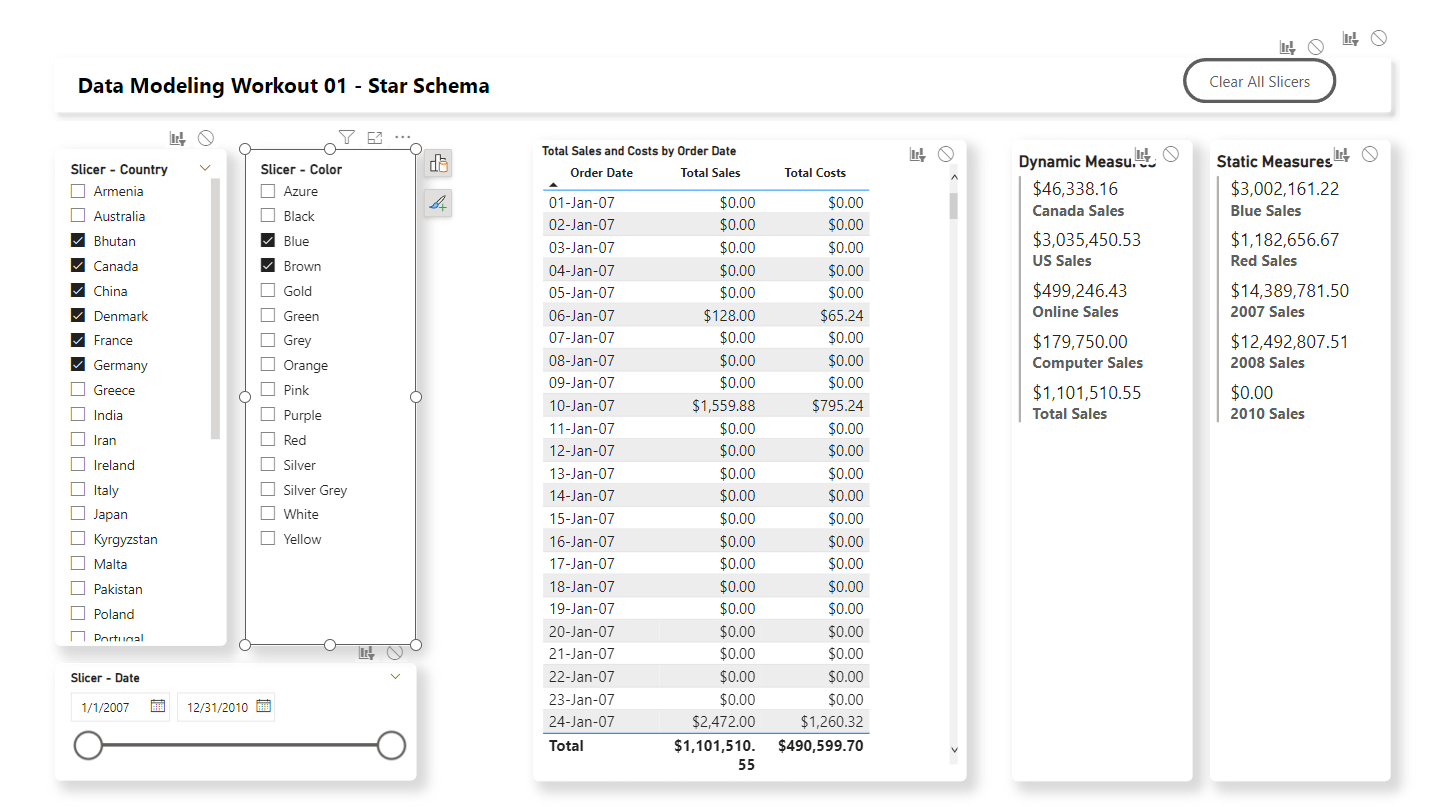
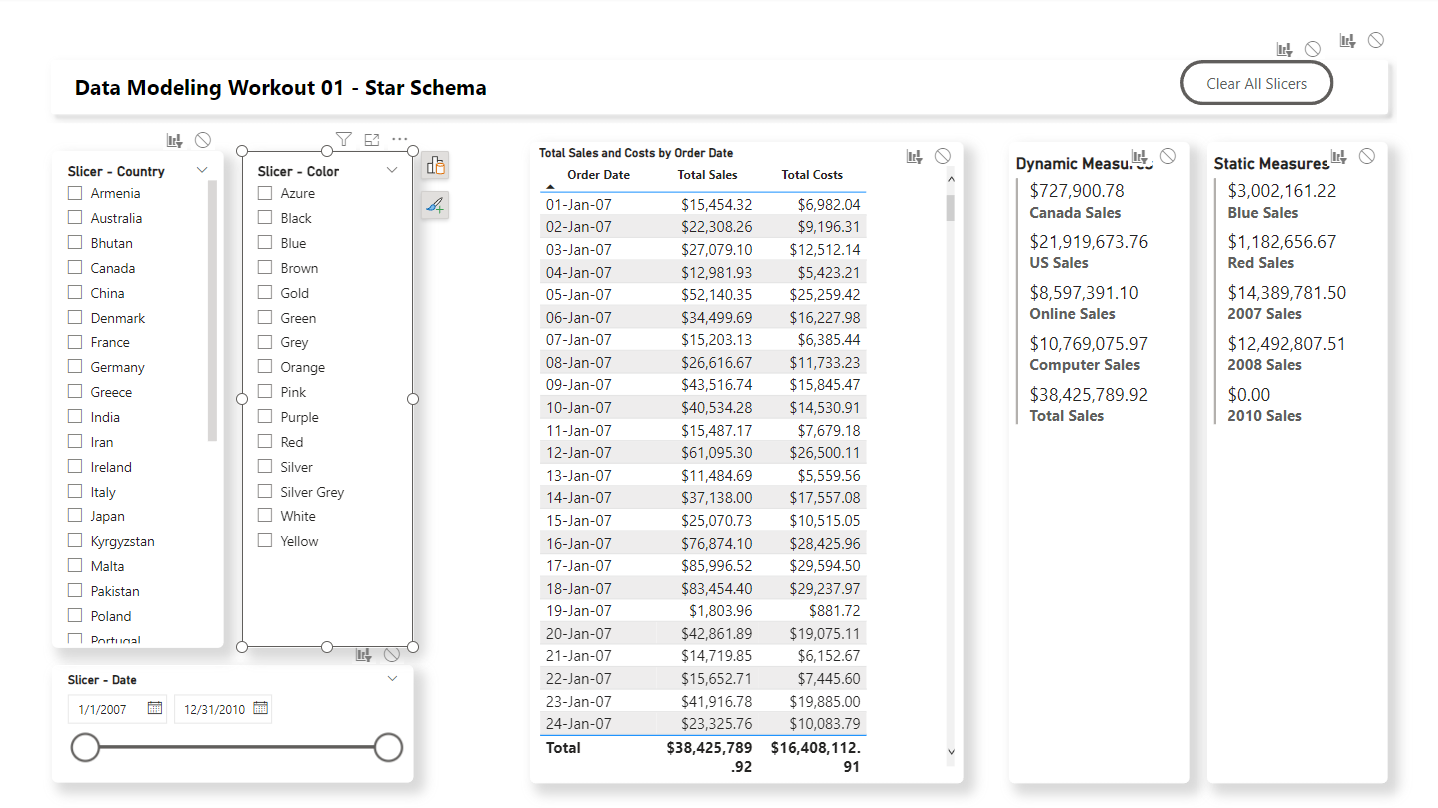
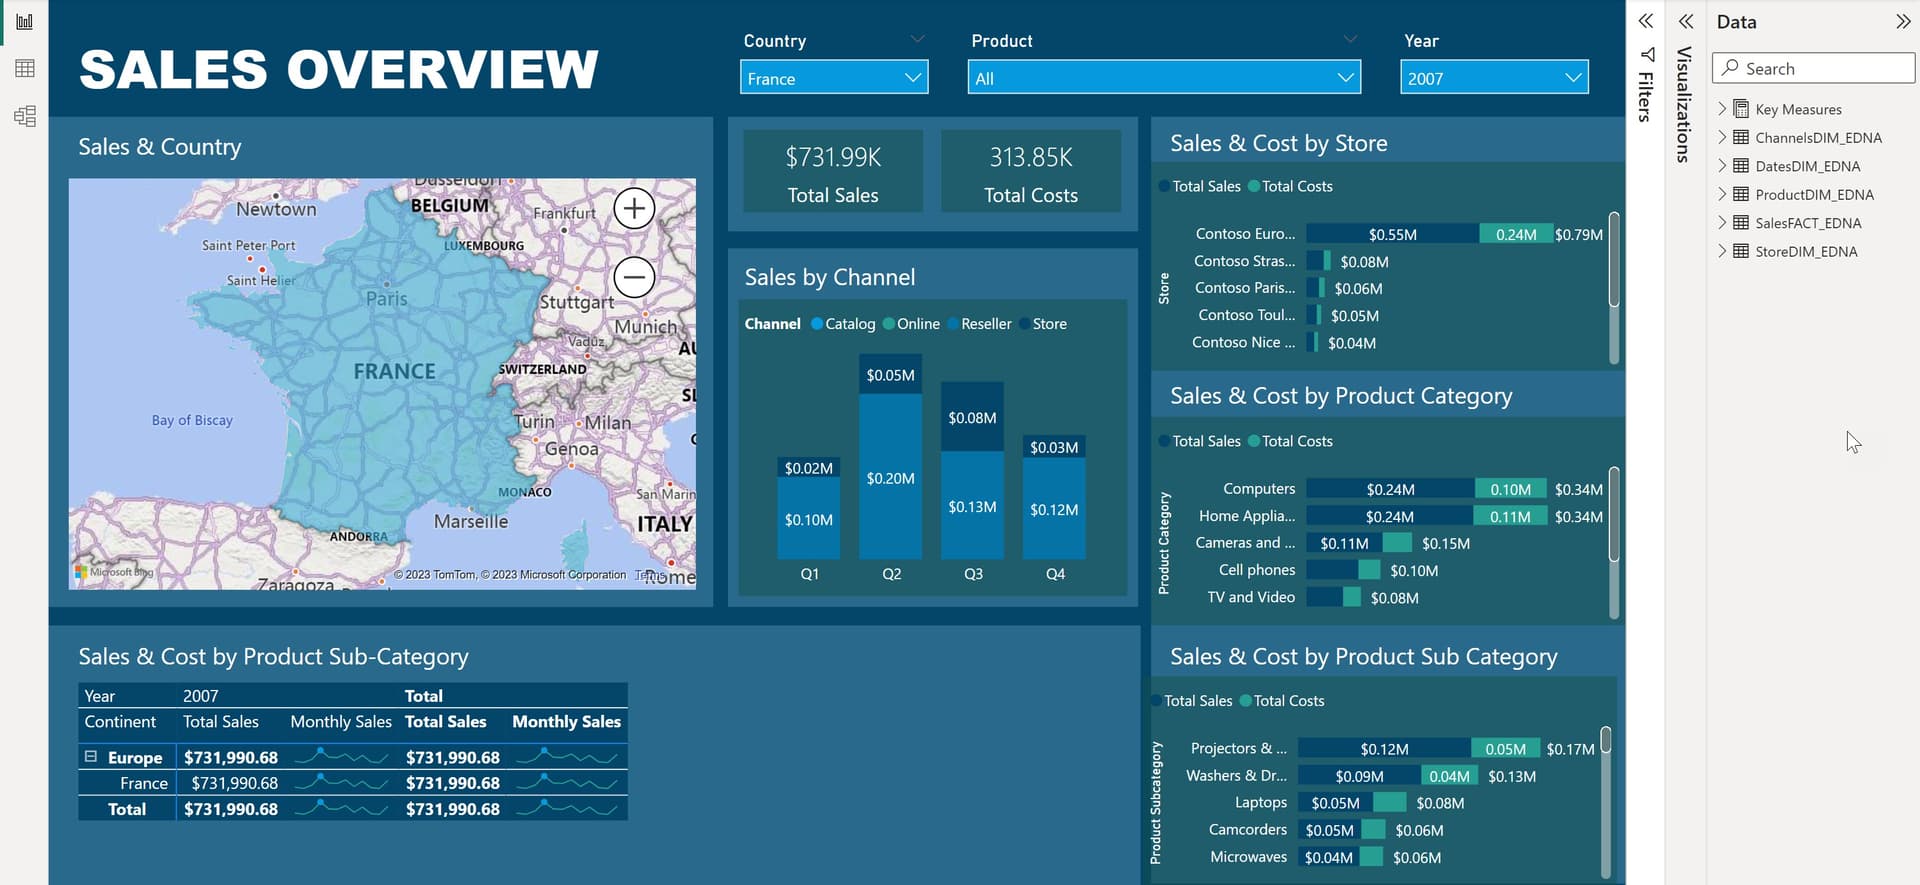
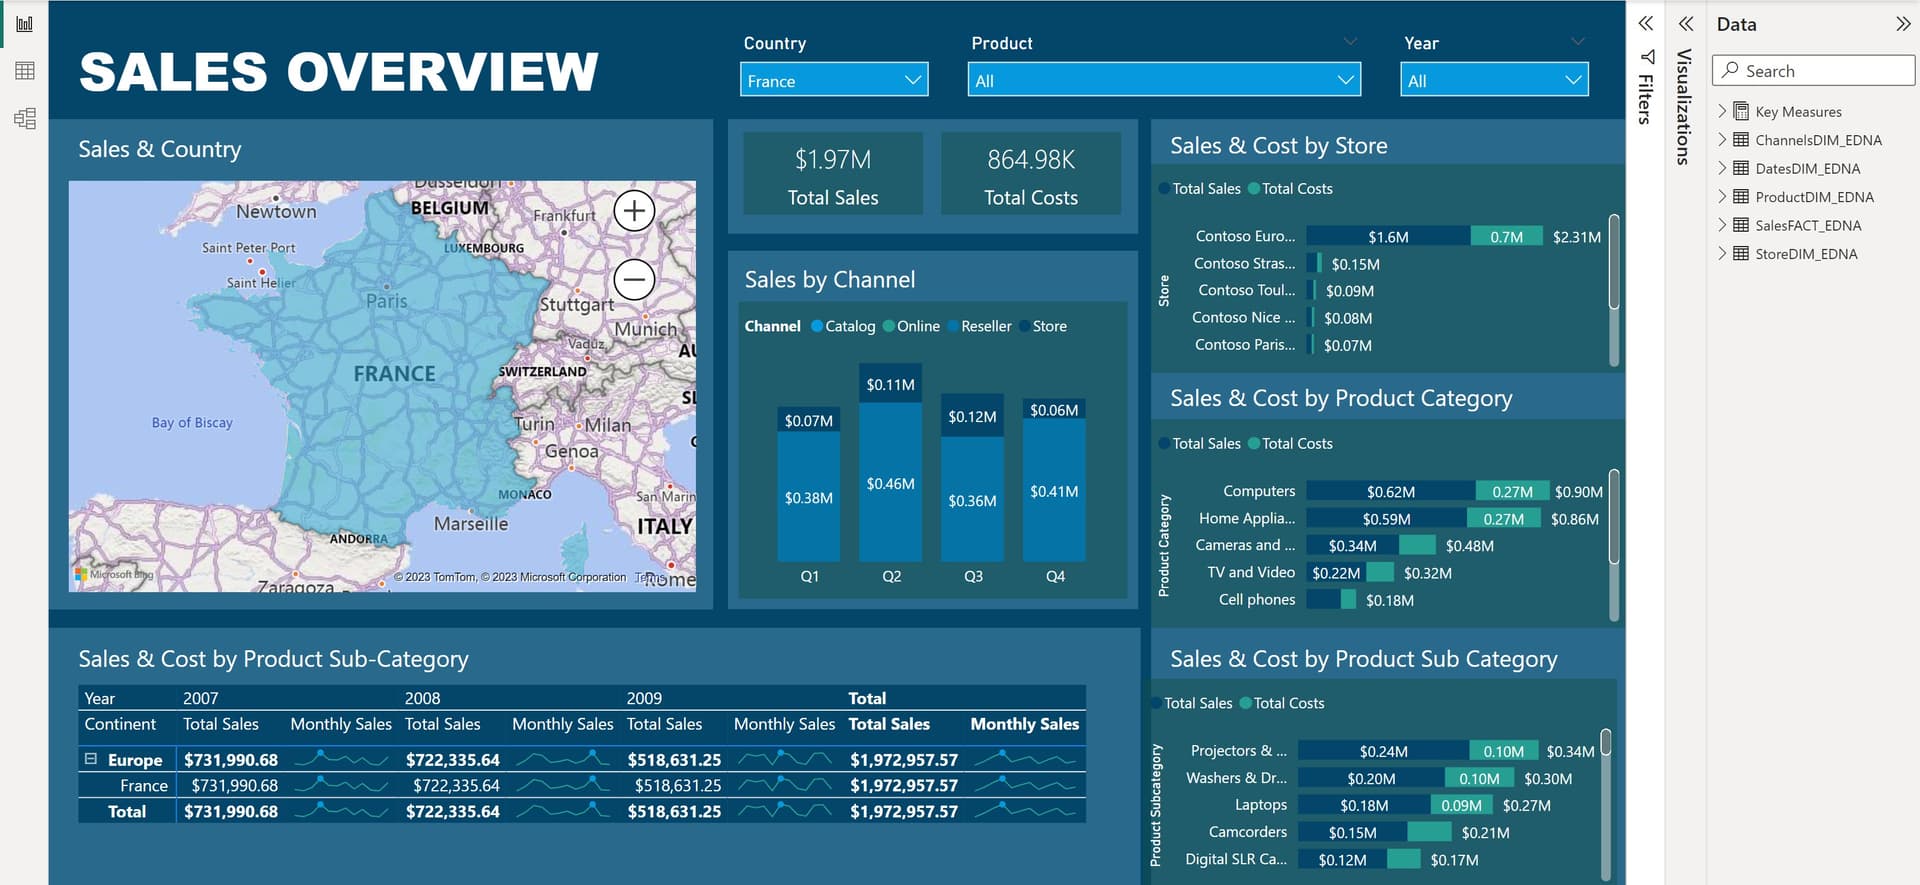
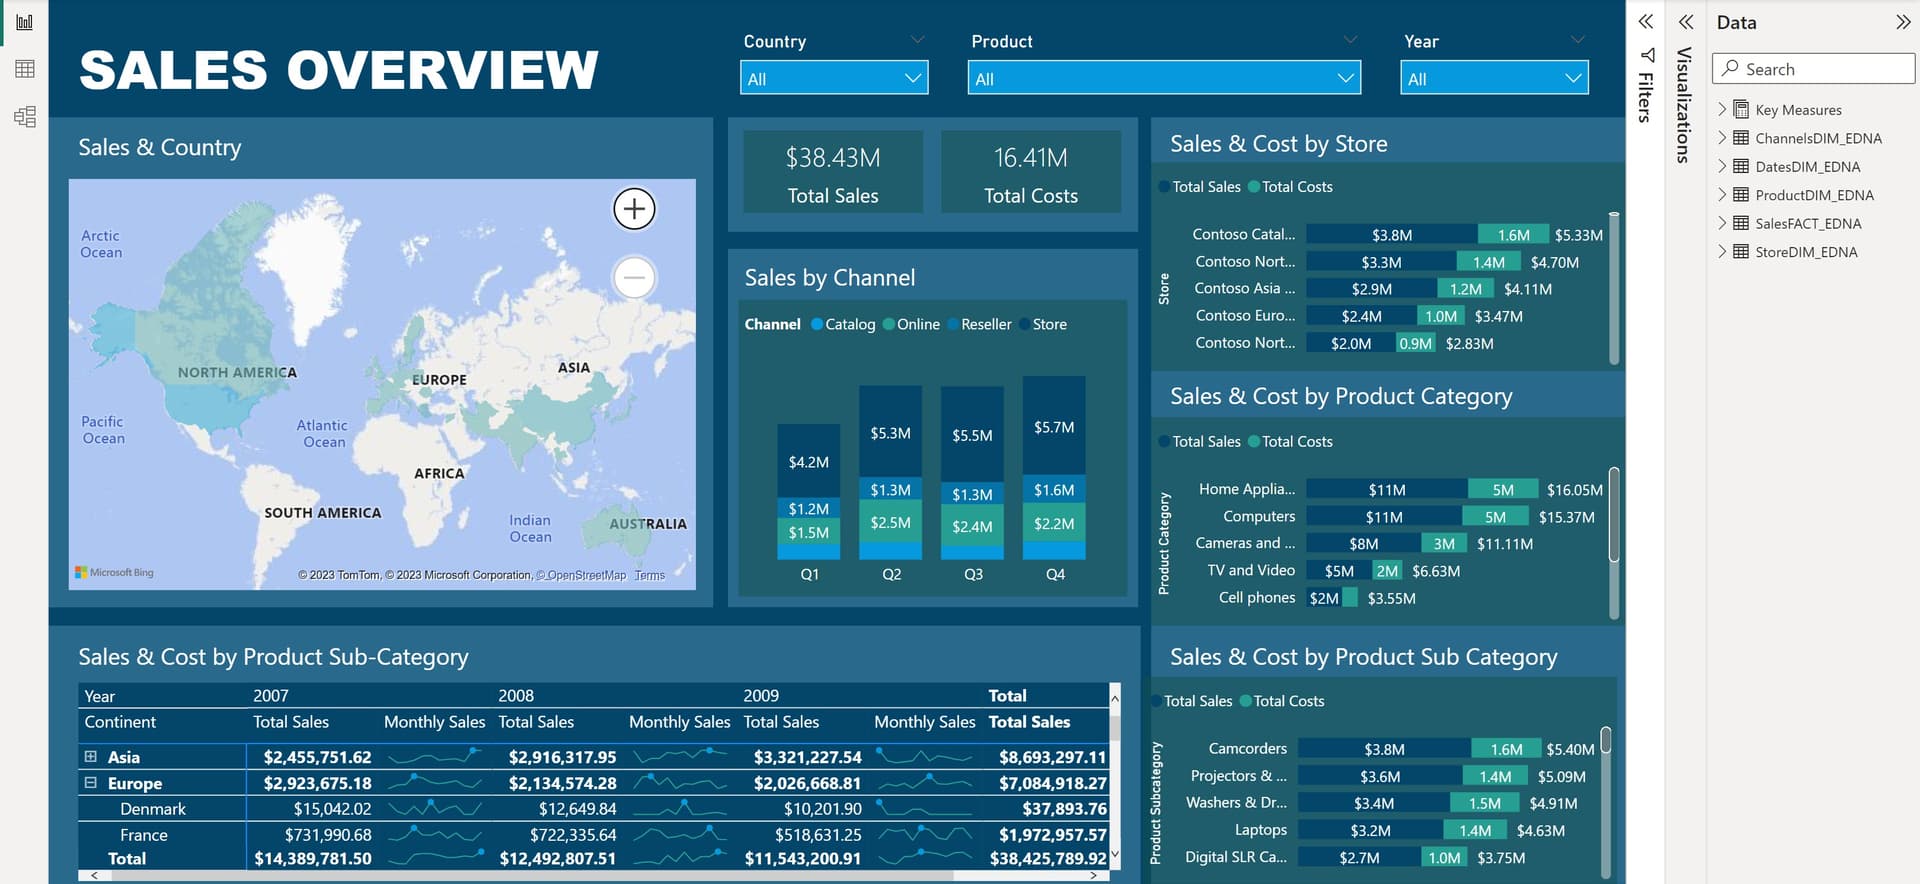
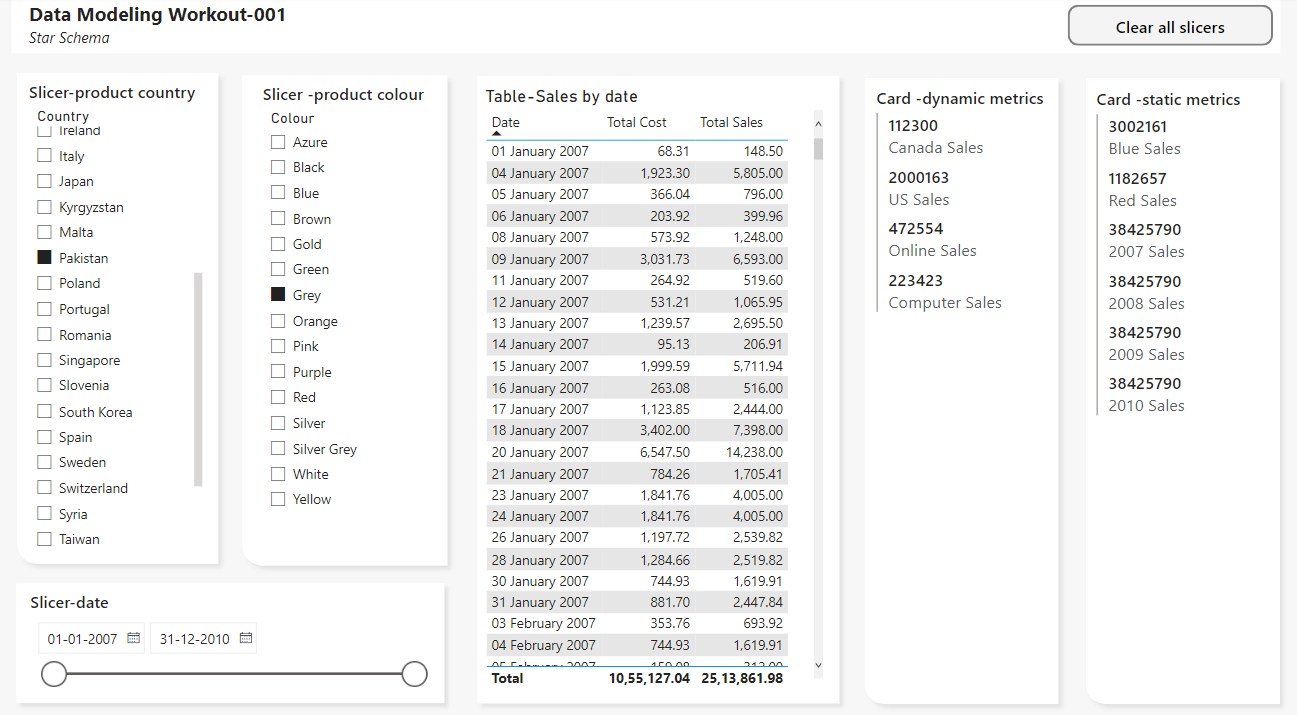
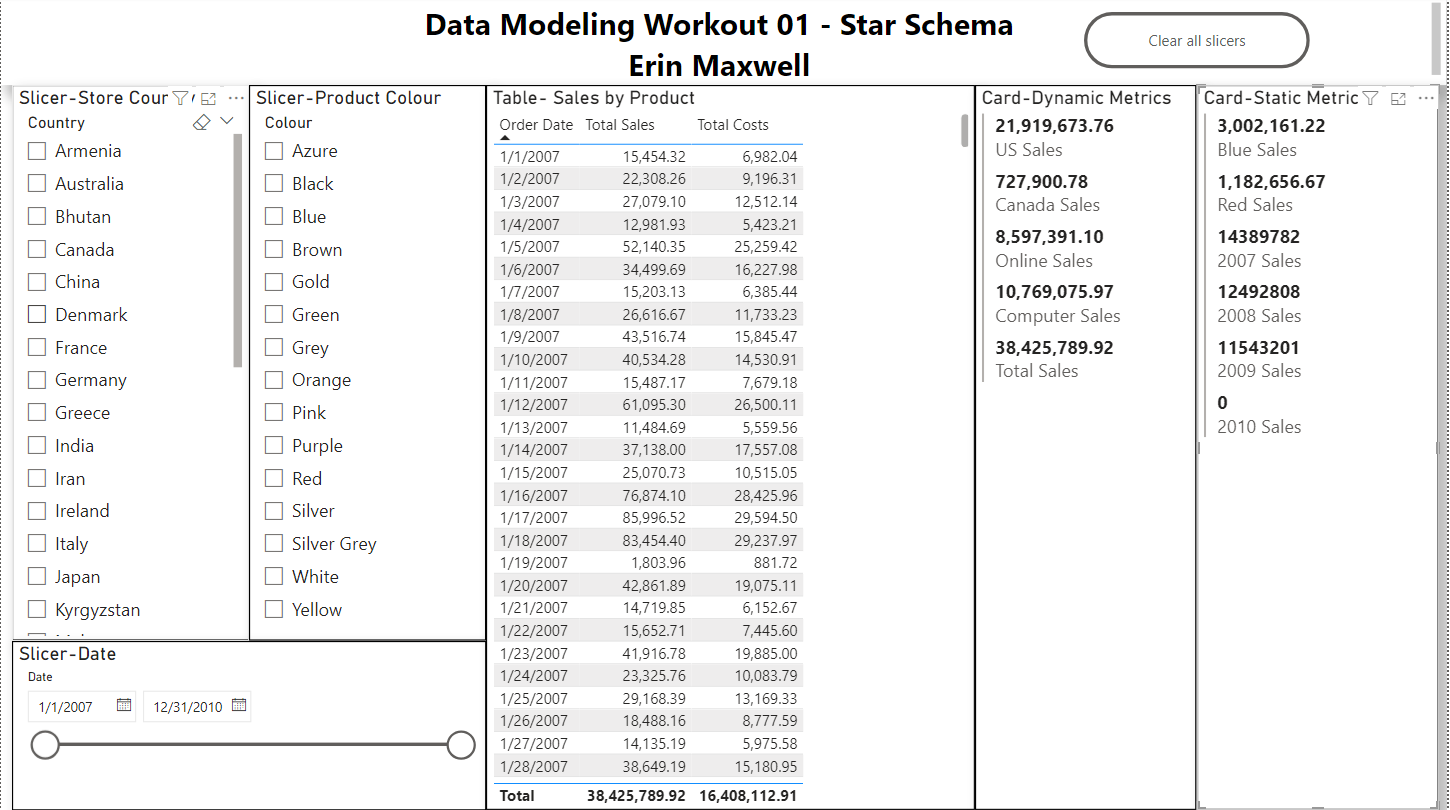
• includes slicers, a table, and cards to showcase the star schema data model “in action” (i.e., while making slicer selections)
Notes
• use only the DAX code provided; do not modify nor create additional measures or calculated columns
• (data source: a 10,000 row subset of the Microsoft [ContosoRetailDW] sample database)
Submission
Using the only the data and DAX files provided, create your solution, and reply to this post. Upload the following:
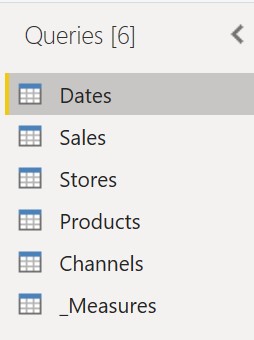
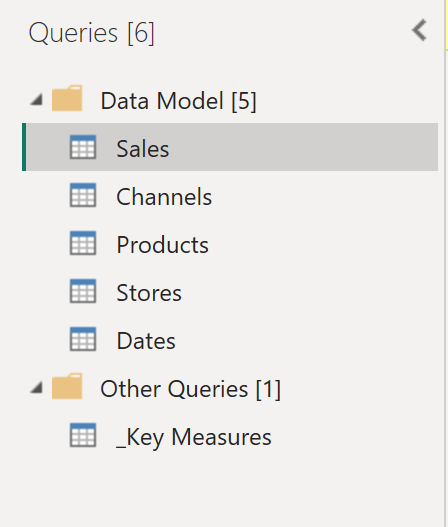
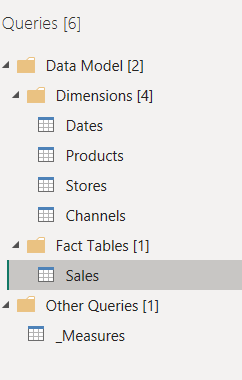
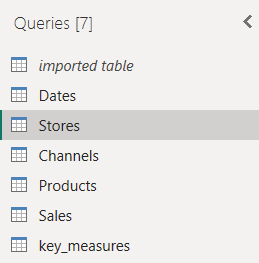
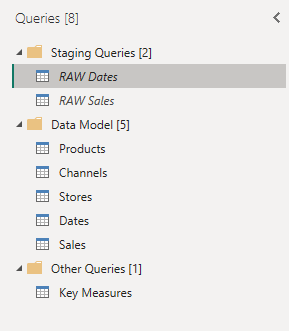
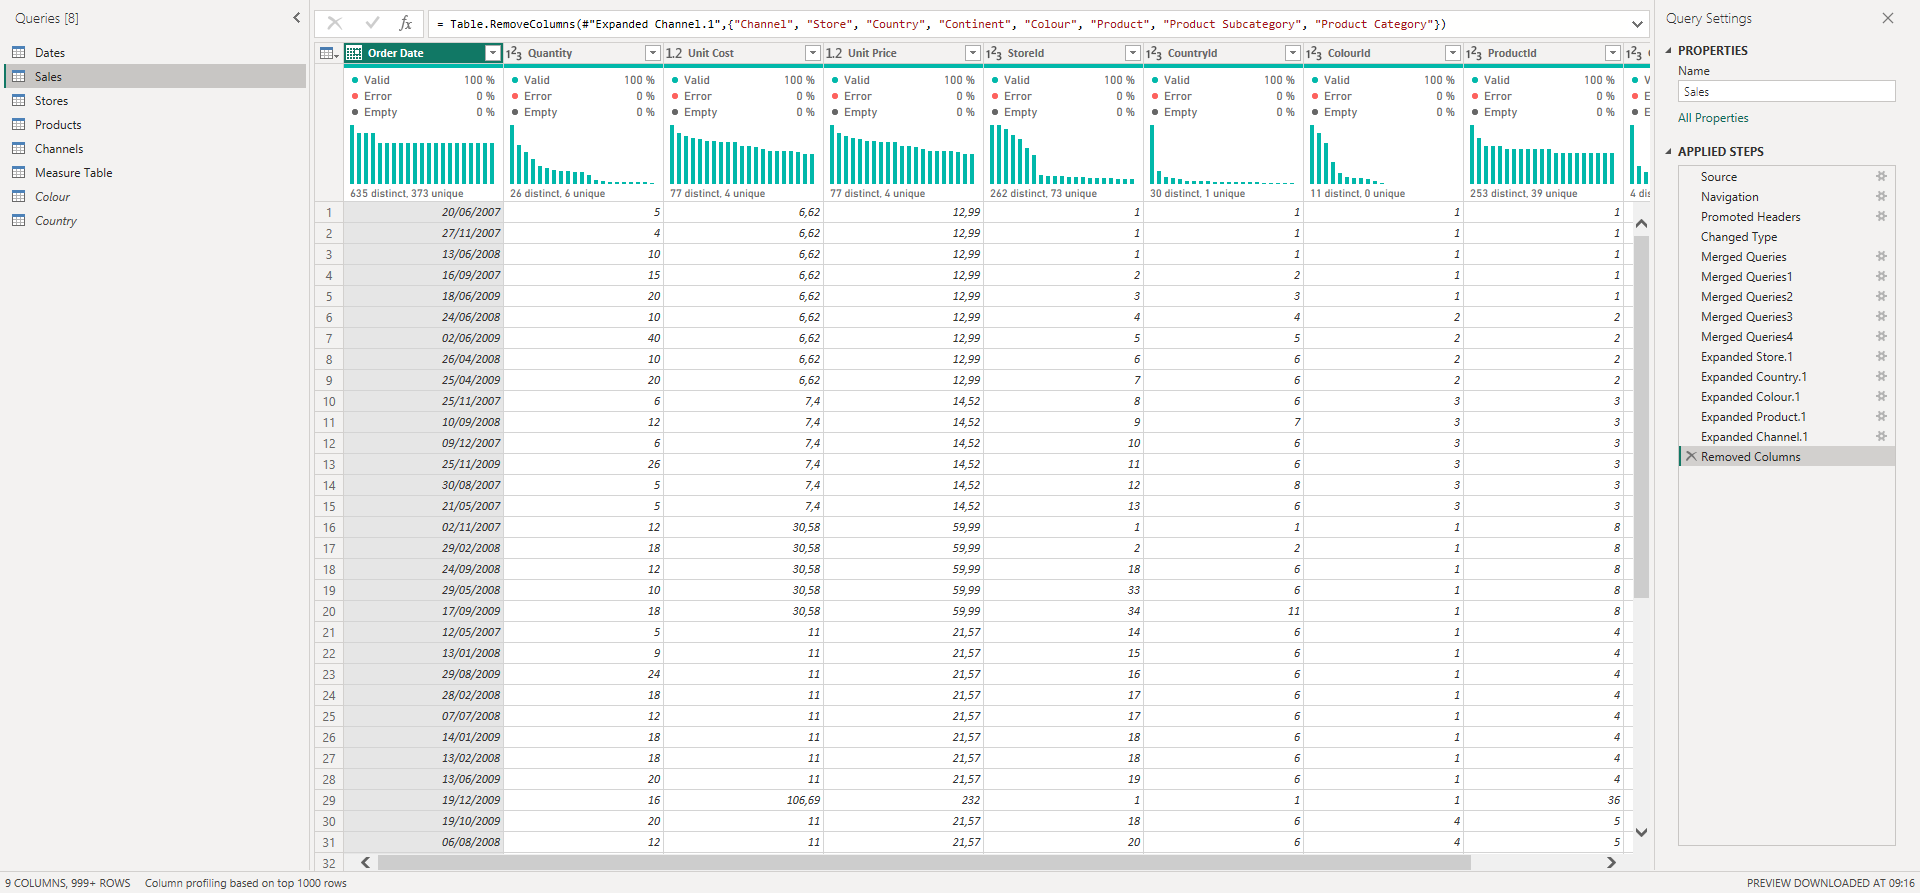
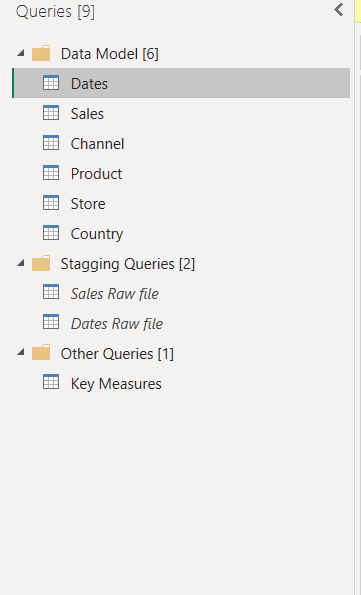
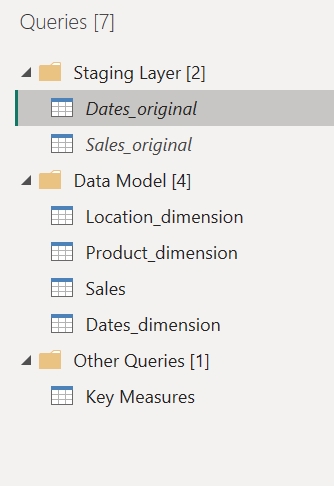
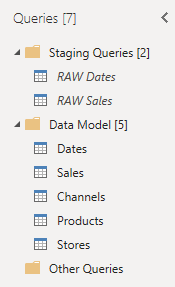
• a screenshot of the queries pane of the [Power Query Editor] with all groups expanded
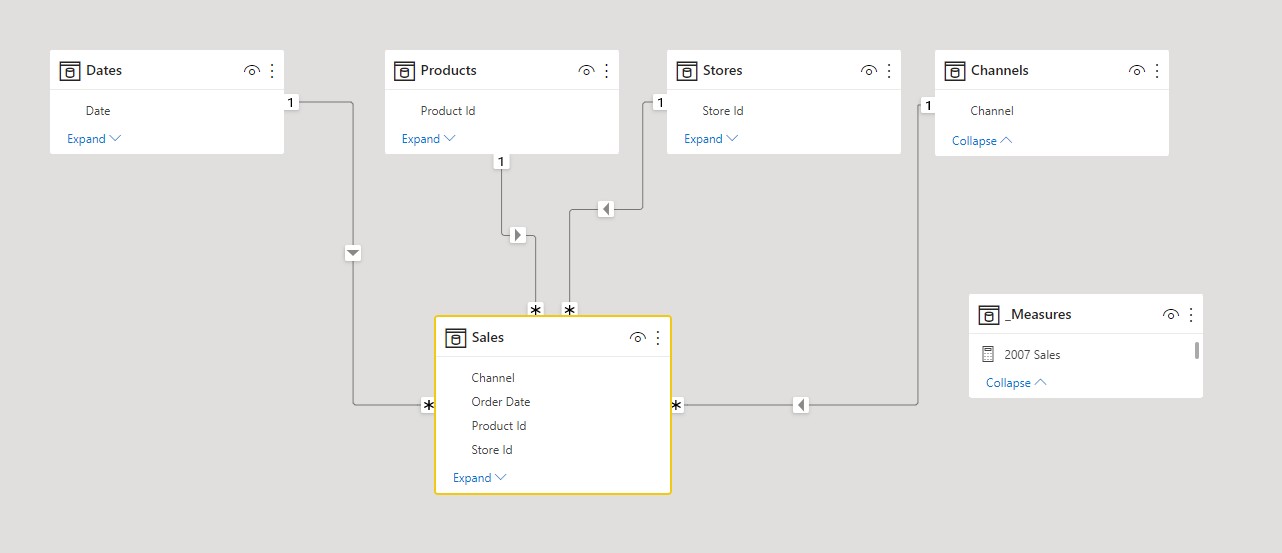
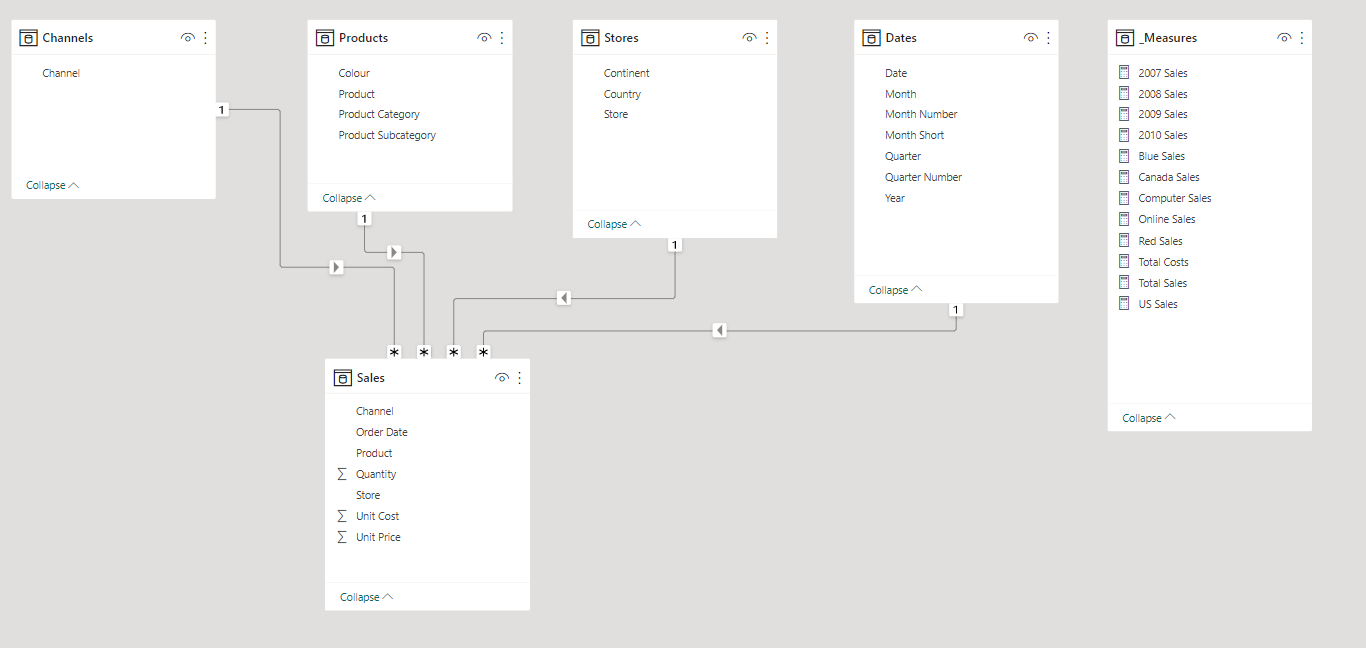
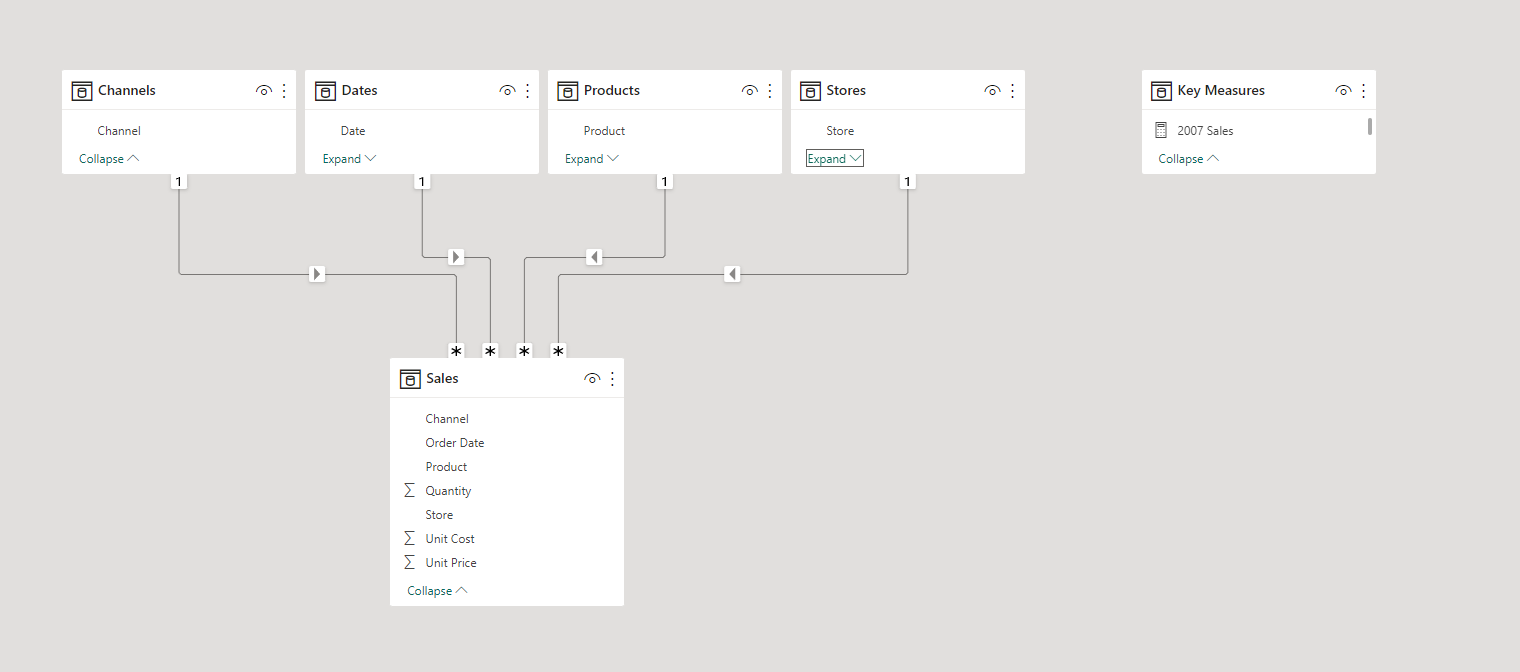
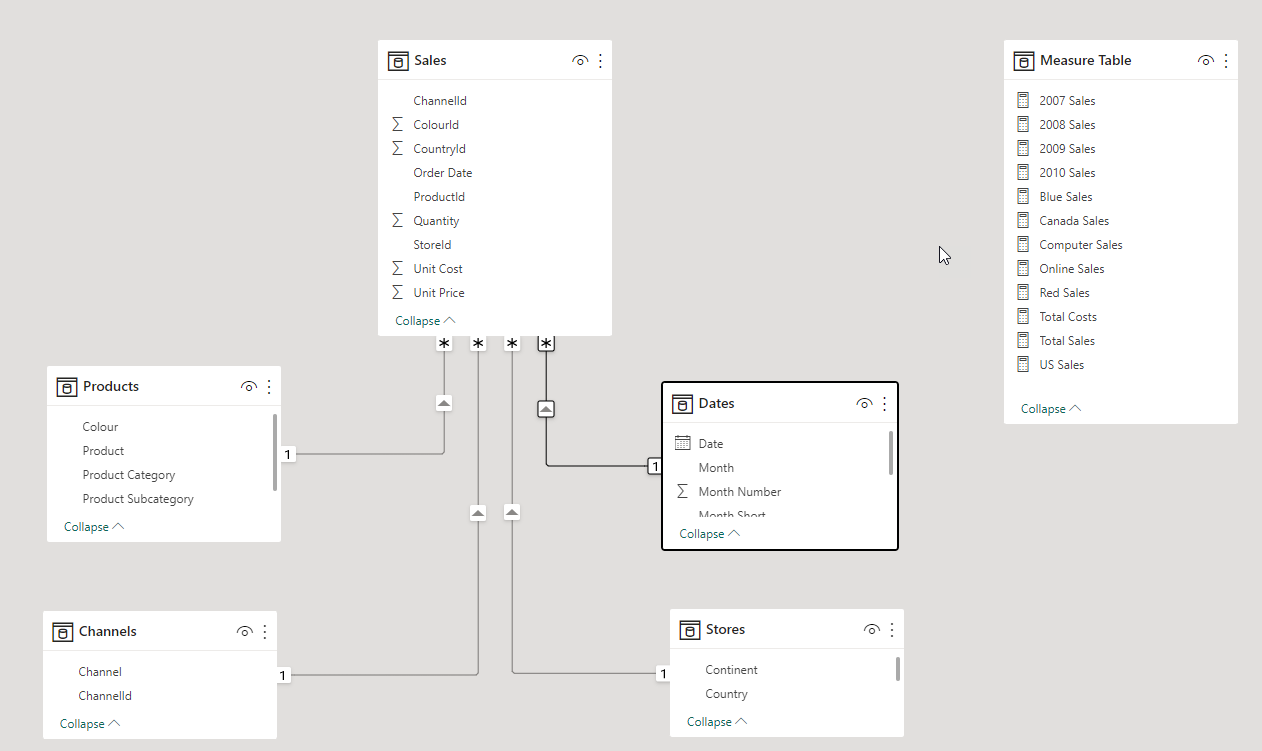
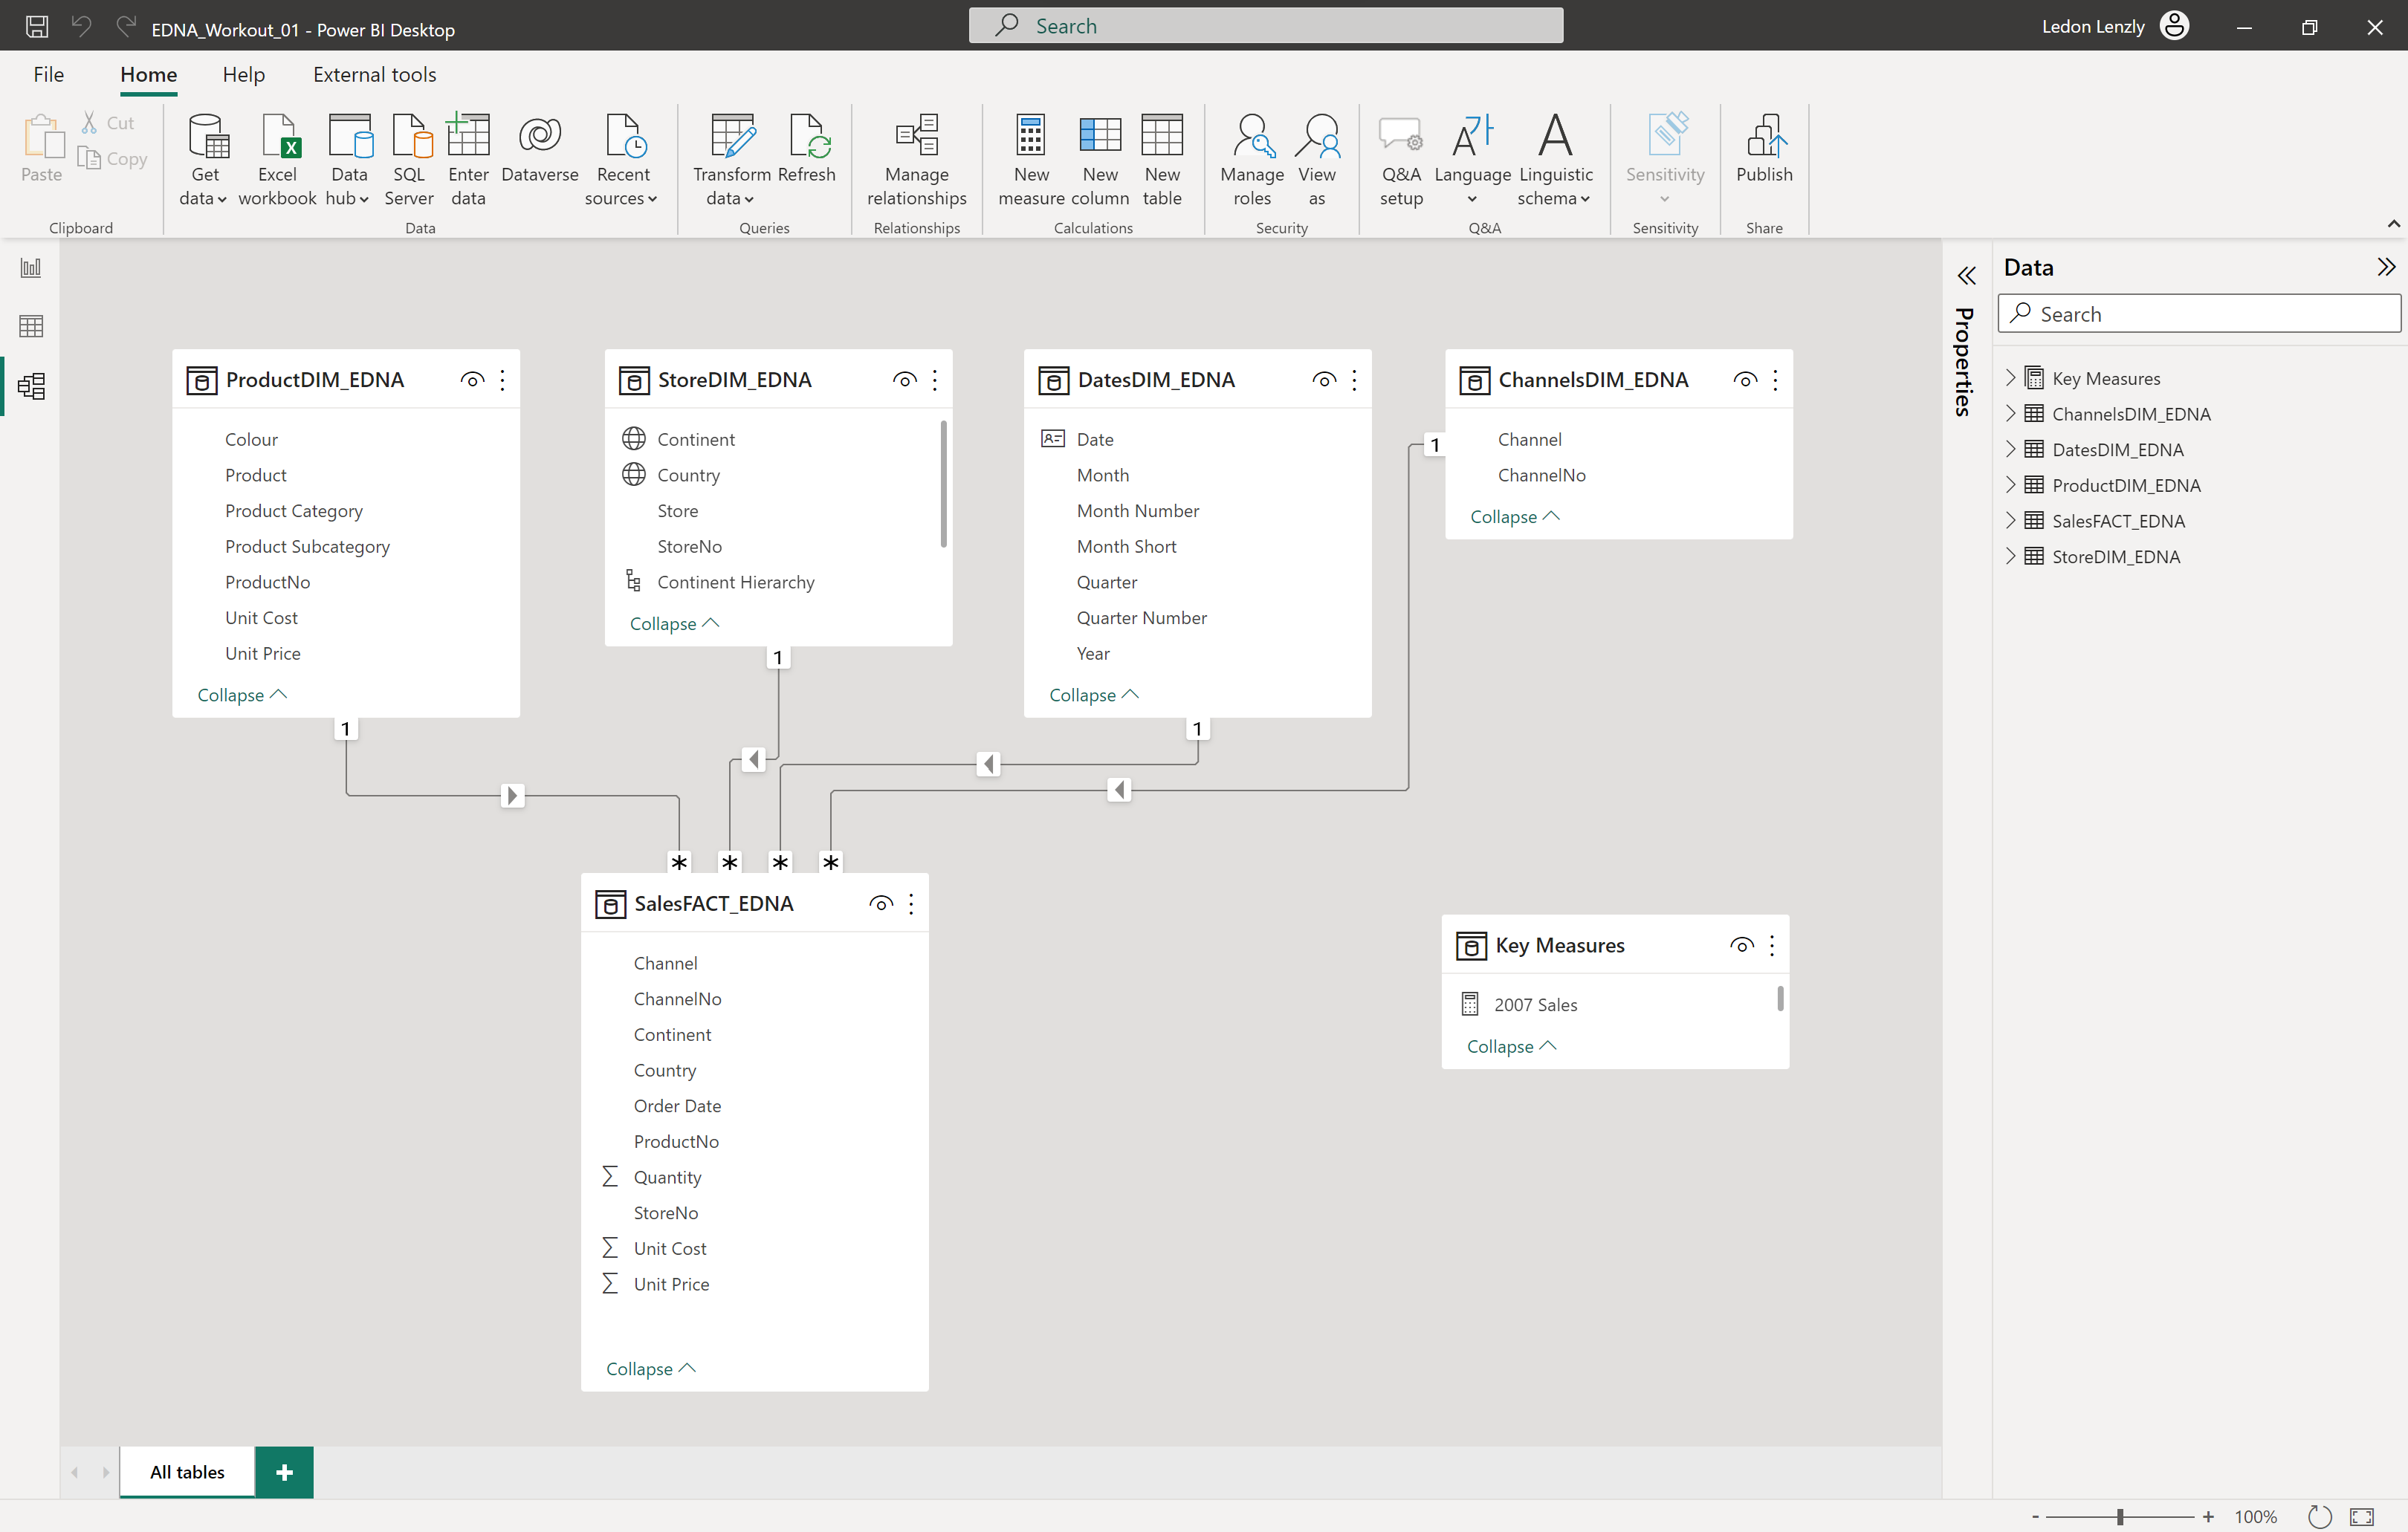
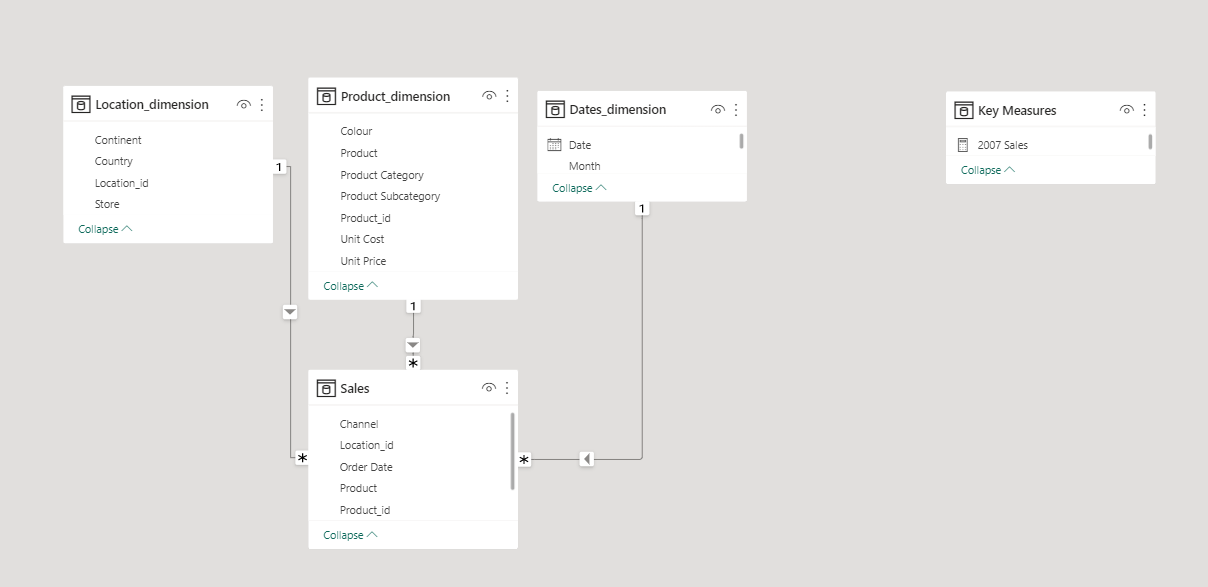
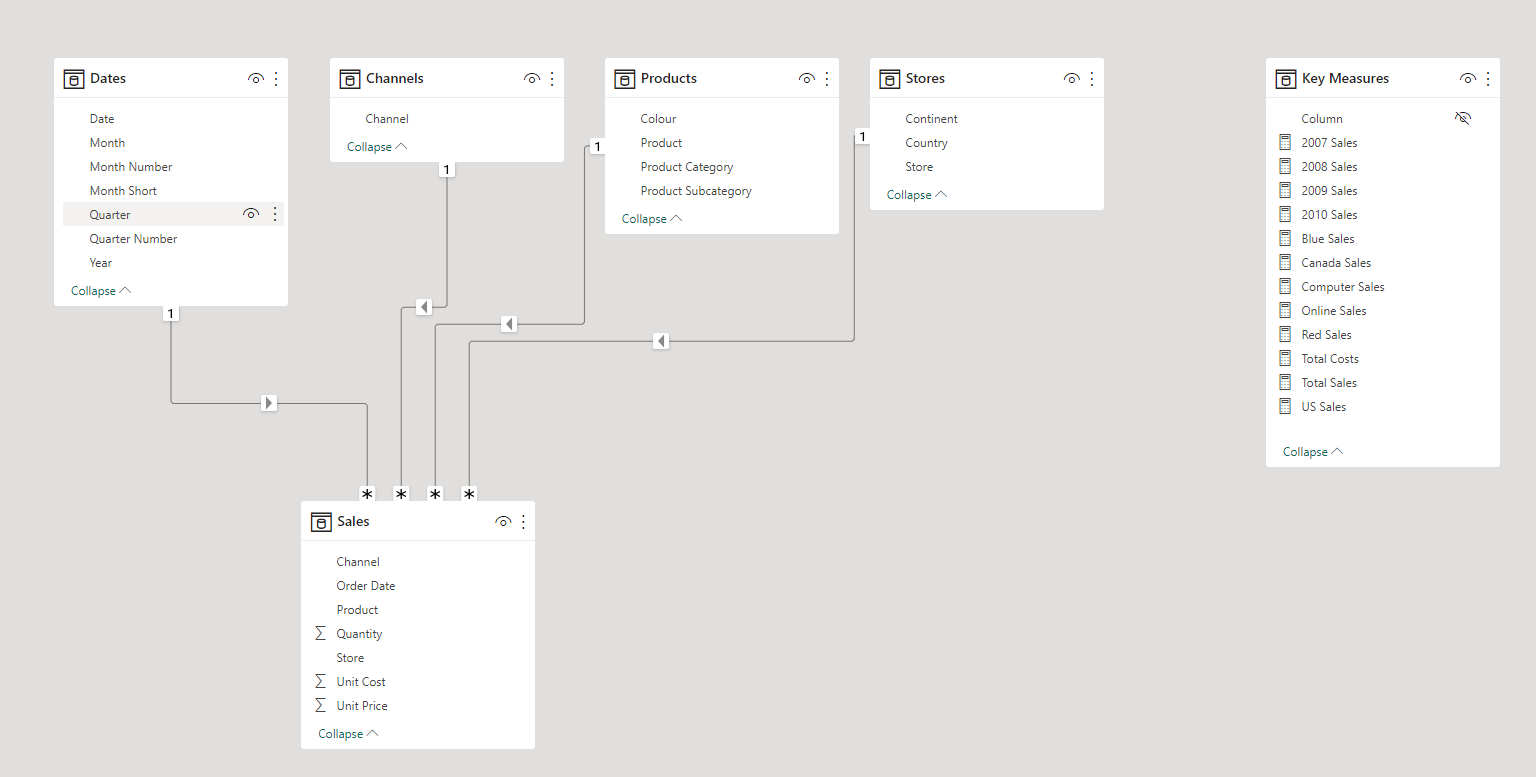
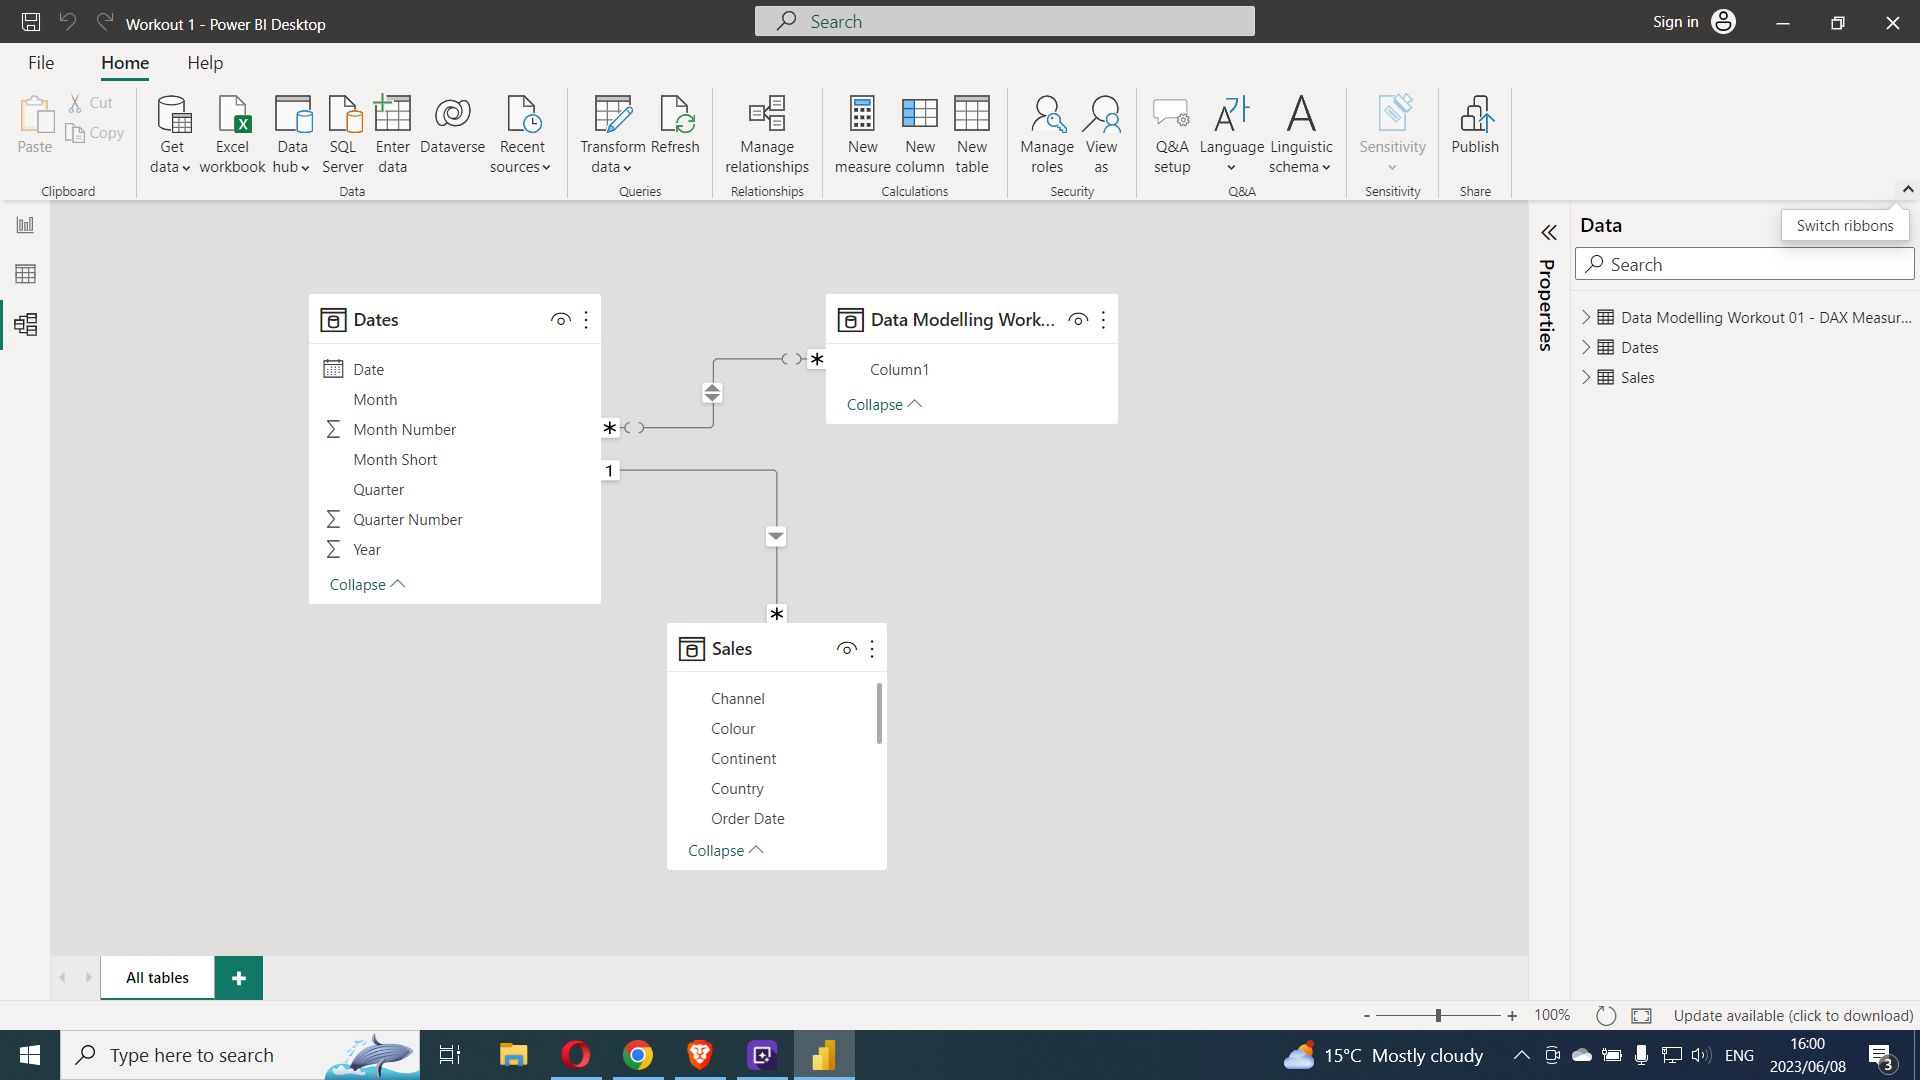
• a screenshot of the star schema data model as displayed in the [Model View]
• an animated GIF (or, alternatively, a set of screenshots) of your Power BI file “in action” (i.e., while making slicer selections)
• your PBIX file
Please blur your screenshots and GIFs or place them in a hidden section.
Here’s the notes I kept during the development of my solution to this workout.
Pre-Modelling Activities - General:
• create new, empty PBIX
• use File\Options\Options and settings\Global\Data Load\Time intelligence to ensure Auto Date/time for new files is disabled
• use File\Options\Options and settings\Current File\Data Load\Time intelligence to ensure Auto Date/time is disabled
• use File\Options\Options and settings\Current File\Data Load\Relationships to ensure Autodetect new relationships after data is loaded is disabled
• use File\Options\Options and settings\Current File\Data Load\Relationships to ensure Import relationships from data sources on first load is disabled
Pre-Modelling Activities - Data Loading:
• load raw sales data from [Sales] tab of the Data Excel file
• load raw dates data from [Dates] tab of the Data Excel file
Modelling Activities - Power Query:
• rename sales query to [RAW Sales] and un-select Enable load
• rename dates query to [RAW Dates] and un-select Enable load
• create [Staging Queries] group and move [RAW Sales] and [RAW Dates] queries into this group
• create [Dates] query by referencing the [RAW Dates] query
• create [Data Model] group and move [Dates] query into this group
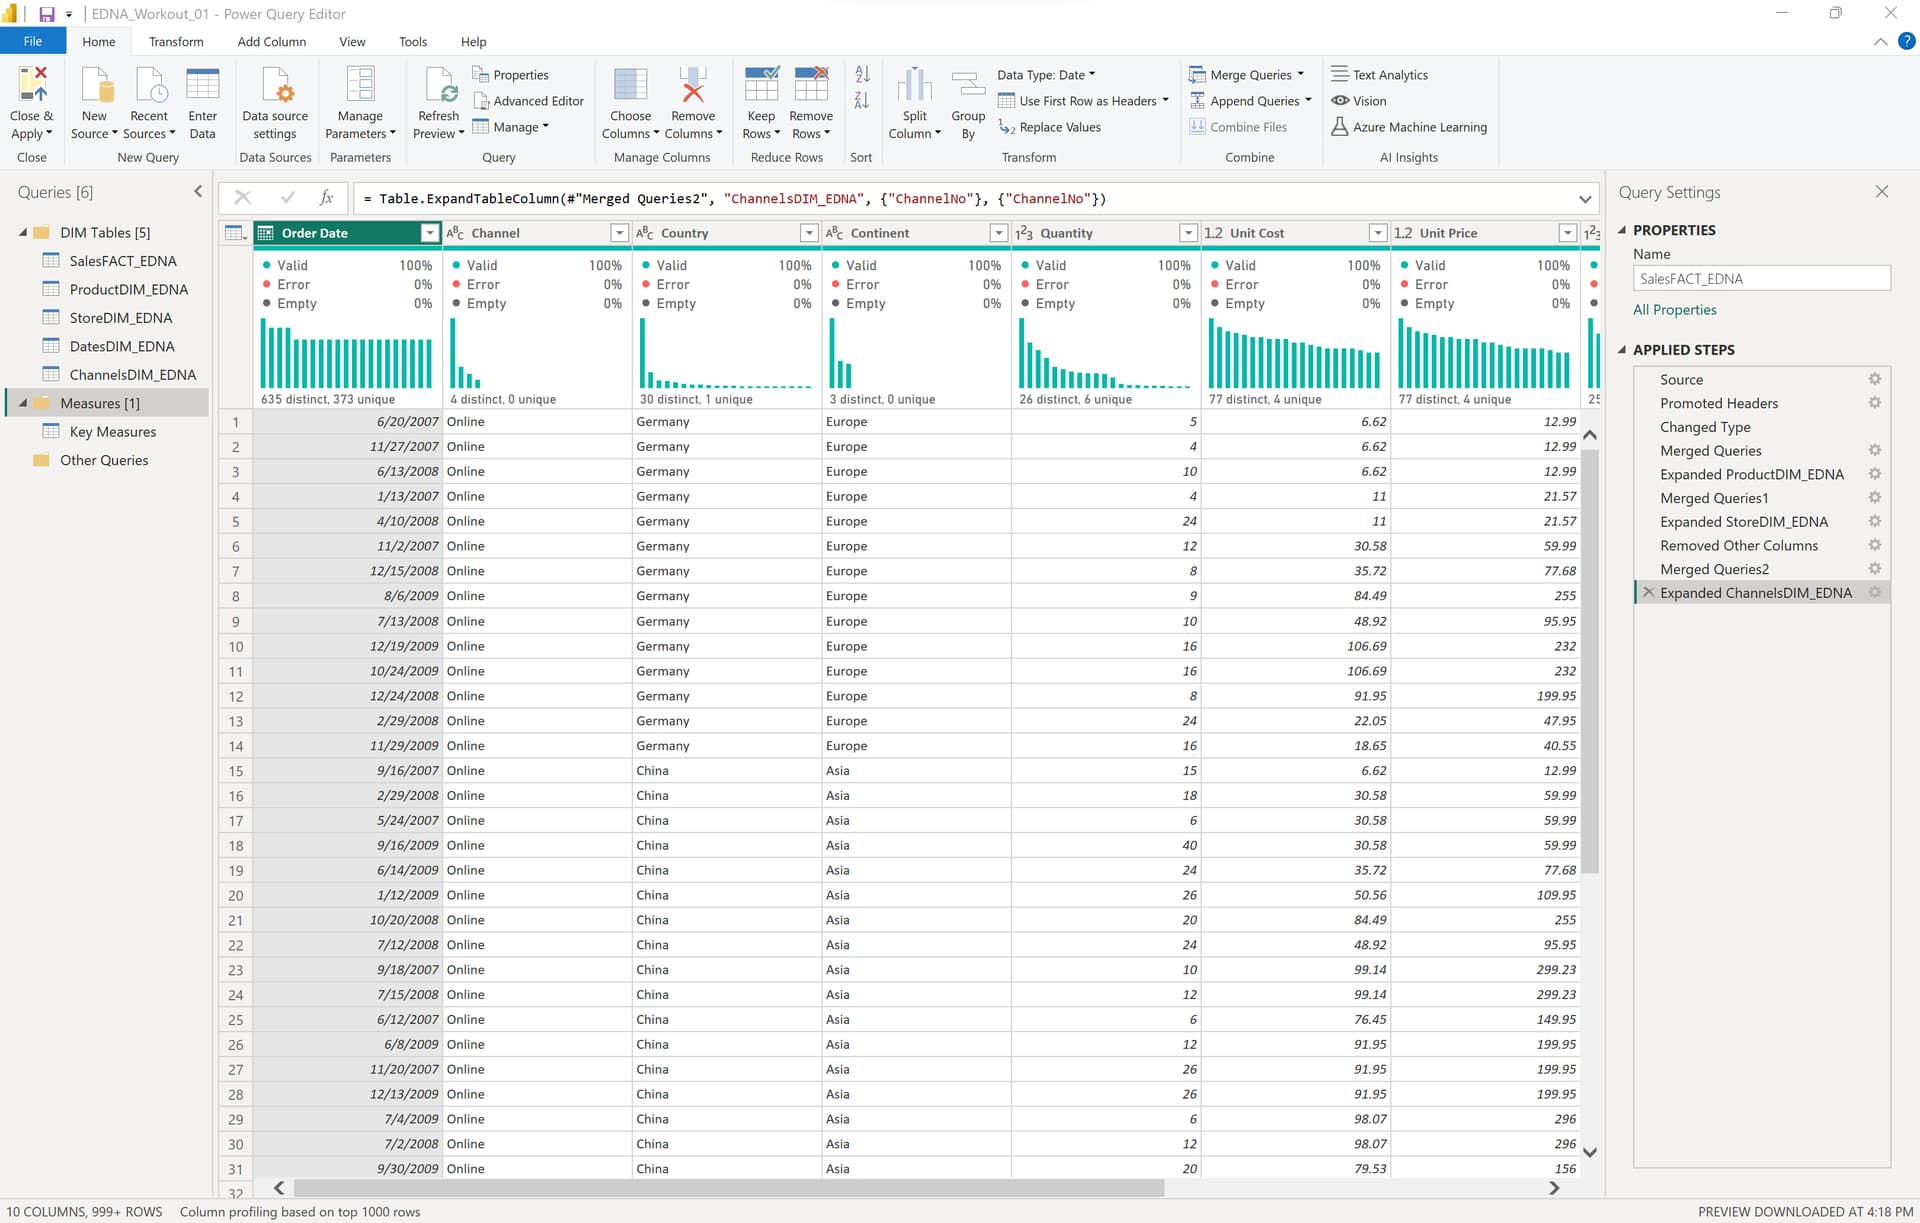
• create [Sales] query by referencing the [RAW Sales] query
• right-click on [Country] and [Continent] columns, select Remove Columns
• right-click on [Colour], [Product Subcategory], and [Product Category] columns, select Remove Columns
• create [Channels] query by referencing the [RAW Sales] query; move into [Data Model] group
• right-click on [Channel] column, select Remove Other Columns, select Remove Duplicates
• create [Products] query by referencing the [RAW Sales] query; move into [Data Model] group
• select [Colour], [Product], [Product Subcategory], and [Product Category] columns, right-click on one of them, select Remove Other Columns
• select all columns, right-click and select Remove Duplicates
• create [Stores] query by referencing the [RAW Sales] query; move into [Data Model] group
• select [Store], [Country], and [Continent] columns, right-click on one of them, select Remove Other Columns
• select all columns, right-click and select Remove Duplicates
• move [Dates], [Channels], [Products], and [Stores] tables to top row; these are my Dimension tables
• (not at all necessary, but I like to always place my [Dates] table in the top-left corner so its in the same place in every model; helps me to ensure I don’t miss it)
• move [Sales] table to row below dimensions; this is my Fact table
• if there are any relationships the were “automatically” created by Power BI, right-click and delete them
• use the Manage Relationships dialog and select New; in the Create Relationship dialog, select the source table and column and the target table and column, creating relationship for:
• Dates[Date] → Sales[Order Date]
• Channels[Channel] → Sales[Channel]
• Products[Product} → Sales[Product]
• Stores[Store] → Sales[Store]
• for all relationships, ensure the Cardinality is set to Many to one (asterisk:1) and the Cross filter direction is set to Single; adjust if necessary
• create a [Key Measures] table using Enter data icon on the toolbar
• create a new measure for each entry in the DAX Measures text file
Post-Modelling Activities - Visualizations:
• create slicers for Stores[Country], Products[Colour] and Dates[Date] columns
• create a table for the Sales[Order Date] column and the [Total Sales] and [Total Costs] measures
• (not at all necessary, but I like to always set the format of date columns (in this case, Dates[Date] and Sales[Order Date]) to dd-mmm-yyyy to avoid confusion with dates that are just numeric)
My submissions. thanks. i have a question though. I started to create a colour and a country tables do reduce even more the model but it creates a snowflake. is that good or bad?
Thanks for participating! Good question about further normalization of dimension tables to snowflake schema. Generally speaking, in Power BI it’s best to stop at the star schema and not continue to higher order normalization.
Disadvantages of snowflake schema relative to start schema:
DAX usually becomes more complicated due to more complex filter context Slicers become much more difficult to synch properly Performance may decrease due to have to traverse longer paths Cannot create heirarchies across multiple dimension tables
This question was actually the focus of Data Modeling Workout 003, in which you had to denormalize a snowflake schema INTO a star schema.
Nice and easy workout. Thanks for setting this up!
One could argue about a Geography table or combining the Store/Channel in one. IMHO even on simple models there are always things to argue about.
One thing I don’t understand is why in your solution file you didn’t clean up the Sales fact table.
In Power Query I added the index keys to my fact Sales table and then removed all the columns I modelled out to the dim tables. I was surprised you kept them all in. Slip of the pen or on purpose?
Hi @Johnny. It was on purpose … the intent was to take “baby steps” in data modelling issues … the clean-up is covered in subsequent data modelling workouts (we’re on #5 now …).
Greg
OK, fair, if it’s meant as a step-by-step teaching workout, I better understand the proposed solution.
I am a bit late to the party, but will try to catch up and join in!
Hello everyone,
Here is my submission for Data modeling workout-001. @Greg@BrianJ really enjoyed this workout and it will be really helpful in real time as well.