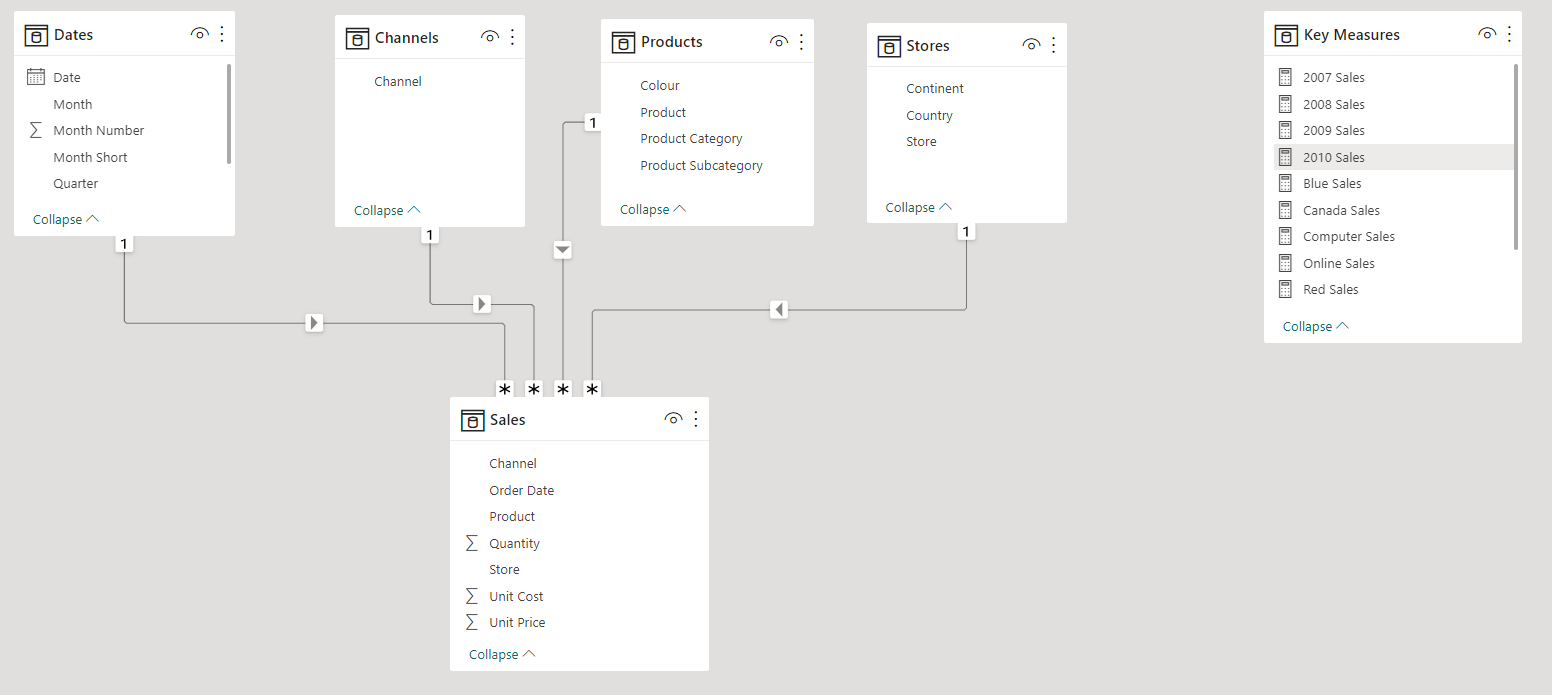
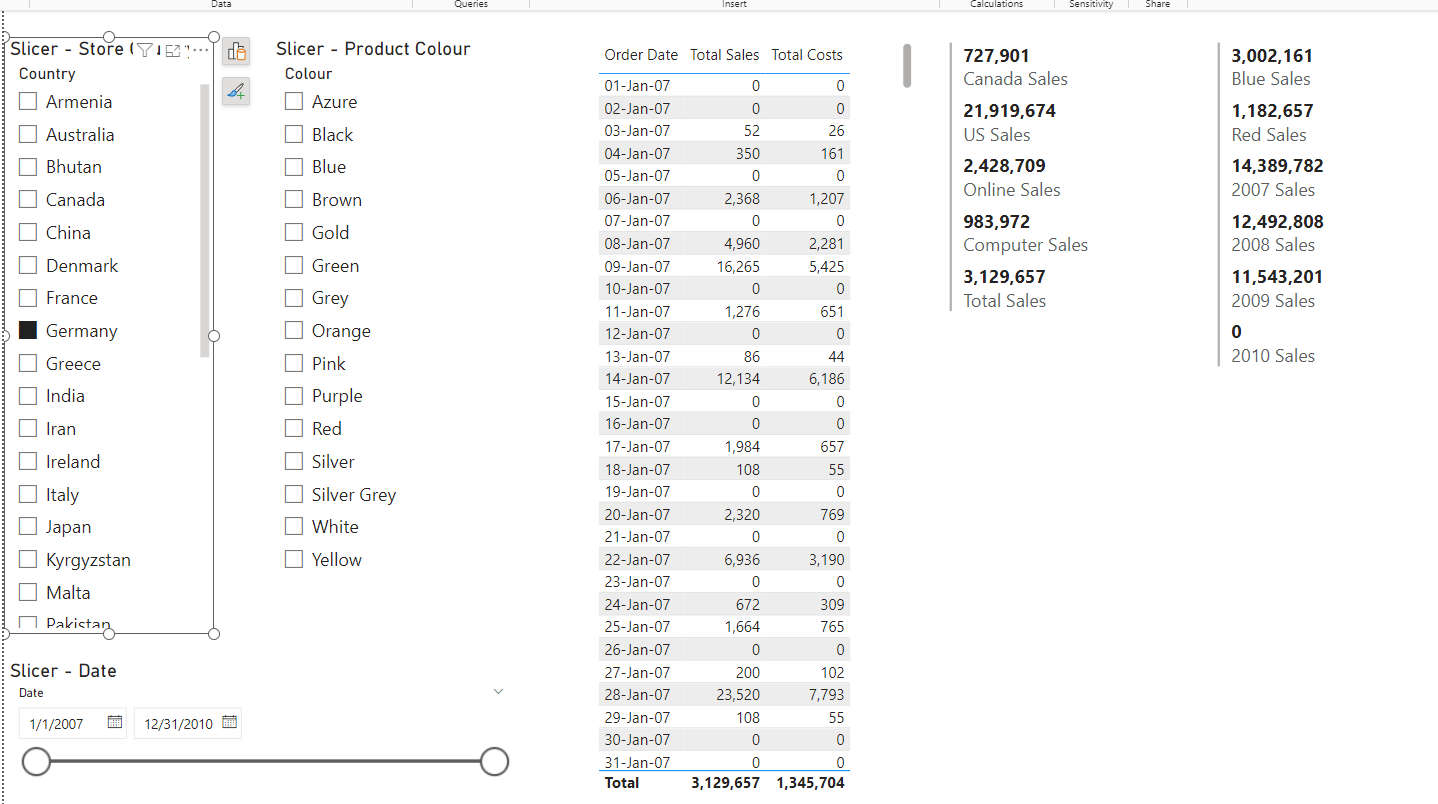
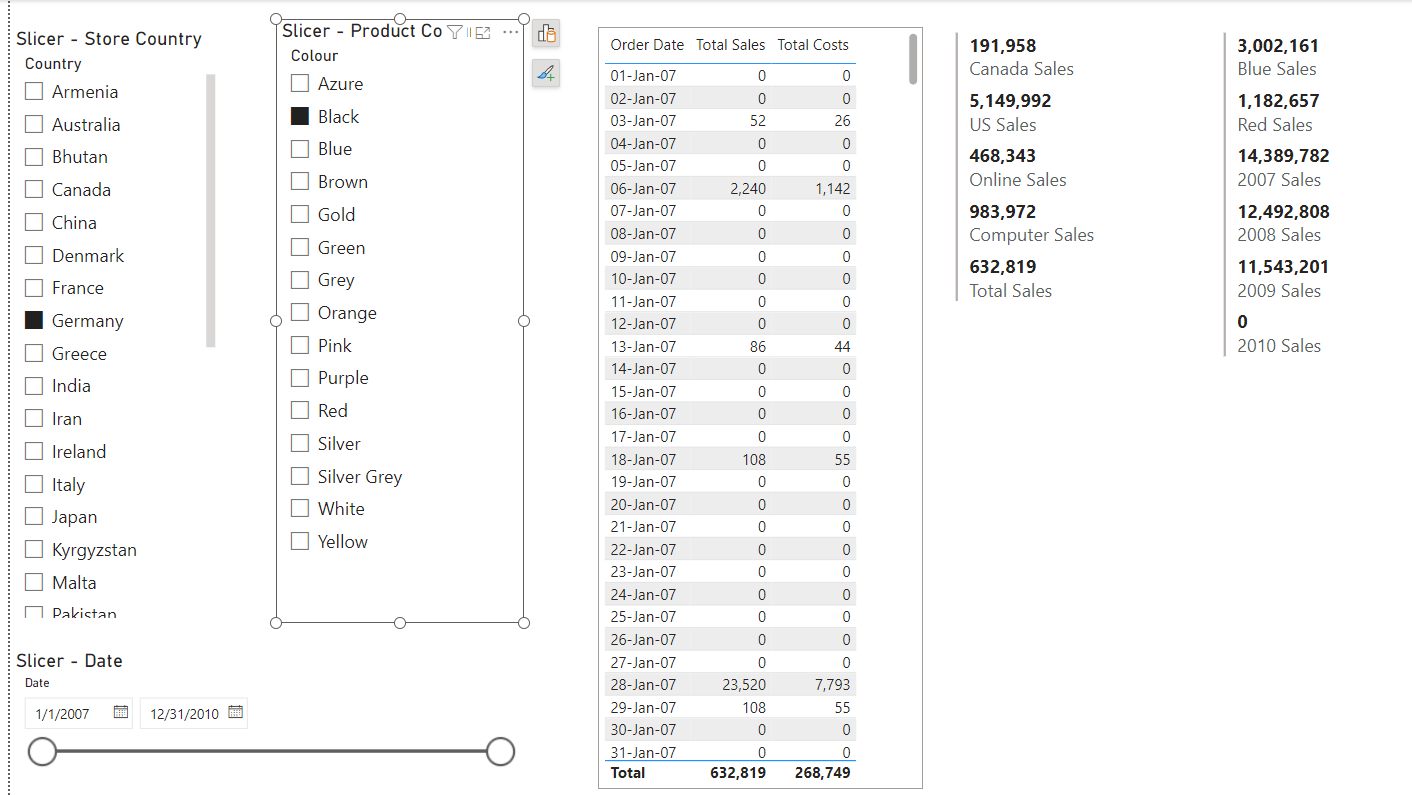
Total Sales =
SUMX( Sales,
Sales[Quantity] * Sales[Unit Price] ) + 0
Total Costs =
SUMX( Sales,
Sales[Quantity] * Sales[Unit Cost] ) + 0
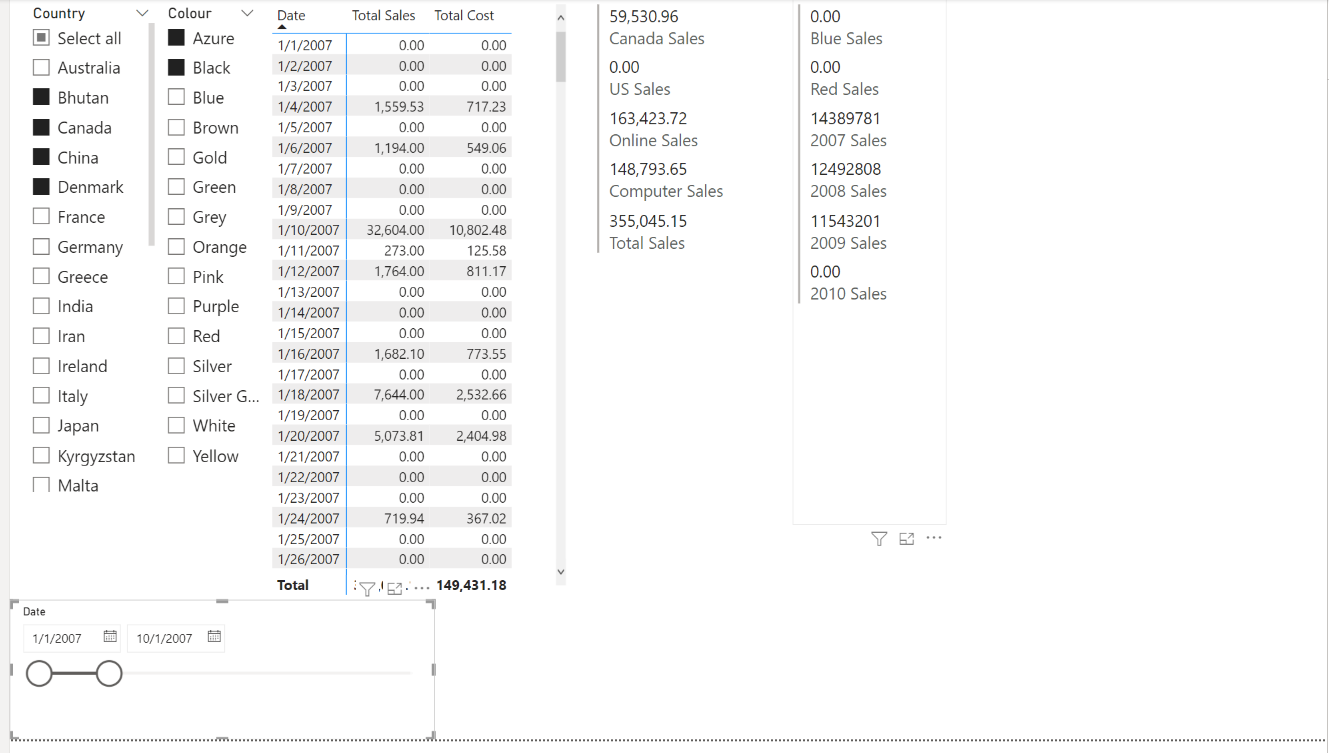
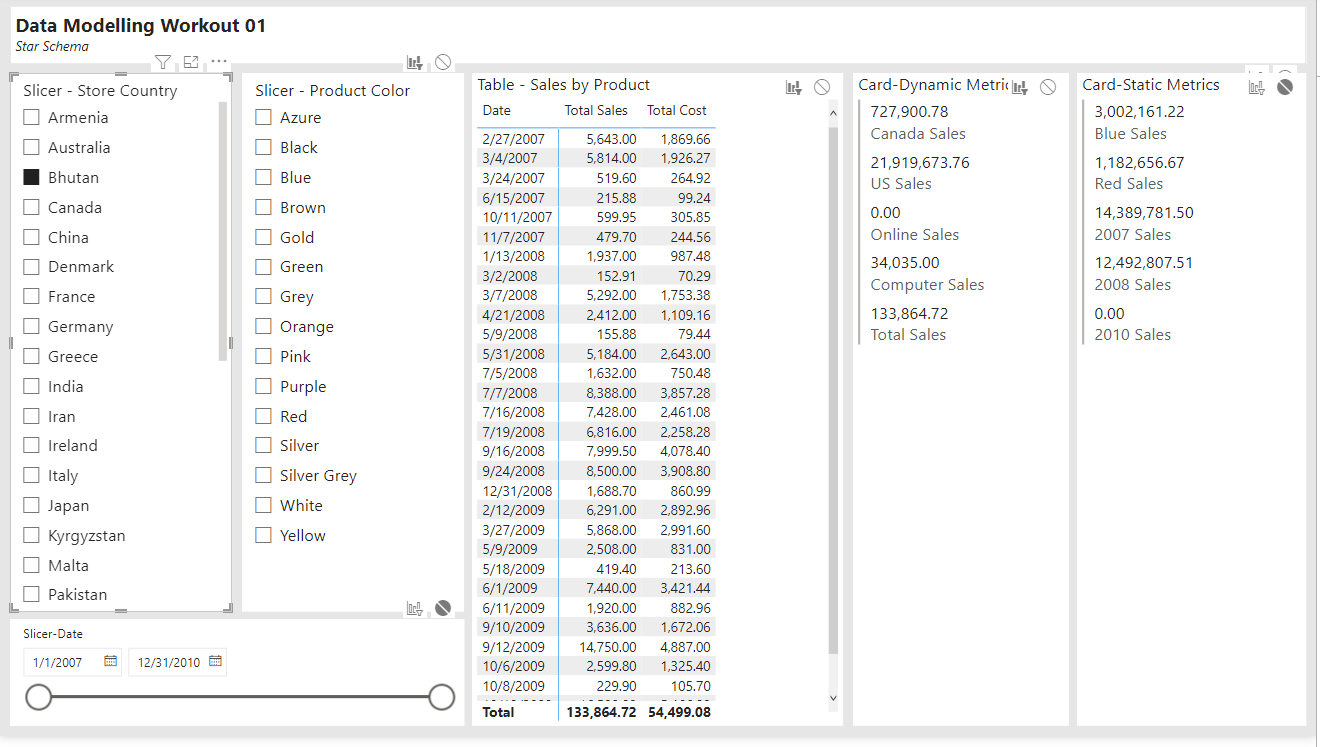
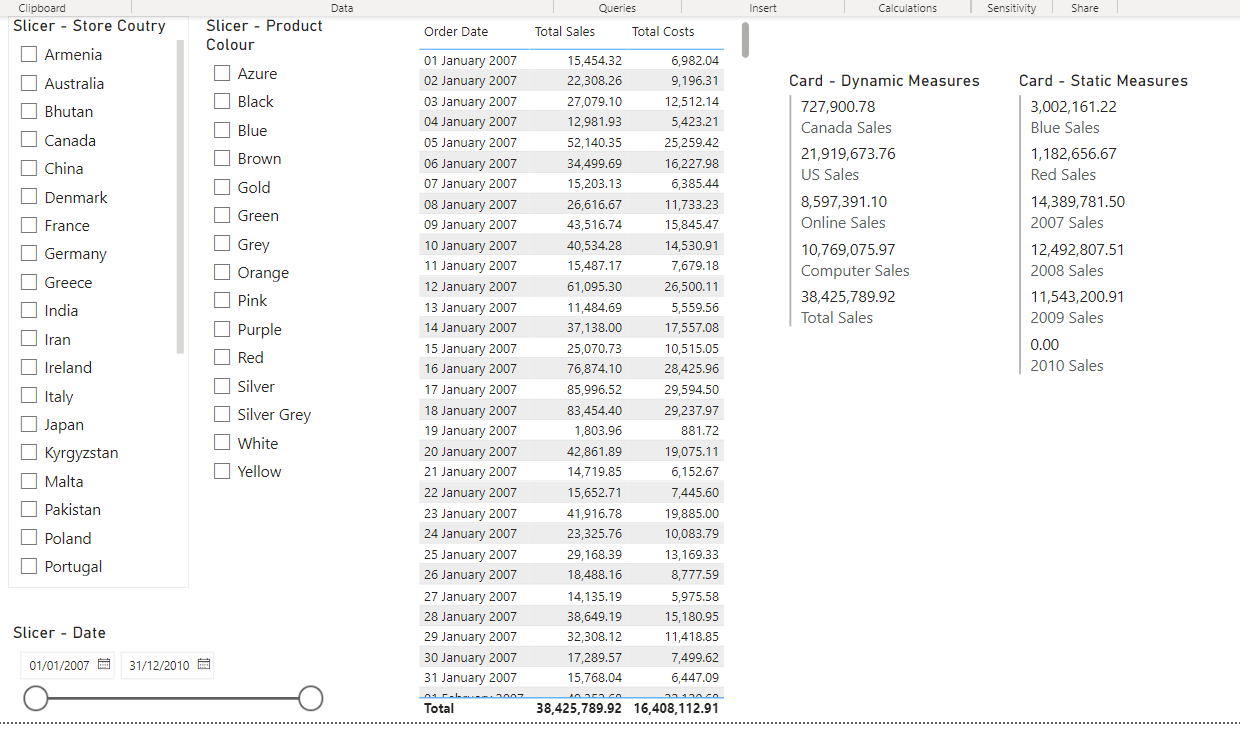
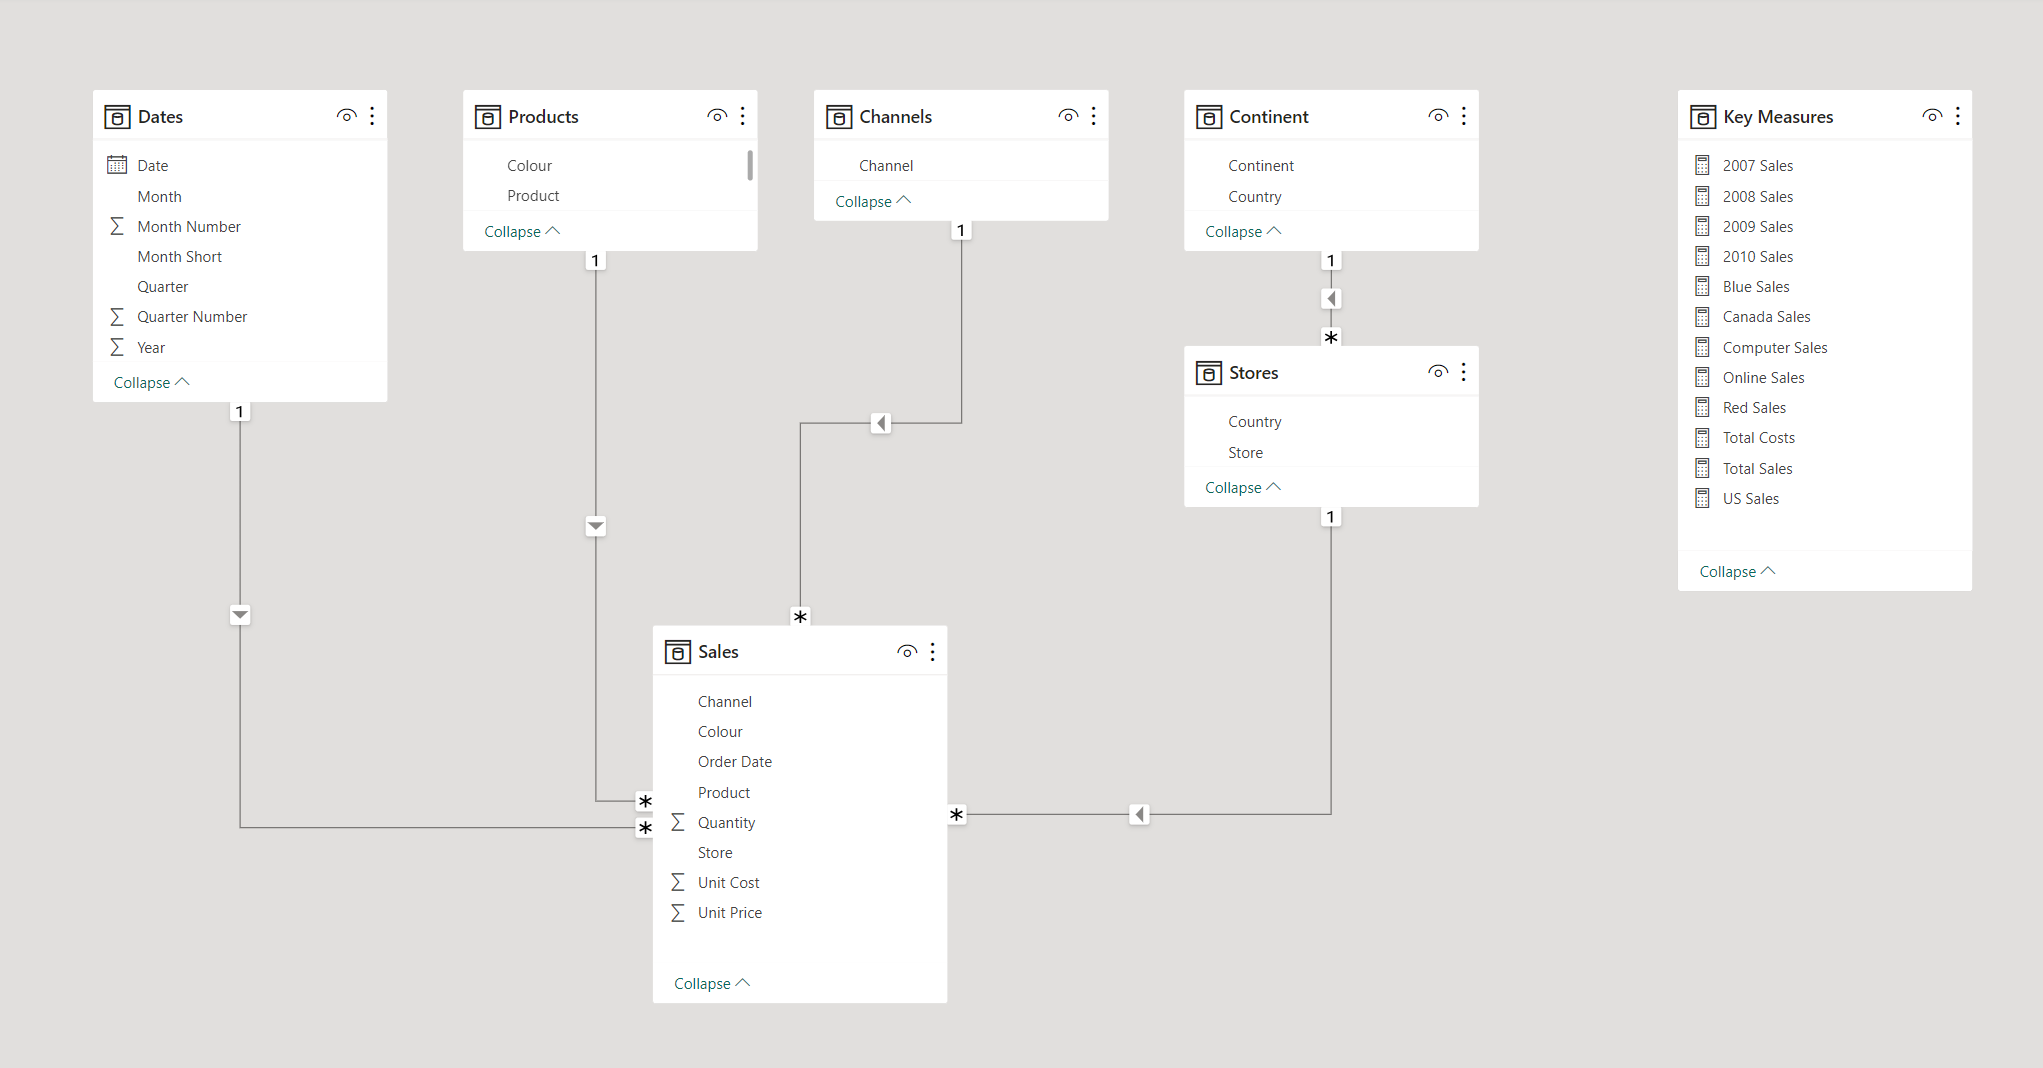
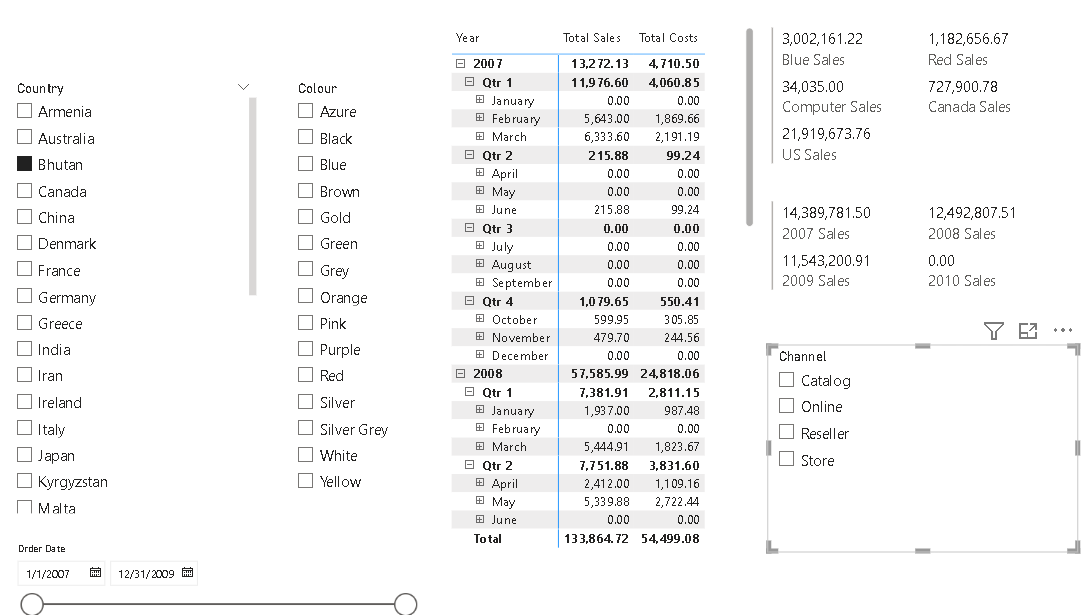
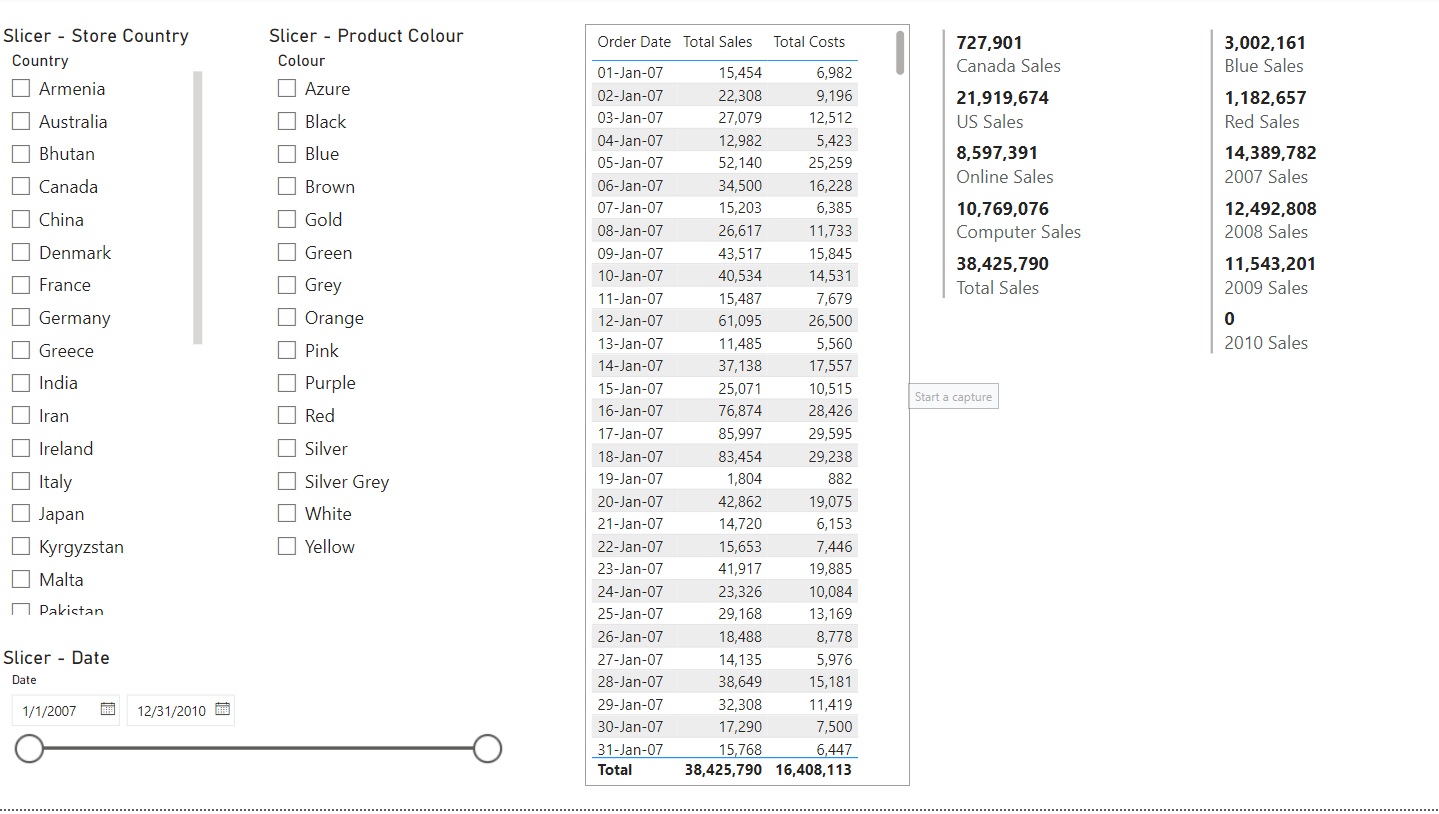
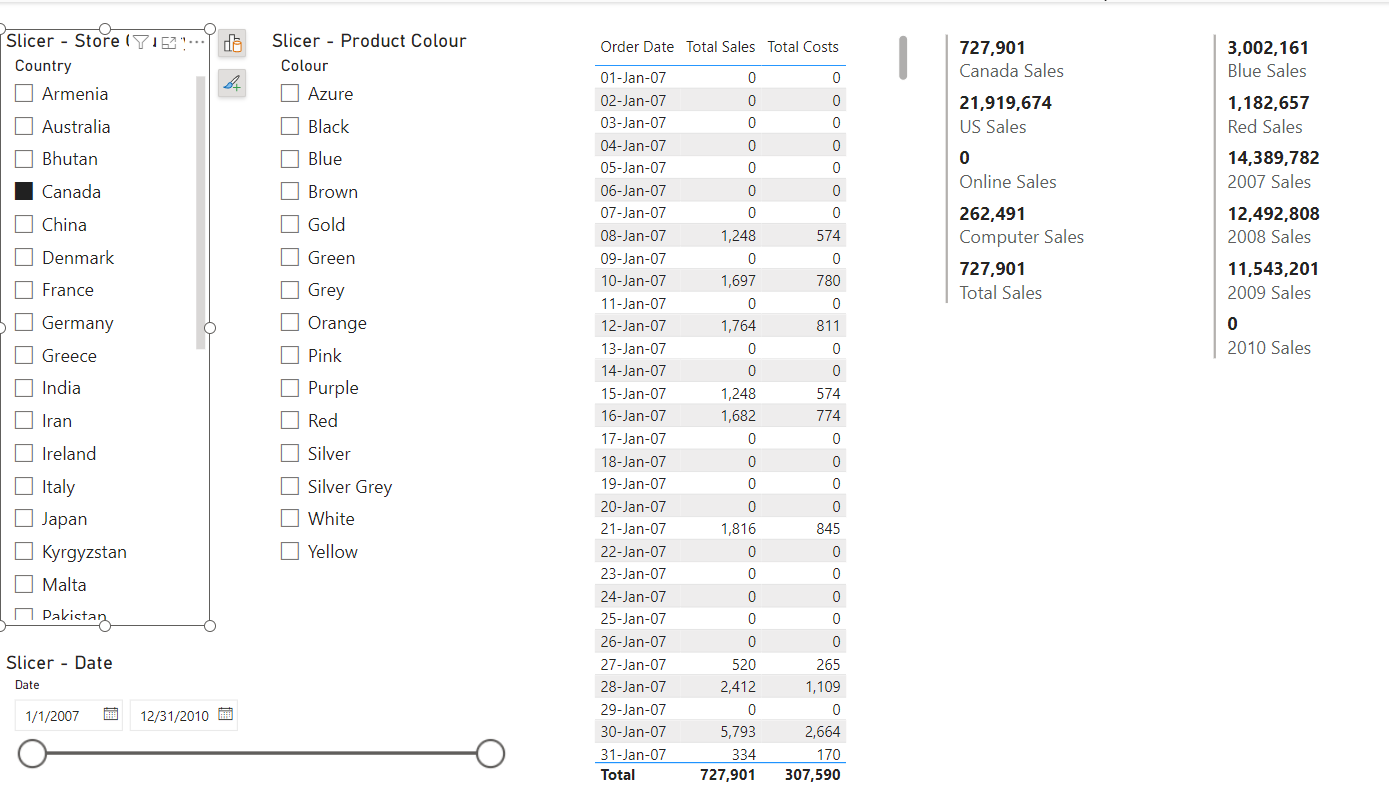
Canada Sales =
CALCULATE(
[Total Sales],
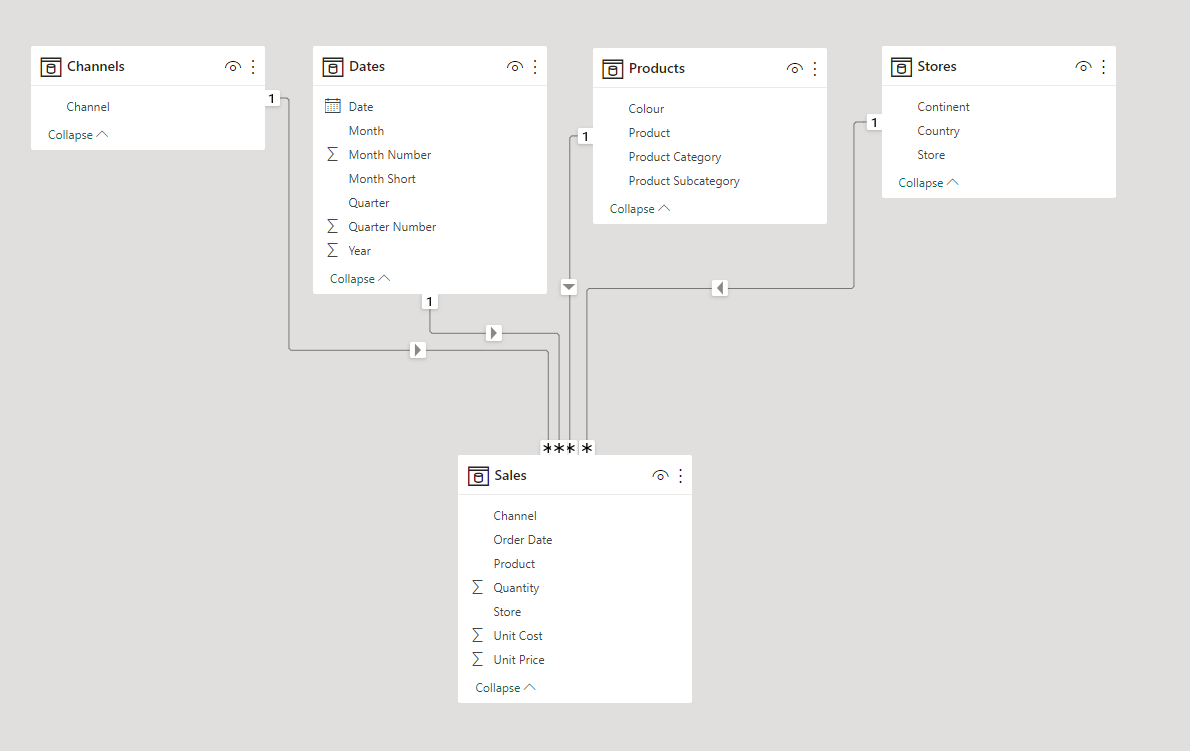
FILTER( ALL( Stores ), Stores[Country] = “Canada” )
) + 0
US Sales =
CALCULATE(
[Total Sales],
FILTER( ALL( Stores ), Stores[Country] = “United States” )
) + 0
Computer Sales =
CALCULATE(
[Total Sales],
FILTER( ALL( Products ), Products[Product Category] = “Computers” )
) + 0
Online Sales =
CALCULATE(
[Total Sales],
FILTER( ALL( Channels ), Channels[Channel] = “Online” )
) + 0
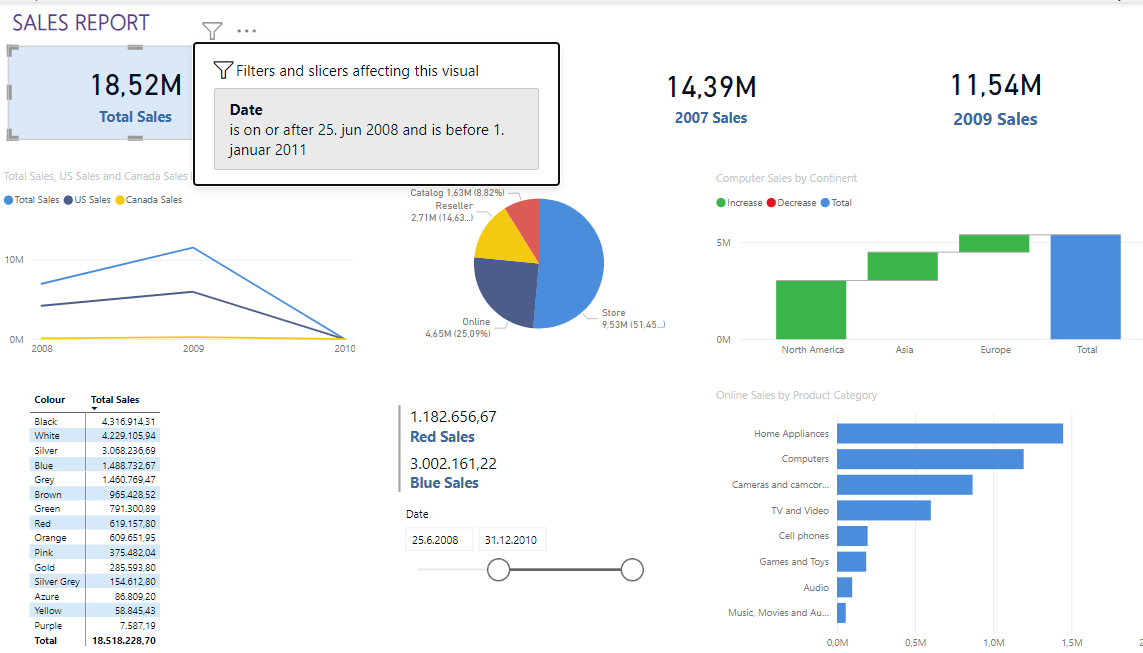
Blue Sales =
CALCULATE(
[Total Sales],
REMOVEFILTERS(),
FILTER( ALL( Products ), Products[Colour] = “Blue” )
) + 0
Red Sales =
CALCULATE(
[Total Sales],
REMOVEFILTERS(),
FILTER( ALL( Products ), Products[Colour] = “Red” )
) + 0
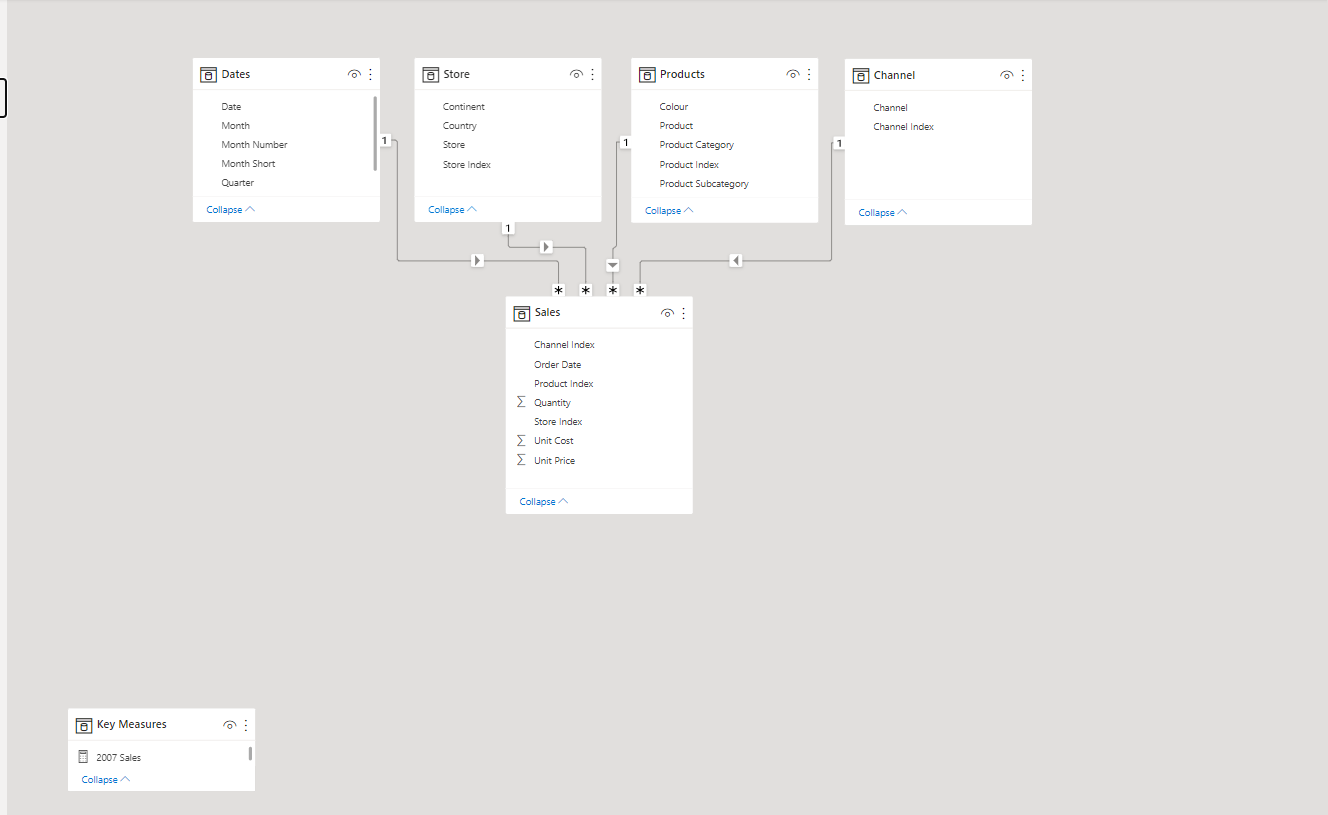
2007 Sales =
CALCULATE(
[Total Sales],
REMOVEFILTERS(),
FILTER( ALL( Dates ), Dates[Year] = 2007 )
) + 0
2008 Sales =
CALCULATE(
[Total Sales],
REMOVEFILTERS(),
FILTER( ALL( Dates ), Dates[Year] = 2008 )
) + 0
2009 Sales =
CALCULATE(
[Total Sales],
REMOVEFILTERS(),
FILTER( ALL( Dates ), Dates[Year] = 2009 )
) + 0
2010 Sales =
CALCULATE(
[Total Sales],
REMOVEFILTERS(),
FILTER( ALL( Dates ), Dates[Year] = 2010 )
) + 0 [Data Modeling Workout 01 by Rasheed.pbix|attachment](upload://dWnLRKJIUFOZoCMHn8QNiFGp0mU.pbix) (219.7 KB)