Hello,
I’m wondering if anyone has run into this obstacle when trying to build a data model.
My data is very limited, because I want to focus on the issue, and not distract with other data.
This is just some sample data I mocked up.
Here is my issue. I have a couple of Fact Tables. One for the Budget Data, and one for the Actual Data.
I then have some look-up Tables. One for Account Number, and a couple others, which are not included. One being Date, which I am running into the same issue.
In this example I have only included the columns for the tables that include Account Number. The Account Table has a one-to-many relationship with the two Fact Tables (Budget and Actual).
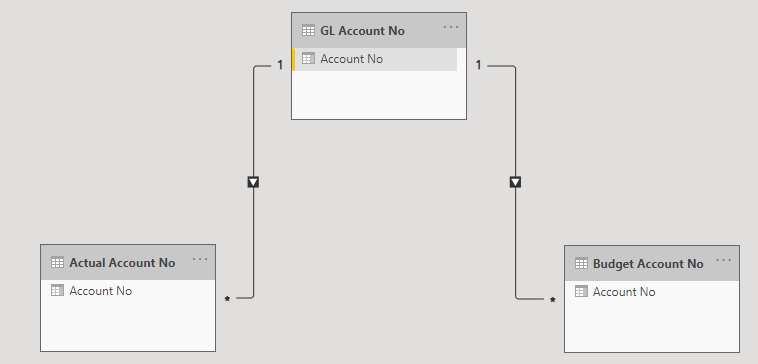
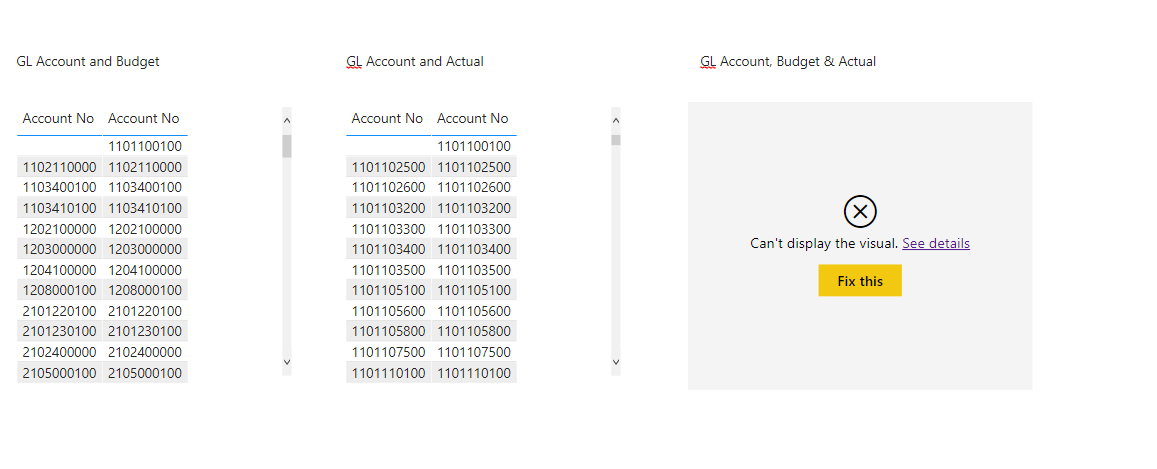
I assume to use Account number to build my relationships, however it doesn’t work when I try to look at all three account numbers side by side.
I’m not sure if I can merge or append the two fact tables, but I don’t know if that is the solution either?
I added a Many-to-Many relationship between the two fact tables, but that didn’t seem to help either. I’m assuming this is a pretty common question. Thanks so much in advance. My data and a PBI file is attached.
Edit— Updated Files –
Data Modeling. Building Relationships with Multiple Fact Tables.pbix (361.4 KB)
Actual Account No.xlsx (675.2 KB)
Budget Account No.xlsx (44.8 KB)
GL Account No.xlsx (25.3 KB)
I’m not sure if RELATED or RELATEDTABLE is the solution, but that would mean I have to build a measure for every dimension or measure I want to use in my visual. I would expect there is a better solution.
Edit:
One thing I didn’t mention, which is probably a big deal. The granularity of the data. The Budget Data (which you would imagine) is at the monthly aggregate level per GL account #, whereas the Actual Data is at the daily level.
I’ve been searching videos and it looks like the best method I can find it to create a Bridge Table or Star Schema table using the reference option (and/or) other tools in Power Query. I’m assuming as long as you don’t drill down to the daily level, the aggregates should roll up to the monthly total.
Is a Bridge Table/Star Schema to connect the two Fact Tables be the best method?

I edited the data and started trying to figure it out again, but I’m still stuck and don’t know where the error is.
I remembered best practices and added my key measures to sum both the Budget and Actuals, but got stuck at that point.
I then tried the relatedtable, and I got the correct calculated data on the last try, but still stuck.