Data Model - Split Fact table depending on cardinality and frequent use?

I’m designing a data model for service desk analytics. Some columns that describe the service issue (e.g., description) and its resolution (e.g., close notes, comments, user-facing notes) are extremely high cardinality and contain a lot of text.

Especially since those columns are only used in 5% of visuals, I’m wondering if it might make sense and be workable to split the fact table. A second fact table would contain only the keys for those high-cardinality, infrequently-used columns. The primary fact table would contain the keys and degenerate dimensions that are used often and are generally low cardinality.

I’ve never seen this pattern mentioned in all my study of data modeling, so I suspect there’s a flaw I’m not thinking of.

Could experienced data modelers provide feedback on this idea?

Hi @JulieCarignan - Please find the response generated by Data Mentor platform. Check if this is helpful.

Thanks
Ankit J

Data Model Design for Service Desk Analytics

Problem Analysis

You are designing a data model for service desk analytics. There’s a specific challenge regarding high-cardinality text columns related to service issues and their resolution, which are used infrequently in visuals. Your idea is to split the fact table into two: one for frequently-used data and another for high-cardinality, infrequently-used data.

Proposed Solution

Splitting the fact table can be a practical approach, particularly for optimizing performance. However, certain considerations must be made to avoid potential pitfalls and ensure the model remains both efficient and maintainable.

Solution Analysis

  1. Primary Fact Table: Contains keys and commonly-used, low-cardinality columns (e.g., service issue ID, date, priority).
  2. Secondary Fact Table: Contains keys and high-cardinality text columns (e.g., description, close notes, comments).

Considerations

  1. Performance:
  • Optimization: Splitting the table helps minimize the load on frequently-used data, improving query performance for most visuals.
  • Storage: Managing storage more effectively by segregating large text fields that inflate the primary fact table size.
  1. Complexity:
  • Joins: Adding complexity through additional joins when accessing detailed text data.
  • Query Complexity: Requires careful handling in query design to ensure accurate and efficient data retrieval.
  1. Best Practices:
  • Ensure consistency in keys between both fact tables to facilitate seamless joins.
  • Maintain clear documentation to aid in understanding the data model structure.

Thank you, Ankit.

I’d also like to hear from actual data modelers who may have real world experience to bear on the feasibility of the proposed idea.

Hi @JulieCarignan,

Sorry, don’t have a straight answer for you, just want to share my 2 cents…

In general, high cardinality columns impact model size and performance. Therefore, it is always worth considering if cardinality can be reduced. Strategies to accomplish that focus on splitting, grouping, or categorizing data. For example, if you have a column with a large number of distinct values, such as datetime, you can split this column separating dates from times to lower cardinality. Another common example is data that can be binned, grouped or categorized to bring similar values together into a smaller set of unified labels or identifiers. These actions can help simplify the data and improve query performance.

However, from your description I understand that this is not applicable to your case. Although it is always worth discussing with stakeholders what level of detail is actually required…

.
Furthermore, it is important to realize that tables in DAX are always expanded. If you filter a table using CALCULATE, you also filter all of the related ones, following a many-to-one pattern.
Depending on how you plan to build the model this fact will have to be considered.

I have concerns, hope this is helpful.

2 Likes

Adding my comments here - you are describing something that appears in a Snowflake dataset, and as I’m sure you’ve seen in your various studies - that’s not considered the most ideal for Power Bi.

However, that doesn’t mean that we can’t use a snowflake model. I have been forced to this model in more than one dataset, and it does occasionally present challenges. Example, I’m currently cleaning a model created by a former Power Bi designer, and the refresh on that report is horrible - he broke everything into sub tables and it’s absurd.

  • everything @Melissa said above, her advice is invaluable when it comes to data modeling, and I’m not kidding! (I know I’ll be looking into the SQLBI link)
  • If you are developing this with other report modelers or designers in mind, they ALL need to understand how and when to use the extra table.
  • hide your connecting elements from the sub-table (the ID you will be joining on) - to prevent accidentally trying to bring the wrong info into your visuals

One thing to consider is developing a primary report that doesn’t need the additional table, then creating a second report, using the first as your dataset and adding the detail table into the mix.

3 Likes

Hi @JulieCarignan,

Adding to Melissa’s and Heather’s responses, one item to consider is how you are using the data in those text fields relative to visuals. If you could describe that, it would be helpful.

If, for example, you are looking for specific words or phrases, you could consider parsing those key values out during the Power Query data import process, setting various boolean or integer values for specific conditions that are matched, and/or other options that involve creating your own data describing the imported data.

That would A) reduce the amount of data being stored in the data model, and B) give you multiple options for how to store that data in the model (i.e. a single field with delimited keyword values; additional boolean or integer value fields; a separate fact table with the case ID and one keyword on each row; etc.).

John

2 Likes

Thank you for your input, Melissa.
I’m already splitting datetime (and binning time into beginning of hours to further reduce granularity), but it’s the verbose textual columns that I’m concerned about.

I appreciate your bringing my attention to the potential impact that could arise from extended tables. I’ll have to consider the implications!

It may help if I’d give more context.

My interest is in using data to help my team “shift left,” i.e., identify issues that arise most often and then find ways to automate or otherwise meet those common requesters’ needs by using lower tier support methods or even averting them by training and Knowledge Base content. (For example, password resets requests account for such a high percent of tickets that they beg for automation!).

I also want to analyze if there are clusters of issues that, as they were initially described, turn out to have had a different root cause. That would hopefully be noted in the resolution fields. (E.g., someone reports a monitor being dead but rebooting the computer actually solved the problem).

I’m the only one who’d do those analyses for now and only rarely; 95% of analyses wouldn’t drill to that level of detail. That’s why I hate to bog down other analyses with those wordy columns, yet I want to keep them.

Since I get data from dataflows, maybe a separate semantic model would be preferable to this idea of separate fact table in the same dataset.

Hi @JulieCarignan,

Categorizing tickets based on keywords is a highly effective approach that should be considered to reduce model size, enhance performance, and provide valuable insights for all report consumers.

Depending on your ticketing system, AI features may be necessary to automate the labeling process. This involves transforming verbose text into a standardized set of labels or categories for the three process steps you want to track: Complaint (initial submission, such as unable to log on), Problem (root cause identified, such as account locked, lost password), and Solution (such as password reset).

Additionally, when possible, consider including a direct link to enable quick navigation to the ticket in the ticketing system for further investigation. While this creates a high cardinality column, it will be more lightweight compared to one or more verbose text columns…

I hope this is helpful.

1 Like

Great points, @Heather !

Just the fact that you characterize this scheme as “snowflaking” gives me a path for further consideration. (I hadn’t thought of it that way).

I find your last paragraph extra helpful, the idea of one report with only the frequently used tables serving as the dataset for a second, specialized report.

In fact, you gave me an idea for another data modeling challenge I’m facing: how to model a core and custom star scenario.

There’s a core table in the data source that I’ll refer to as AllTasks that contains all tickets and the fields that are common across all ticket types. It’s useful for strategic questions.

Then each ticket type - incidents, tasks, work orders – has its own table in which all the core fields are repeated from the core table and there are additional custom fields specific to that ticket type. The extra fields help answer operational questions.

Since I want to re-use code and have conformed dimensions, the method you suggested might be a possible implementation. Currently I’m feeding dataflows for each custom star with tables from the dataflow for the core star.

Thanks for your input!

1 Like

Hi @jpratt
Your reply is on target but you’re a step ahead of me. Conceptually I envisioned doing what you described, but I haven’t yet worked out how.

Having done a few proof-of-concept experiments. I was daunted by how many synonyms, misspellings, capitalizations, and word ending variations technicians enter for even one category of tasks (e.g., deployed can be entered as delivered, swapped, replaced, loaned, dropped off…)

My initial studies have led me to think that most M code functions lack wildcards(?) and there’s no equivalent to DAX’s SWITCH() function. I’ve got more learning to do!

I’d appreciate it if you could help point me to any resources to accelerate my research.

Julie

@JulieCarignan,

So much good stuff in this post! I feel like we are all already a project team :slight_smile:

On the topic of data extraction: “shifting left” also applies to this. The closer to the data source you can get when extracting the required data/information, the better. Don’t be afraid to go back to the person/group that serves up the data and ask about including data parsing capabilities in the original data, such as pulling out keywords or adding boolean/bit columns if this or that condition is true or false. Sometimes a SQL view is all that is needed, or maybe using custom fields in the source system to capture required discrete data values.

Even within Power BI, if you can use a SQL query to extract the data from the data source, you could use simple syntax such as "is_deployed = CASE WHEN value LIKE ‘%delivered%’ THEN 1 WHEN value LIKE ‘%replaced%’ THEN 1 … ELSE 0 END.

There is very likely something similar in M that will do that. I found this example using Coalesce in M (which also exists in T-SQL although not exactly the same). This requires the same foreknowledge of the keywords you are looking for as the SQL example above, but it will be much easier to add new keywords to the list to search for over time.

I also found the SEARCH function on Microsoft’s site. This can be checked for a non-blank/0 value to indicate that a search keyword exists so that a boolean value can be set.

In one particular student information system report, I have used the ETL capabilities in Power BI to replace numerous abbreviations and misspellings of town and address values with “official” values. I have about 25 “Replaced Value” and related steps. I used this despite using SQL to extract the data because the Transform Data UI is easier to add changes to over time.

These methods are a bit like a hammer: simple, effective for what they do, but potentially a performance drag if the task is very large (i.e. tons of records, tons of text, and/or tons of keywords to find). That’s where the AI path that @Melissa mentioned would be the purpose-specific nail gun. I have not had the opportunity to work with that functionality, so I can’t comment on it, but it’s worth some research.

On the topic of ticketing systems and associated data models: I have developed many of them over my career, including 3 at my current employer, that tick all the boxes mentioned by you and @Heather. In particular, I use a core table with “standard” fields, although not all ticket types use all of them, plus extension tables for truly custom fields by ticket type. Then I have events underneath every ticket. My Power BI reports for them use a snowflake model with the tickets and events as the fact tables. I can provide a picture of my data model if desired.

I definitely recommend mimicking that structure in your model, which will allow you to construct all “standard” measures and associated visuals in a highly reusable manner on top of the core tables. Create additional custom fact tables and/or dimensions for specific ticket types or scenarios which can be linked to the core tables via ticket ID or similar value, and then you can develop measures, visuals, and pages within your reporting that focus on those specific ticket types/scenarios.

Or even a separate report for the scenario-specific needs as @Heather mentioned. I haven’t gotten that fancy yet :slight_smile: , but this would work well with the Power BI service’s “app”, which can bundle multiple reports together.

I hope this helps, and I wish you great success in your endeavor!

John

2 Likes

HI there,
I love reading these posts that have so much information/expertise contribution within the EDNA Community.

Thanks for your all your contributions.
Keith

2 Likes

Wow, thank you @jpratt, such a generous response. And since I’m an island where I work now, the only analyst, I’d so value being on a project team again that I’m happy that we’ve got some collaboration going on here!

You’ve made great points. I’m realizing that I’ve made an assumption that I should check that the team that pulls the data into the data lake wouldn’t create some database views. Maybe they would. And yes, I could try writing SQL in Power BI!

I’ve done value standardization by using the List.Accumulate function when the job was too big for “Replace value.” You trigger the idea that I could use it in this case for the grouping of similar ticket issues too.

I appreciate your feedback that I’m on a logical track in choosing a “core and custom” architecture; it’s lucky you’ve worked on ticketing systems so know the domain. A core/custom data model also fits, I think, a software license analysis that I’m also working on, so figuring out how to implement it would do double duty.

Thank you, John!

1 Like

Me too! I’m glad you’re enjoying them as well, Keith.

sounds like you are well on your way to success, @JulieCarignan!

One scenario that I realize I didn’t explain very well was the idea of a composite model.

This means that you would:

  1. create a robust model for your normal report needs - having all your core measures, etc.
  2. connect your standard reports to that, possibly adding in a measure to the report level when you have something that just isn’t required by more than one of the reports.
  3. connect your special report (the one that will need the extra datatable) to that same data set and then transition that report to using a composite model by adding in the new

You will get a warning when you connect to the additional table (I generally store that table in a dataflow, but it can be accessed direct from the source if you prefer)

There will also be a request for what tables of the dataset you want the connection to be made on - and you’ll be warned about potential security risks.

Once you’ve connected the existing dataset and the new table(s), you’ll see this in y our model. The existing dataset will be there with all tables, and they will probably have a colored header now:

The new tables will also appear (not yet connected to the primary set, and with no color header or a different color (I have seen this with both cases in the past, but I believe no color is the default these days)

You will have transform capabilities with the new tables only (the existing dataset will not be editable - this is a thin report connection)

You WILL be able to create connections between the new tables and the existing dataset - you will NOT be able to change connections on the existing dataset.

Your new report will be using a Mixed storage mode , and as stated in the warnings, this will not be un-doable

image

Best of luck to you! I am also a department of one in my company, and it’s a challenge to say the least :slight_smile:

3 Likes

Hi @Heather ,
Thanks so much for adding that additional detail.

I had been thinking of a data model like you’re describing, but when I got that very warning that you showed about requiring a DirectQuery Connection, I wondered if using a new-to-me Connection type would suck me down another rabbit-hole of learning, experimenting and troubleshooting that could slow my progress considerably.

So I’m very glad you addressed that. And from what you said and showed about how I’d proceed after that, it seems reasonably straightforward (though I may find myself eating those words :melting_face: ).

Thank you, fellow Team-of-One! You’ve really helped me see a viable path forward!

Julie

1 Like

Best of luck Julie - and feel free to reach out (if I’m not here, there are others who are using these models)

Hello @Heather
After developing some other analyses, I’ve now tried to implement what you described. It didn’t work as I expected from what you described, but I think I’ve got a model that works, though I’m curious if it’s optimal.

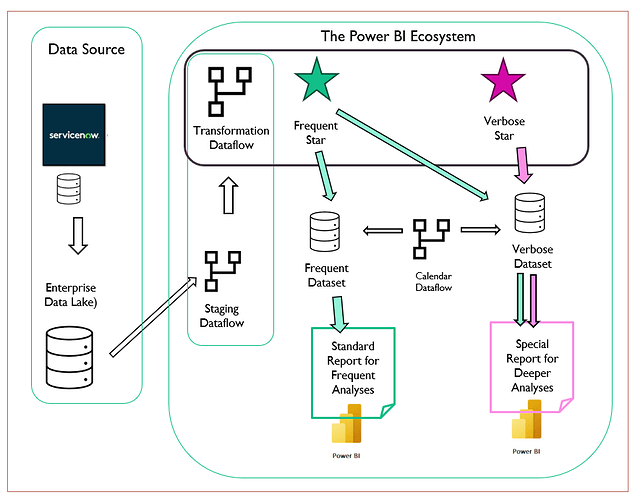
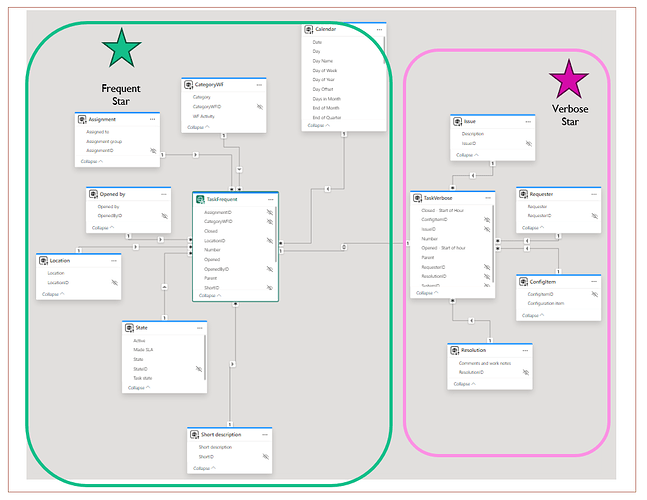
Below is a diagram of what I did. Assuming it’s readily comprehensible without explanation beyond what I’ve already described, does this look like a logical architecture, and does it match what you described?

Based on what you said, I expected that when I was in the Special thin report that was live-connected to the Frequent dataset and now needed to bring in the verbose, high cardinality columns , I thought I’d be able to create a second DirectQuery to the new Verbose dataset. But I couldn’t.

My workaround is what’s shown. I had to pull both stars from the dataflow into the Verbose dataset. I ended up with two fact tables. It didn’t seem right to create the bi-directional relationship between them but since they purposefully don’t have any conformed dimensions in common, I assume I need that relationship to be able to put fields from both stars in the same reports.

Any feedback is welcome.

@Heather
I just discovered why it seemed that I couldn’t proceed with the method you suggested. (Would characterize it as what been called Direct Query over AAS and PBI, or the New Composite Model? )

In this video: Power BI Composite and Hybrid Models - YouTube - at about 29:00 min - Alex Whittles whips past the screen that stopped me. I didn’t realize that screen was NOT showing the new data I wanted to bring in, but just asking if I wanted to change the existing tables to DirectQuery to enable the new data to come in.

Hi @jpratt,
I’ve just been re-reading your post and realize I missed your offer to provide a picture of your data model. Please do, I’d really appreciate that.

I’d also like to understand what you refer to as “events” that are fact tables along with tickets. What are examples of events? And what do you mean that they’re “underneath” every ticket?

I’m psyched to find someone who’s implemented core/custom and worked with ticketing systems.