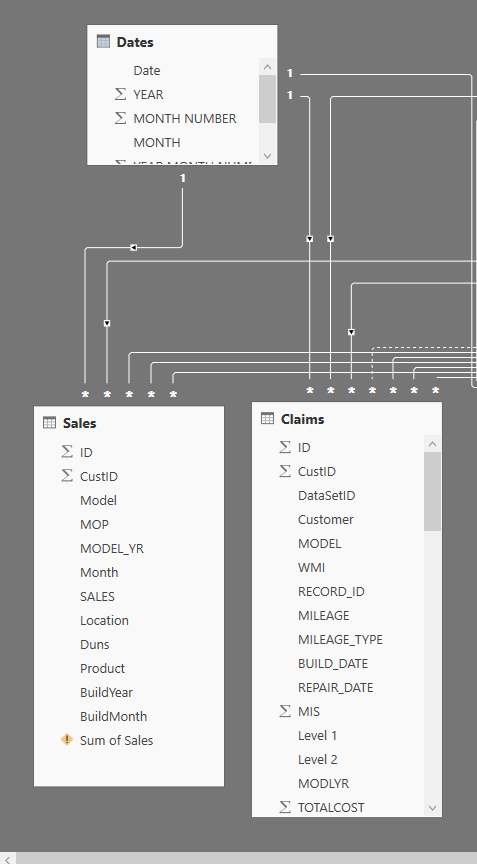
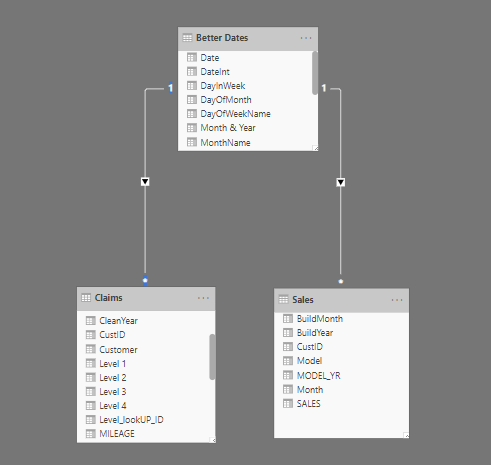
I have a data grouping which working perfect thanks to Sam’s video on you tube, I have 2 transaction tables called Claims and sales. They are connected through the date table.
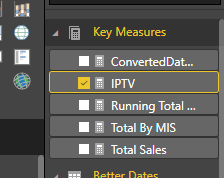
Based on that grouping I have created couple of measures
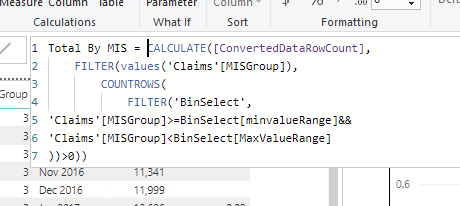
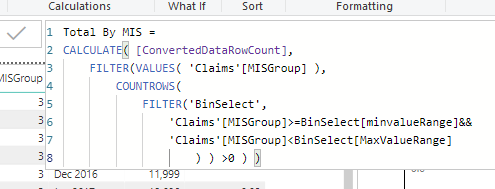
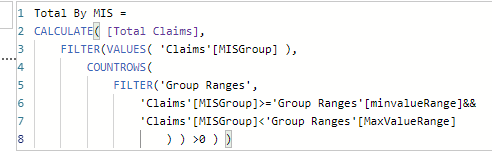
Total By MIS = CALCULATE(Claims[ConvertedDataRowCount]|
FILTER(values('Claims'[MISGroup])|
COUNTROWS(
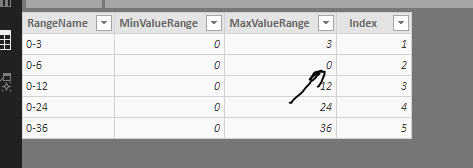
FILTER('BinSelect'|
'Claims'[MISGroup]>=BinSelect[minvalueRange]&&
'Claims'[MISGroup]<BinSelect[MaxValueRange]
))>0))
Running Total By MIS = CALCULATE(
[Total By MIS]|
FILTER(
ALLSELECTED('Claims'[MISGroup])|
(ISONORAFTER('Claims'[MISGroup]| MAX('claims'[MISGroup])| DESC)
)
))
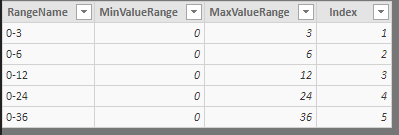
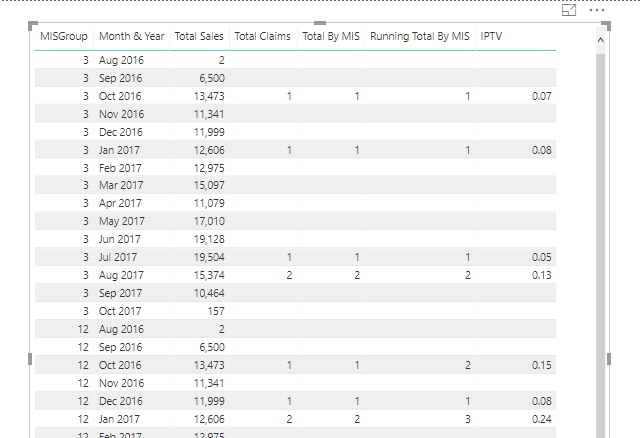
The above 2 measures count the claims first for 0-3 and then with the running total counts 0-6, 0-12 and 0-24.
Based on the calculation I run another measure
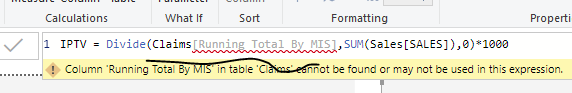
IPTV = Divide(Claims[Running Total By MIS]|SUM(Sales[SALES])|0)*1000
All of these working fine without any problem. The issue I am having and trying to resolve it for the past 3 days is this
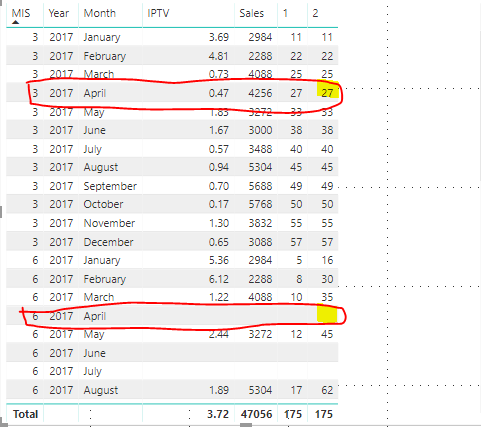
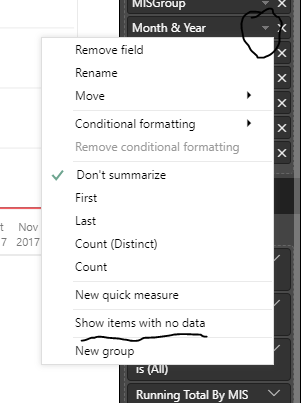
if for 3 MIS (Month in service) for year 2017 and Month of April it has record in transaction table but for 6 MIS there is no record in the transaction table (Claims to be specific) it doesnt bring the value of 3 MIS. I just want it to bring back the value 3 MIS and place it in 6 as long as there are values in months after April for this example it has May present and same thing for June, July missing as August has value so it should replace the value for 3 MIS. the reason it is showing empty rows because I check the box "Show item with no data.
You guys have no clue how much I would appreciate the help.
Finding it difficult to see all the pieces here. The main confusion for me is where is the context for the grouping table in you actual table in Power BI.
It’s really understanding all the context which is difficult here, both in the formulas and the evaluation context in the page.
Would probably need to actually see the problem in a demo model to assist further.
My recommendation here is to really think through all the contexts yourself first. What’s coming from the table you’ve setup, then what is in the formula, and how they are working together. This is how you’ll find the problem most likely.
Thank you Sam,
The grouping is in the model. It is calculated field that is provided to me. Called MISGroup. Which simply means that where the Month in service (MIS) fall into. it has null values as sometimes MIS is greater then 3 but less then 6 so the MISGroup value for it is null and as I said before its provided to me.
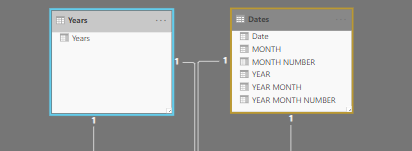
This is the date file that is connected to the excel file on build_date.(Its also connected to sales table but that is not causing the problem so I am going to leave it out of it.) Date.txt (353 Bytes)
The excel file is already filtered on Customer=‘GM’ , ModlYr=2018, Model=‘NQH’ and level1=“Leak”
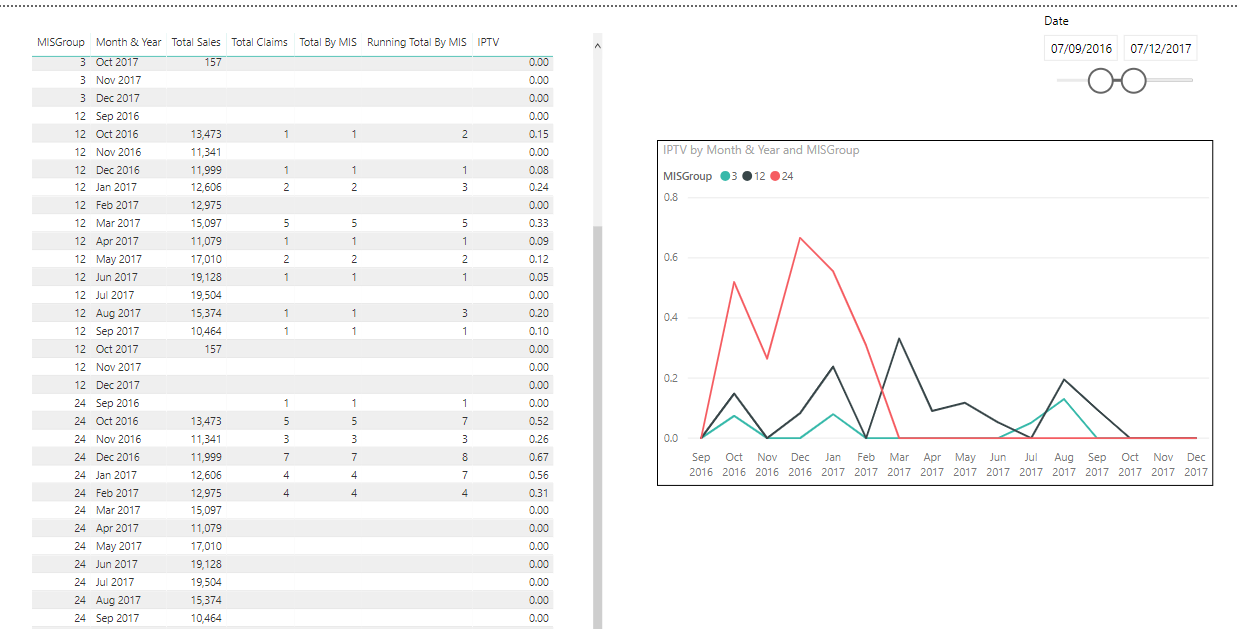
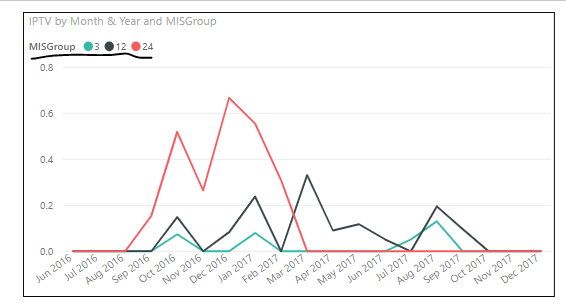
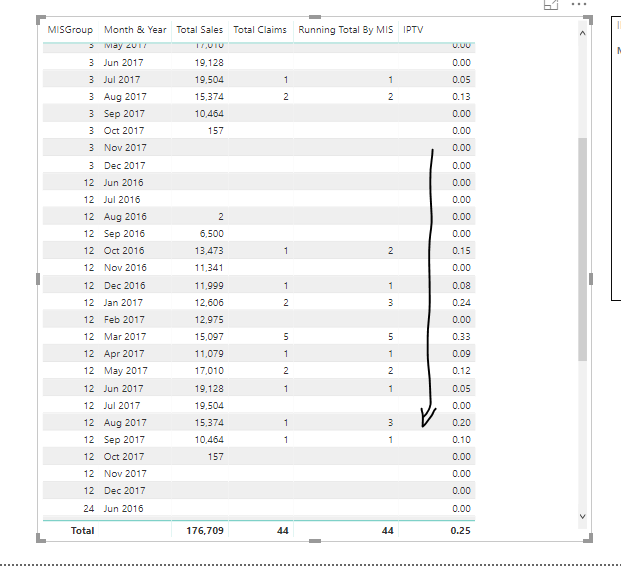
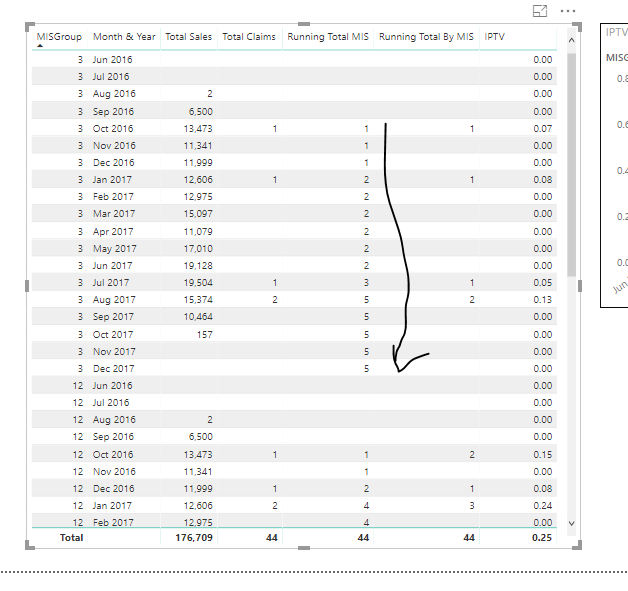
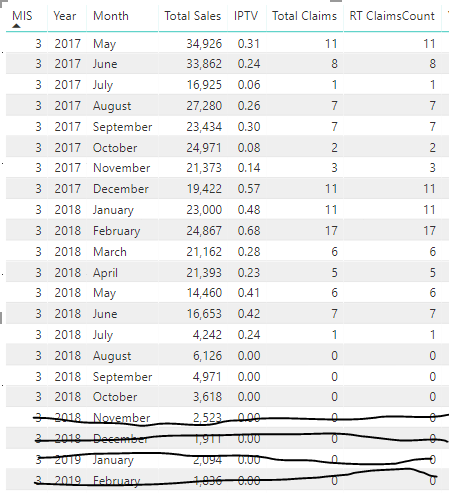
Finally the table that it is outputting for the graph. I highlighted the missing months.
If you have any further questions please let me know. I tried my hardest and couldn’t figure it out.
Thanks in advance for looking into it.
I think the problem is that there is no data in Build_date in Claims table (excel sheet I provided) and its not printing those missing values I just want it bring the date from the dates table and if there is no previous value (for example 3 mis has no previous values for the month of August so it should be 0 otherwise for 12 MIS just take the value of 3 MIS) I know what the problem is I just dont know how to figure it out.
I thought I should create an example that I can share. Sample.pbix (174.3 KB)
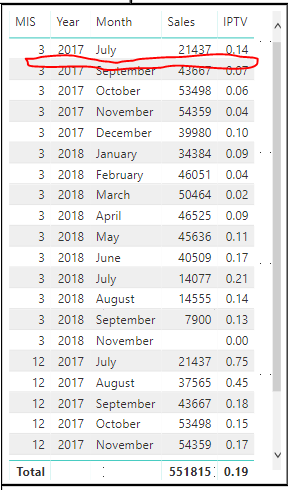
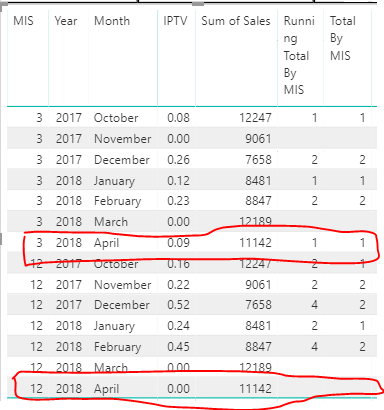
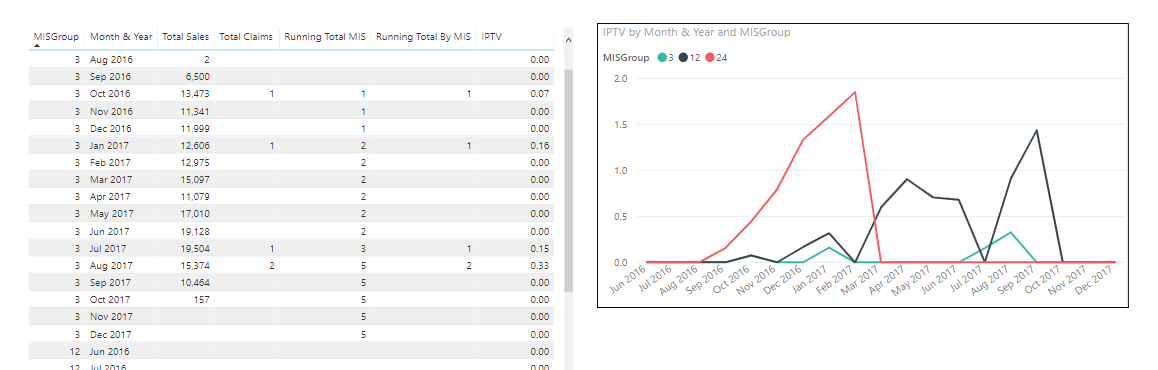
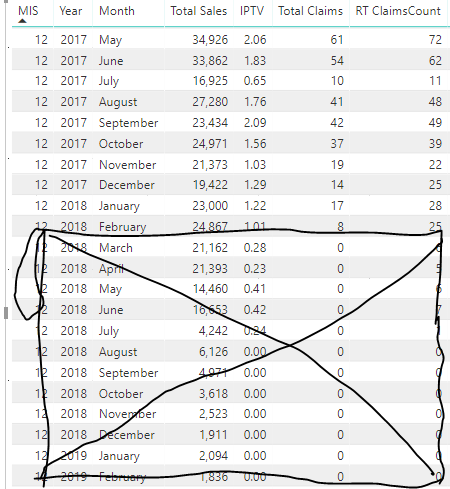
Following is the desire output I am expecting. I dont want to do anything with 24 MIS. for 3 MIS in the missing months in the middle it should go down to 0 and for 12 MIS for missing month it should go to 3 MIS value for that particular month. But they should never cross each other .
Here is the desired output I am looking for
Thank you for looking into it. The only issue I see is that that will change IPTVfor 24 months as well, which I don’t want. How do I do what you suggested for only 3 and 12 months?
I will greatly appreciate if you can spend more time on it. That was the whole point of me making the sample file and getting the membership.Let me try my level best to summarize it.
Claims and sales are connected to Date table on build date in claims and column called month in sales. Model year bring all the build dates that are in MISGroup 3,12 and 24. Let’s take 3 for example if it has June and August record then the July record should be 0. But for 12 months if it has August and October record so the value of IPTV should be equal to September of 3 MIS.
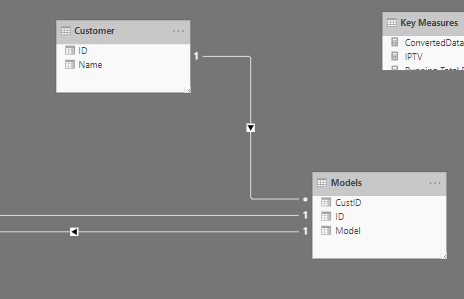
Rest of the tables you can ignore as they are supporting tables and I had to create the exact same report with lot less data so you can see what I am trying to achieve.
Thank you Sam very much. The output that generated by your solution has the problem.The lines should not cross each other . IPTV stands for incidents per thousand vehicles. So by business logic 12 months can be equal to or more then 3 MIS never less. Hence I was asking if there is a missing value in 12 months replace it with the one in 3 and if there has missing months in 3 MIS replace it with 0. So 12 will always have 3 MIS value when it is missing it , Also can we just apply the logic for 3 and 12 MIS and leave 24 MIS?
For your point #7 The business decided not to have 6 MIS in the chart so instead of deleting the line I just put 0 in it.
Again I greatly appreciate your help and insight and will make sure that I Change the model according to your suggestions.
Sam,
Thank you for all the help. I followed the whole thing and clean up stuff and organized stuff as you suggested.
I ended up creating Sum of sales measure, I normally put stuff in the table so I can see how the result looks like. For some reason running total is not showing its value if the current Month doesnt have a count.
Here are my measures
Total Claims = COUNT(Claims[ID])+0
Total By MIS = CALCULATE([Total Claims]|
    FILTER(values('Claims'[MISGroup])|
        COUNTROWS(
            FILTER('BinSelect'|
'Claims'[MISGroup]>=BinSelect[minvalueRange]&&
'Claims'[MISGroup]<BinSelect[MaxValueRange]

))>0))
This is for running total.
Running Total By MIS = CALCULATE(
	[Total By MIS]|
	FILTER(
		ALLSELECTED('Claims'[MISGroup])|
       (ISONORAFTER('Claims'[MISGroup]| MAX('claims'[MISGroup])| DESC)

	)
))
Also The IPTV formula, somehow needs to be changed to just use MISGroup=3 Which I cant figure out yet
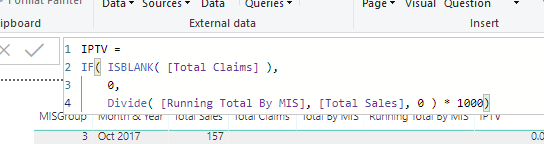
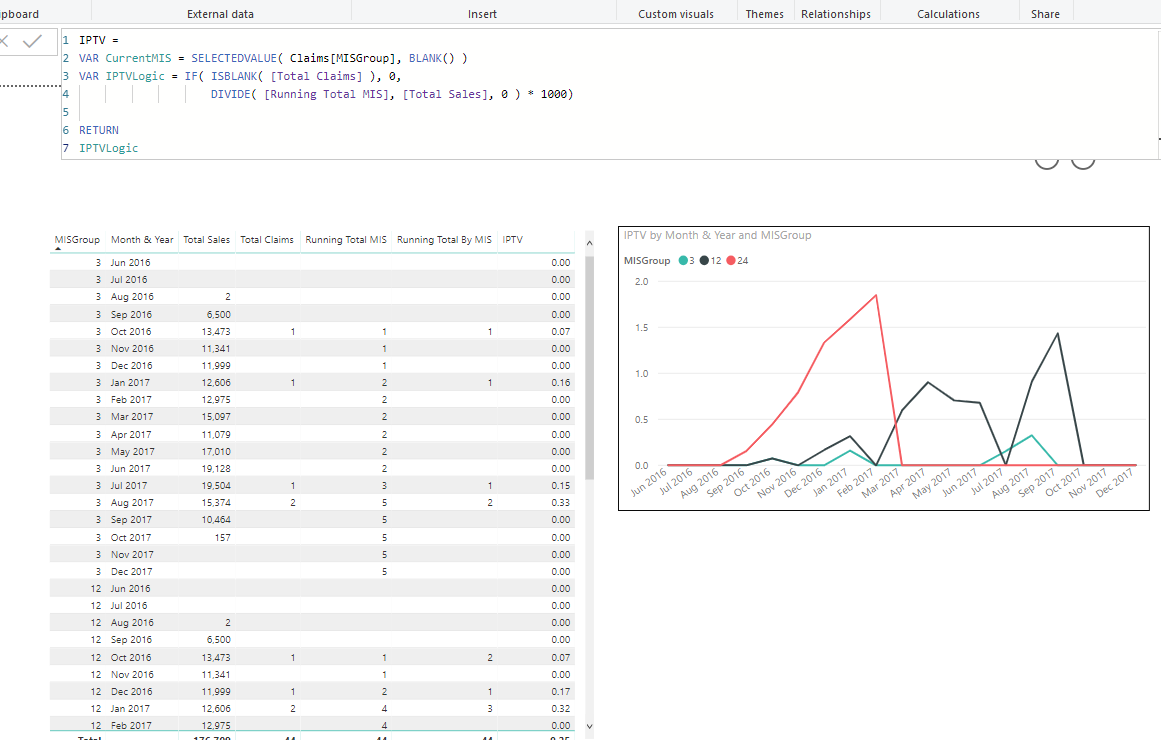
Here is the fomula again that you help me create. I had to add the measure for sales as it was printing all the dates from the date table.
IPTV =

IF(ISBLANK([Total By MIS]) && [Sum of Sales]=0 |

0

|Divide([Running Total By MIS]|[Sum of Sales]|0)*1000

)
I was watching one of your videos and you mentioned that the reason it shows “blank” cause it is out of the context. I am not sure what I am missing. If I can do the 0 only for 3 MISGroup and be able to move running total working I should be much closer to my desire result.
I tried to resolve it by following your post and had no luck
The reason why some months are not appearing is because BLANK (or no results) do not show up inside tables.
You can though change this here
This doesn’t solve the chart though.
I’m still a bit confused by everything here honestly.
I’m just not really sure what this is achieving?
I don’t see the ranges being used anywhere now that I revisit it again. All the filtering gets done naturally by the filter that is placed in the charts. I think this is what’s getting me on this.
I apologize, I am not doing a good job of explaining myself clearly and I apologize for the confusion and wasting your time.
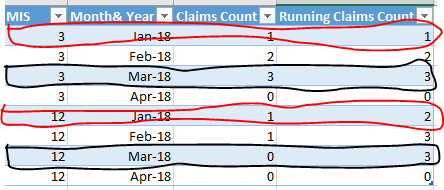
Let my try my level best to explain it. Lets just forget about the Graph for now. Lets focus on the table. I want to add the total by Month&year and MIS. Lets say I have following (I tried to format it doesn’t seems to work)
As you can see I want to add 3 MIS for the Jan 2018 to 12 MIS for Jan 2018 and so on. I am going to try and modify this formula.
So it can take claims[MISGroup] into account as well. I will report back to you as soon as I can. Running total is one of the very important part of what I am trying to achieve.
Let me work on the formula and I will report back.
Again thanks for all your help.
Ok so the running total is only within a specific month?..and then you start again every single month…you want to calculate a running total across just the month for each MIS?
Yes and I think I got it working. But that presented another issue. (Which I haven’t solved it yet). That we also have to take into consideration the model year( as they can select multiple model years from slicer). Having the capability of selecting multiple model years (claimsConvertedData[modlyr] is throwing off IPTV.Let me see what I can do and if I need your help resolving it. Either way I will upload the sample file so you can give me your expert opinion.
Again thanks for your help.
Hi Sam,
Ok thank to your help I have almost completed the task that looked impossible when I begun. Now the last part. I need to offset data. For 3 MIS it should calculate IPTV up till (current month-4), for 12 MIS it should calculate the IPTV uptill (current month -13) and for 24 month of service it should calculate IPTV uptill (current month -25).
For 3 MIS it should stop the IPTV on Oct 2018.
For 12 MIS
And there shouldnt be any data for 24 MIS. I had updated the sample pbix file.
Thanks in advance for all your help Sample (3).pbix (360.0 KB)