Cumulative sum of a measure that creates another cumulative sum

Hi Fellow Power BI Users -

I am trying to create a cumulative sum of a measure that itself calculates a cumulative sum (all of which needs to be sliceable).

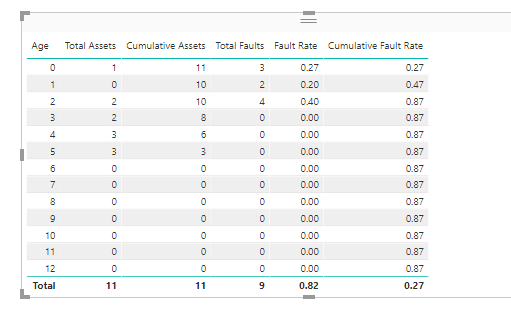
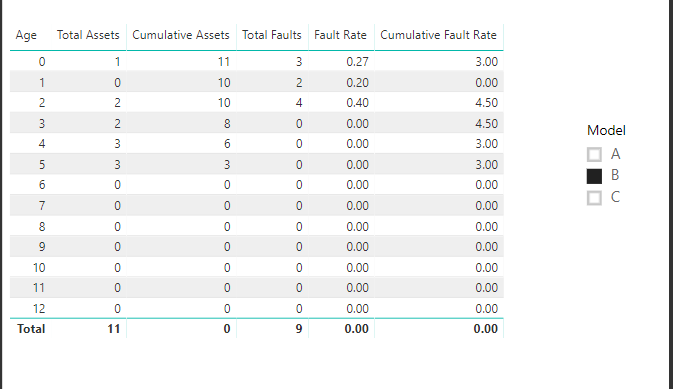
A table view of the data/measures I have created is in the attached image (I can provide a sample pbix file which illustrates my problem if that would be helpful)

example%20table

Where:

Age column is pulled in straight from a Table.

Total Assets is a simple measure: Total Assets = COUNT(Assets[Age]) + 0

Cumulative Assets was generated using the quick measure running total:

Cumulative Assets =
CALCULATE(
[Total Assets],
FILTER(
ALLSELECTED('Age Table'[Age]),
ISONORAFTER('Age Table'[Age], MAX('Age Table'[Age]), ASC)
)
)

Total Faults is a simple measure: Total Faults = COUNT(Faults[Age at Fault]) + 0

Fault Rate is a simple measure: Fault Rate = DIVIDE([Total Faults],[Cumulative Assets]) + 0

The desired goal is to have “Cumulative Fault Rate” calculate a running total of the Fault Rate as a function of age.

The column should contain [0.27, 0.47, 0.87, 0.87, 0.87…]

I have tried to implement using the quick measure running total:

Cumulative Fault Rate =
CALCULATE(
[Fault Rate],
FILTER(
ALLSELECTED('Age Table'[Age]),
ISONORAFTER('Age Table'[Age], MAX('Age Table'[Age]), DESC)
)
)

As the table shows, the “Cumulative Fault Rate” column is not showing what I want…

Finally, I would like the measures to be dynamic with the model slicer (I am assuming that is where the “ALLSELECTED” function fits in…)

Apologies if this has been covered, I did read a couple of other threads and tried to solve on my own…but couldn’t get it working.

Thanks,

Matt

Look like we need to use a pattern here similar to what I run through in this video - https://www.youtube.com/watch?v=f5k4fD1YJrQ&t=25s

Mainly due to there being now dates, just numbers.

I think you should be able to complete this using a formula pattern like this.

Cumulative Fault Rate = 
VAR AgeNumber = SELECTEDVALUE( Age Table[Age] )

SUMX(
   FILTER(
       SUMMARIZE(  Age Table, Age Table[Age],
             "FaultRates", [Fault Rate],
             "Ages", SELECTEDVALUE( Age Table[Age] ),
                      [Ages] < AgeNumber ),
     [FaultRates] )

Sorry I’ve just had to write this into the post, So formatting may not be great.

I’ve basically tried to replicate the formula from the video.

See here

See how you go with this. Let me know.

Thanks
Sam

Hi Sam,
Thanks for the quick response!
I have implemented your suggestion as per the video explanation…(I adjusted a few positions of brackets so hopefully I haven’t introduced an error) and I am not getting any values in the table from the new measure. The cumulative fault rate column is just blank.

Here is a link to the pbix file so you can see the data structure etc. https://www.dropbox.com/s/34ez232he3nso5w/cumul%20sum%20data.pbix?dl=0

Let me know if you have any further ideas I can try.

Thanks for your help

Matt

This should do it. Was a bit of trick to it.

Cumulative Fault Rate = 
VAR FaultRate = [Fault Rate]
VAR Age = SELECTEDVALUE( 'Age Table'[Age] )

RETURN
SUMX(
   FILTER(
   SUMMARIZE( ALL( 'Age Table' ), 'Age Table'[Age], "Faults", FaultRate, "Ages", SELECTEDVALUE( 'Age Table'[Age] ) ),
         [Ages] <= Age ),
         [Faults] )

Main thing to understand is why to use the ALL function, as it’s important to remove any intial context from the Age Table at each different row.

Do you need the total as well, as they might need another adjustment, but this gets you the cumulative totals for now.

Hi Sam,
Thanks for another quick response.
I have implemented the measure and arrived at the same answer you have in your figure.
Unfortunately the cumulative fault rate is not calculating correctly.
The column should be [0.27, 0.47, 0.87…]
I haven’t digested the formula completely yet, but you might spot what is causing the discrepancy.
Appreciate your effort on this.
thanks,
Matt

Sorry yes, your right. I’ll have a look.

My bad, I think I know problem now though. Just need to test a few things.

Ok got it now.

There a bit to these ones, not super easy, but great techniques to use in Power BI.

Use the below formulas (try to avoid quick measures I believe. They can send you down the wrong path in some cases)

Cumulative Assets = 
VAR CurrentAge = SELECTEDVALUE( 'Age Table'[Age], 0 )

RETURN
SUMX(
    FILTER(
        SUMMARIZE( ALL( 'Age Table' ), 'Age Table'[Age],
            "Assets Total", [Total Assets] ),
                'Age Table'[Age] >= CurrentAge ),
    [Assets Total] )


Cumulative Fault Rate = 
VAR Age = SELECTEDVALUE( 'Age Table'[Age], 0 )

RETURN
SUMX(
   FILTER(
   SUMMARIZE( ALL( 'Age Table' ), 'Age Table'[Age],
        "Faults", DIVIDE( [Total Faults], [Cumulative Assets] ) + 0 ),
         'Age Table'[Age] <= Age ),
              [Faults] )

image

The key to understanding these is to try to break down each table and the filters. That way you can visual what is happening at every row within that table to get you the results that you need.

Chrs
Sam

Thanks Sam, that worked a treat.
I will work through the formula to make sure I understand what it is doing.
cheers!

I cant upload my pbix file here?
But played around with the customer analysis, added my own data to do e few tests, but not getting the last year cumulative and 2 years back right?
sales%20customers

it looks like my last year sales id not adding up?

Sales LY = 
CALCULATE( 
	[Total Sales] , 
		SAMEPERIODLASTYEAR( 'Sales_Data'[Date] ))

just shows zero??

how long does it usually take for a reply here?

Please review here for information about the forum

https://forum.enterprisedna.co/c/welcome

The answer here is relatively straight forward. You’re receiving low number because it’s not in a cumulative total. You just grabbing results for the year before.

To learn how to solve this see here

Also I would always recommend getting these results into a table so you can actually see the numbers and audit what is happening in every calculation

Chrs