Hi @nipunadv,
So I’ve attempted to turn you data into a start schema but several issues with this sample dataset became apparent… I have dealt with that BUT you’ll have to check and devise a way to deal with that in your production model that is in accordance with your corporate logic.
Here are some of the issues in my view:
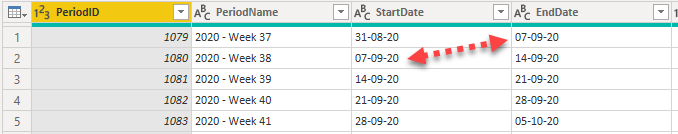
- Cycle table includes the same Enddate as Startdate for a new period, so that date is present in two periods. My solution. Kept the Startdate and excluded the Enddate, this generates 7 days for the record.
- Based on these ranges I’ve created a record for each date but there’re not enough records to cover an entire year, which is a date table requirement in order for Time Intelligence functions to work (see link prev reply)
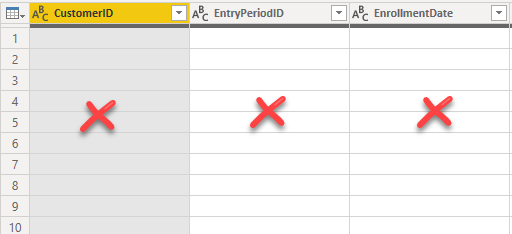
- Your DIM Customer table contained blanks. My solution. I removed all blank records
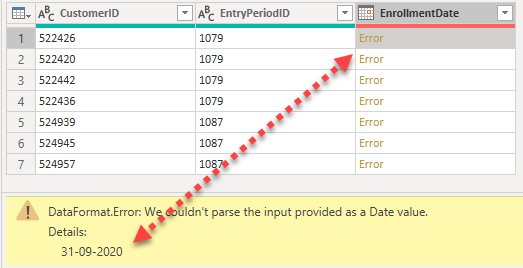
- Your Customer table contains an invalid date. My solution. Removed errors.
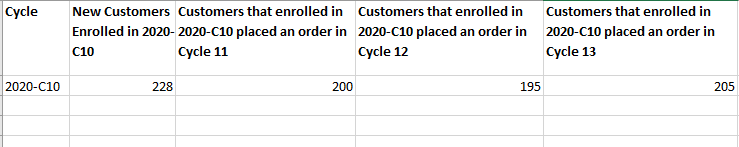
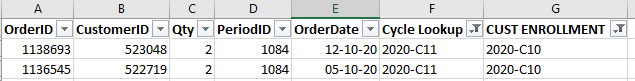
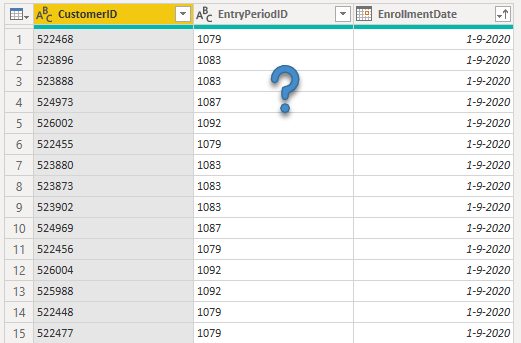
- Your Customer table includes an EntryPeriodID and EnrollmentDate but the EntryPeriodID doesn’t match the PeriodID based on the EnrollmentDate. As shown here this date is assigned to multiple PeriodID’s that doesn’t seem correct.
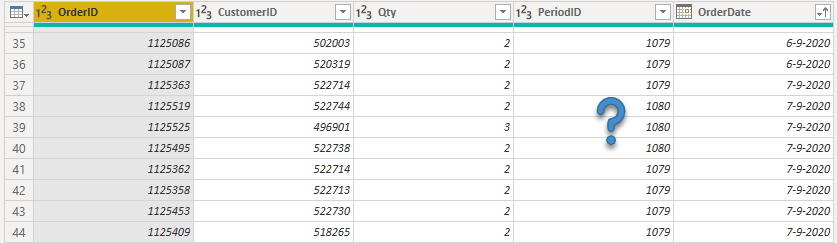
- The same issue is present in the FACT Sales table, where the OrderDate doesn’t match the assigned PeriodID, if checked against the date table.
For both issue 5 and 6 ideally you would only keep the Date field and lookup the PeriodID in the Date table. Unless of course I interpreted this wrong and there is no relation between these 2 fields…
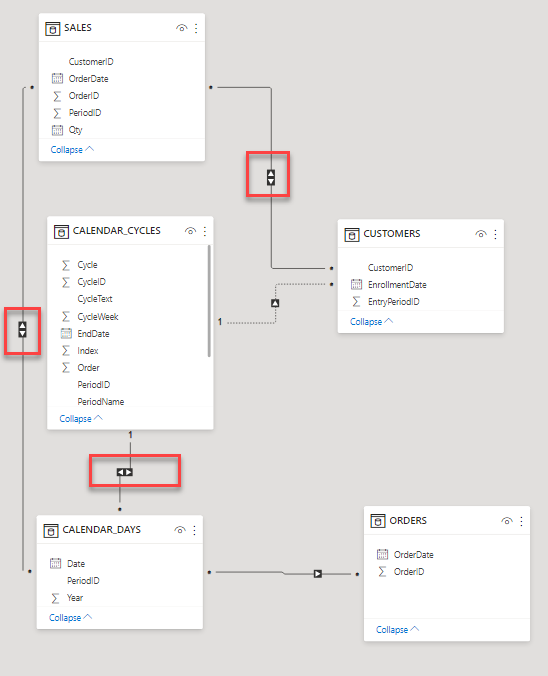
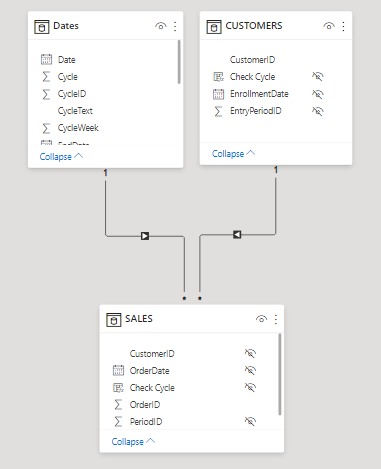
This is what the new model looks like
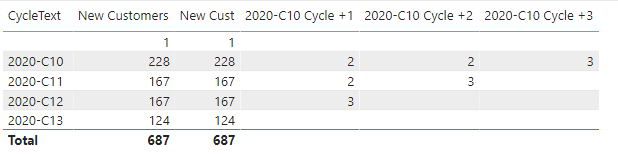
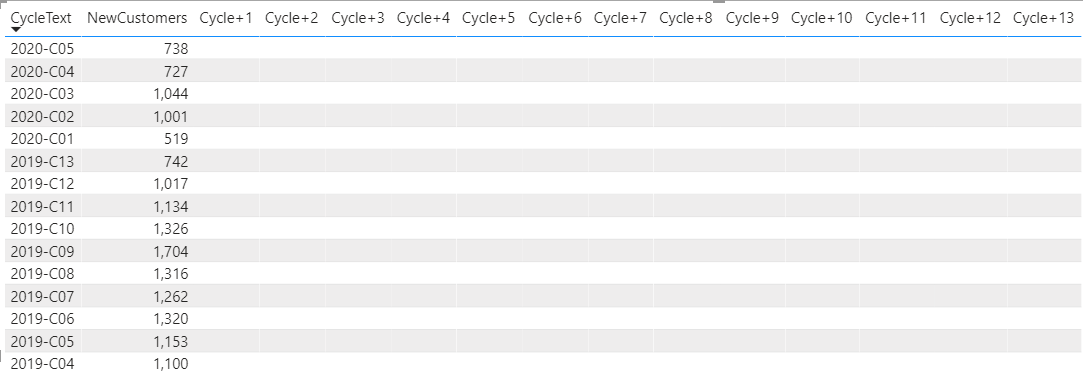
And these are the new measures, for new customers used TREATAS because there is no relationship between the DIM Date and DIM Customer.
New Cust =
VAR myCust =
    CALCULATETABLE(
        VALUES( CUSTOMERS[CustomerID] ),
        TREATAS( VALUES( Dates[Date] ), CUSTOMERS[EnrollmentDate] )
    )
RETURN

COUNTROWS( myCust )
and
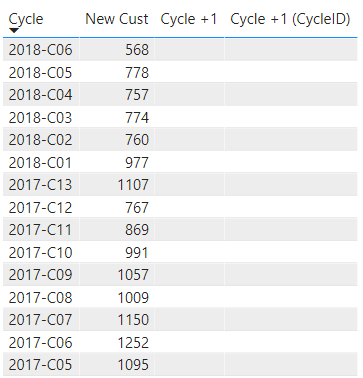
Cycle +1 (CycleID) =
VAR FirstCycle = MINX( ALLSELECTED( Dates[Cycle] ), [Cycle] )
VAR _Cycle = MAX( Dates[Cycle] )
VAR FirstCust =
    CALCULATETABLE(
        VALUES( CUSTOMERS[CustomerID] ),
        TREATAS( VALUES( Dates[Date] ), CUSTOMERS[EnrollmentDate] ),
        Dates[Cycle] = FirstCycle
    )
VAR CustOrders =
    CALCULATETABLE(
        VALUES( SALES[CustomerID] ),
        Dates[Cycle] = _Cycle +1,
        ALL( Dates[CycleText] )
    )
VAR _Result = INTERSECT( FirstCust, CustOrders )
RETURN

COUNTROWS( _Result )
However it seems you still have a lot of work ahead of you before you can get back to the DAX analysis…
Here’s my reworked file, I hope you find some elements useful - just add the CSV folder path to the list in the FileFolderLocation parameter and all Queries will be restored.
CUSTOMERS.csv (53.5 KB)
ORDERS.csv (19.8 KB)
SALES.csv (37.5 KB)
eDNA - Retention cleaned.pbix (2.9 MB)
We don’t offer consulting on the forum, please mark this thread as solved and if you need further in depth help sorting your model and developing reports please contact a BI professional for assistance.