Hi everyone, I hope everyone had a nice and safe holiday period and happy new year to all.
This is my first post and likely the first of many. I have been working through the variousTSA and IATA Traffic Data.pbix (272.5 KB) videos and posts and it is all really helpful stuff so thank you to everyone for their time and effort.
This query relates to one of my first BI models, the model (attached) is taking passenger data from the TSA website of daily passenger numbers. I have ben able to get most of the data I need but I am having a couple of small issues.
Issue a) Charts that include cumulate numbers when slicer is on
I have used measures to calculate the rolling 7 day average passenger numbers with this formula:
7 Day Rolling Average = divide( [7 Day Passenger Numbers], 7,0)
I have a similar formula for 2019 passengers I then chart these in an Area Chart and I get a nice chart like this:
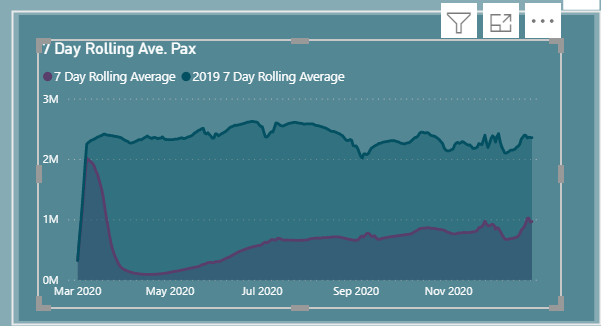
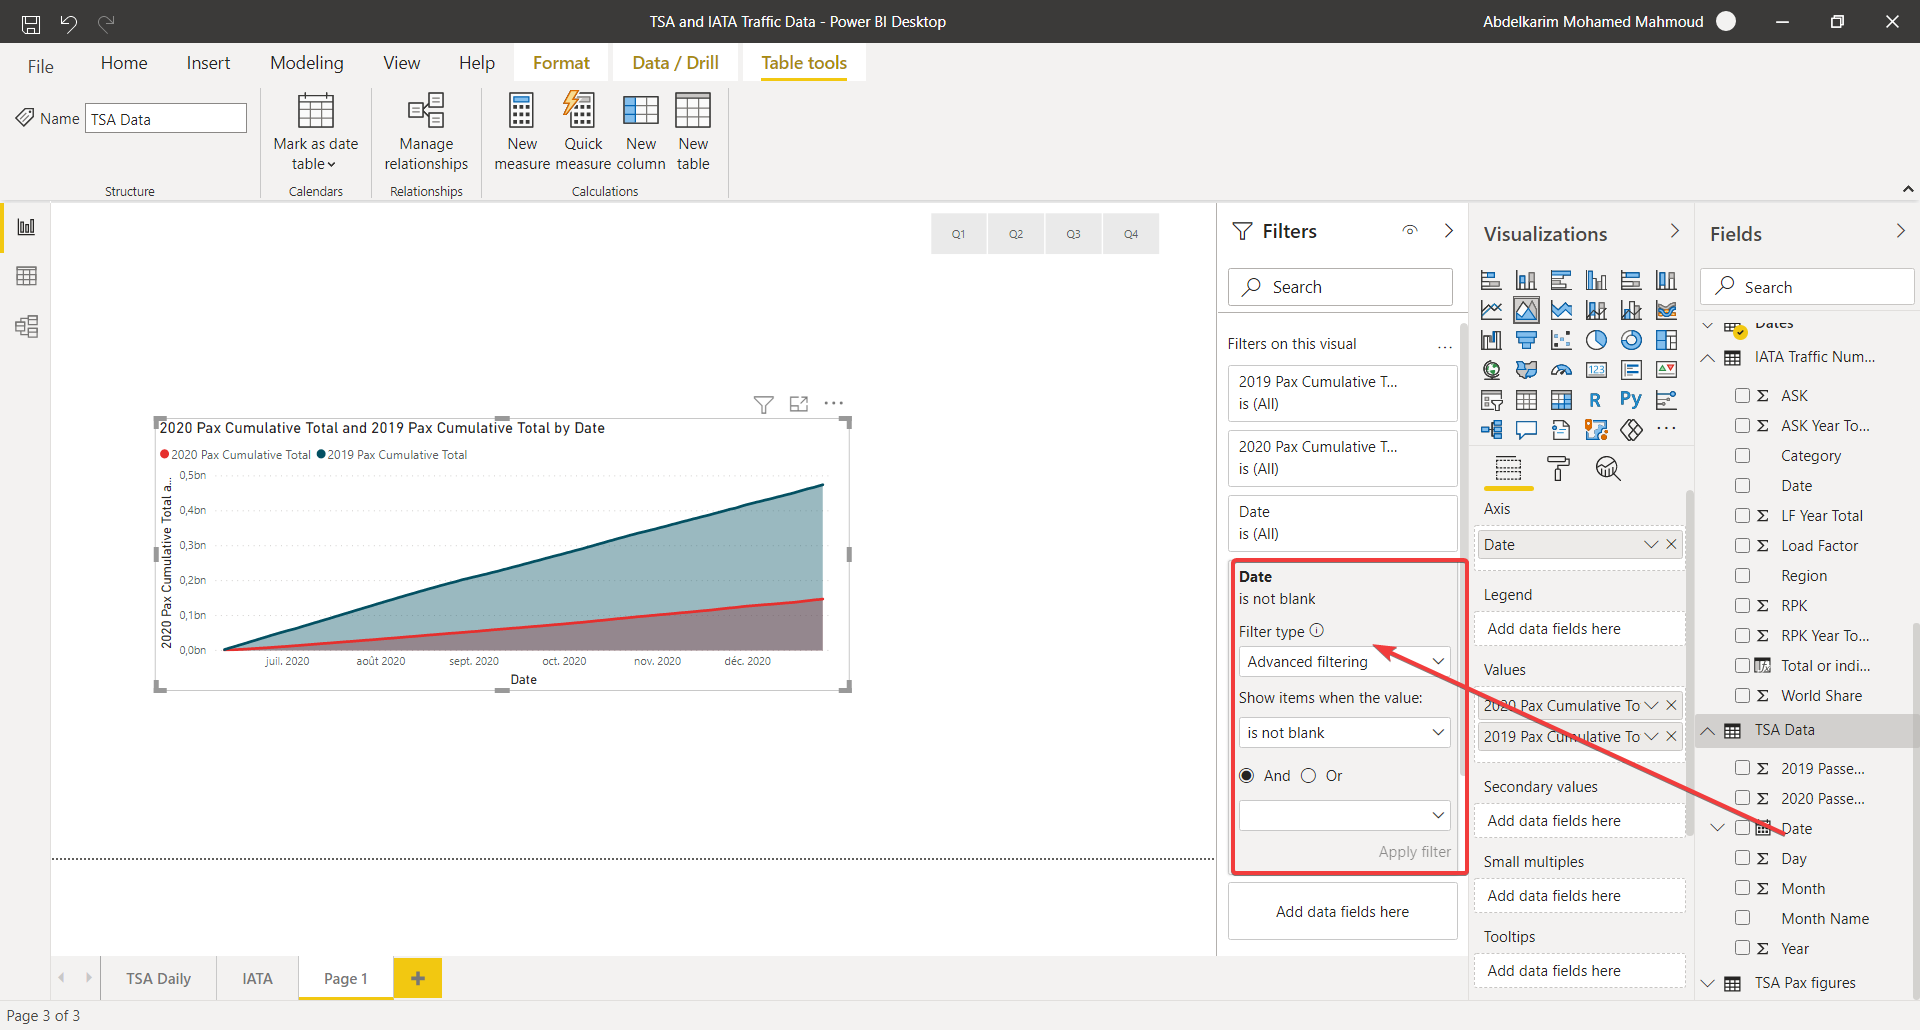
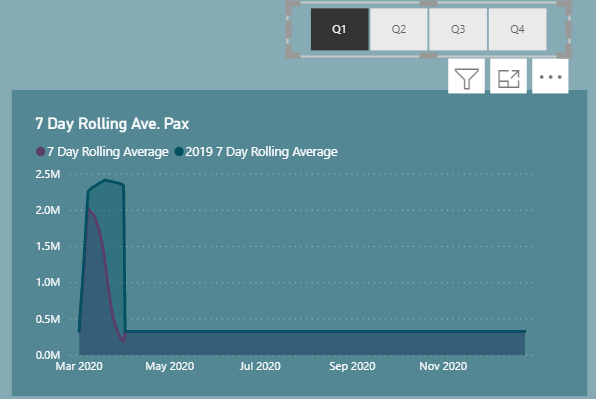
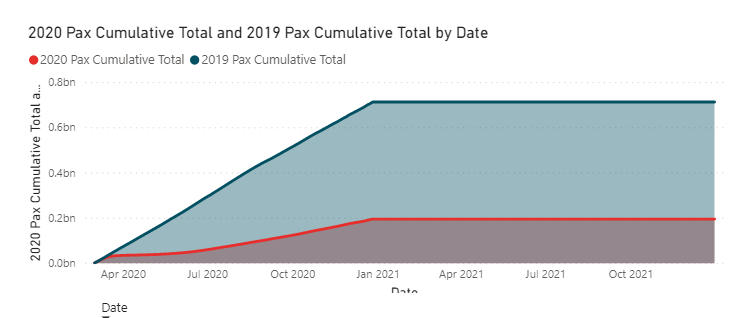
However In the slicer I have Quarters and my date table query was set up to go to 31 Dec 2021. When I selected Q1 for example I get this tail out to the right:
Where as in another chart which is just the daily amount it adjusts accordingly to Q1 and I get this chart
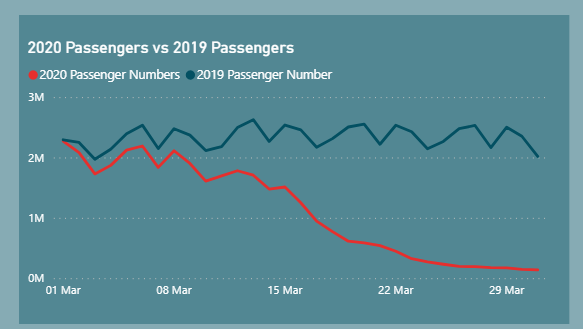
I suspect it might be my formula that is not dynamic enough to work with the slicer but any thoughts and support would be welcome.
Issue B) Date Table
I set up the initial date table to cover 31/12/2017 to 30/12/2021, however the data that is available from the website only covers 1/3/2020 to the last date (updated daily). This is causing issues with my cumulative charts that go all the way out to 2021.
I can change the slicer to year and it will work better or quarter in year but I was wondering if there is anyway to just cap the date to the last day that there is actual data?
A second issue I have with this Date table range is the calculation of the 7 Day passenger numbers. The formula I have written is:
7 Day Passenger Numbers = calculate([2020 Passenger Numbers], DATESINPERIOD(‘TSA Pax figures’[Date],lastdate(‘TSA Pax figures’[Date]),-7,day))
The problem this creates is that for every date before the first date where there is actual data (1/3/20) the 7 day Passenger number is the same value as the first day of data. So for example in 2017 the 7 day passenger numbers is the value of the number of passengers on the 1 March 2020. On 1st March 2020 there were 2,280,522 passenger recorded and this becomes the default 7 day number for all dates prior to 1 March 2020.
Issue C) Growth
I have been trying to calculate the growth rate of the 7 day rolling average passenger numbers for 2020 and 2019. I want to do this by comparing the reference 7 day rolling average amount to the 7 day day rolling average amount 7 days earlier. So effectively this is the weekly average growth rate. The DAX I used is
7 Day Rolling Average Growth =
calculate (‘Key Measures’[7 Day Rolling Average],
DATESINPERIOD(Dates[Date], min(Dates[Date]),7,day))
This gives me the right result however I have an issue with the first periods which is linked to Issue B above. I cannot seem to get a growth formula that will only start after there is 7 days of data so that you can see actual % growth. The first few days are completely skewed by the date table issue.
Issue D) Move to 2021
The website (https://www.tsa.gov/coronavirus/passenger-throughput) provides two columns of data being Total Passenger Throughput and Total Traveler Throughput (1 Year Ago - Same Weekday). Up until the turn of the year this was not an issue for me as I just categorized these as 2019 and 2020. However clearly this has changed since the turn of the year.
I was trying to figure out how I might transform the data so that is is all in one column with the date beside it. I can figure it out in excel but I am struggling to get to grips with how I might be able to transform the data and dax I might need to get the passenger data into a single line string with appropriate dates beside it.
Thank you in advance all and I look forward to being active on the forum in 2021.
Best
Ronan