Creating Date Table Dimension using only Fiscal Quarter Data

Hi Experts,

Need a help on creating the Date table. the challenge here is I have only one date column which is FiscalYearQuarter but doesn’t know how to create a Date table dimension using this column. Without the date table I am having a challenge of creating QoQ, YoY, and QoQ% and YoY%

Each Quarter read below formate

Fiscal Year Quarter Month No
Q1 11, 12, 1
Q2 2, 3, 4
Q3 5, 6, 7
Q4 8, 9, 10

Here is the sample data I need to create below time intelligence functions.

FiscalYearQuarter Rev QoQ QoQ% YoY Yoy%
FY2019-Q1 0
FY2019-Q2 0
FY2019-Q4 0
FY2019-Q2 0
FY2019-Q3 0
FY2019-Q3 0
FY2019-Q1 0
FY2019-Q4 0
FY2020-Q1 0
FY2019-Q1 0
FY2020-Q1 0
FY2020-Q1 5432.05919
FY2020-Q1 2154.202289
FY2019-Q1 6.496337964
FY2019-Q1 10835.59399
FY2019-Q1 794.49843
FY2020-Q1 34067.19005
FY2020-Q1 8359.115519
FY2019-Q2 33.39814205
FY2019-Q3 31.66243372
FY2019-Q4 31.93485309
FY2019-Q2 73144.82287
FY2019-Q2 14193.66268
FY2019-Q2 41633.7085
FY2019-Q3 72481.77283
FY2019-Q3 15077.65191
FY2019-Q3 42978.97382
FY2019-Q4 74506.62894
FY2019-Q4 15696.17554
FY2019-Q4 41728.46084

Thanks in advance for the help.

For any type of time intelligence you need a full date table, so at a daily granularity, otherwise DAX time intelligence functions will not work properly.

You can use the Date table here and enter a FiscalStartMonth = 11

Hi @putturps,

You’re in a bit of trouble because your FQ doesn’t start on a regular Q, so rendering the extended date QuarterOffset useless… However we can define a Custom FQ in both Date- and Fact table to overcome that issue. First to modify the date table M function, replace the last section with this code.

IdentifyCurrentDate = Table.SelectRows(InsertYearOffset, each ([Date] = CurrentDate)),
CurrentFiscalYear = IdentifyCurrentDate{0}[Fiscal Year], 
InsertFYoffset = Table.AddColumn(InsertYearOffset, "FiscalYearOffset", each try Number.From(Text.Range([Fiscal Year],2,2)) - Number.From(Text.Range(CurrentFiscalYear,2,2)) otherwise null, type number),
InsertCustomFQ = Table.AddColumn(InsertFYoffset, "Custom FQ", each Number.From( Text.End( [Fiscal Year], 2 ) )*10 + Number.From( Text.End( [Fiscal Quarter], 1 ) ), type number),
RemoveToday = if EndDate < CurrentDate then Table.SelectRows(InsertCustomFQ, each ([Date] <> CurrentDate)) else InsertCustomFQ,
InsertCompletedWeek = Table.AddColumn(RemoveToday, "WeekCompleted", each [WeekEnding] < Date.From(Date.EndOfWeek(CurrentDate)), type logical),
InsertCompletedMonth = Table.AddColumn(InsertCompletedWeek, "MonthCompleted", each [MonthEnding] < Date.From(Date.EndOfMonth(CurrentDate)), type logical),
InsertCompletedQuarter = Table.AddColumn(InsertCompletedMonth, "QuarterCompleted", each Date.EndOfQuarter([Date]) < Date.From(Date.EndOfQuarter(CurrentDate)), type logical),
InsertChangedType = Table.TransformColumnTypes(InsertCompletedQuarter,{{"Year", Int64.Type}, {"QuarterOfYear", Int64.Type}, {"MonthOfYear", Int64.Type}, {"DayOfMonth", Int64.Type}, {"DateInt", Int64.Type}, {"DayOfWeek", Int64.Type}, {"ISO Weeknumber", Int64.Type}, {"WeeknYear", Int64.Type}, {"MonthnYear", Int64.Type}, {"QuarternYear", Int64.Type}, {"Fiscal Period", Int64.Type}, {"WeekOffset", Int64.Type}, {"MonthOffset", Int64.Type}, {"QuarterOffset", Int64.Type}, {"YearOffset", Int64.Type}, {"FiscalYearOffset", Int64.Type}, {"Custom FQ", Int64.Type}})
  in
  InsertChangedType
in
fnDateTable

.
Next we’ll have to do some work on the Fact data, you provided.

  1. Split your FY+Q into separate columns, matching the Date table structure.
    image
  2. Since the highest cardinality is on FQ, I used Grouped By to limit the number of rows
    image
  3. Added FY Offset and the custom FY+FQ column
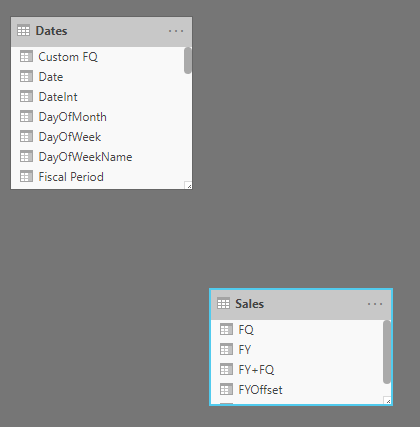
  4. The Model. Because we can’t create a One-to-Many relationship between the Fact and Date table, we won’t create a relationship.
    image
  5. Next created a couple of measures

.

Total sales = 
CALCULATE( SUM( Sales[Sales] ),
    FILTER( VALUES( Sales[FY+FQ] ), Sales[FY+FQ] IN VALUES( Dates[Custom FQ] ))
)

.

Sales LQ = 
VAR ThisFQ = SELECTEDVALUE( Dates[Custom FQ] )
VAR LQ = CALCULATE( MAX( Dates[Custom FQ] ), ALL( Dates ), Dates[Custom FQ] < ThisFQ )
VAR FirstQ = CALCULATE( MIN( Dates[Custom FQ] ), ALLSELECTED( Dates ))
VAR LastQ = CALCULATE( MAX( Dates[Custom FQ] ), ALLSELECTED( Dates ))
VAR Qrange = CALCULATETABLE( VALUES( Dates[Custom FQ] ), FILTER( ALL( Dates ), Dates[Custom FQ] >=FirstQ && Dates[Custom FQ] <= LastQ ))
RETURN 

IF( ISINSCOPE( Dates[Fiscal Quarter] ),
    CALCULATE( SUM( Sales[Sales] ),
        FILTER( VALUES( Sales[FY+FQ] ), Sales[FY+FQ] IN { LQ } )),
    CALCULATE( SUM( Sales[Sales] ),
        FILTER( VALUES( Sales[FY+FQ] ), Sales[FY+FQ] IN Qrange ))
)

.

Sales LY = 
CALCULATE( SUM( Sales[Sales] ),
    FILTER( VALUES( Sales[FYOffset] ), Sales[FYOffset] +1 IN VALUES( Dates[FiscalYearOffset] ))
)

.
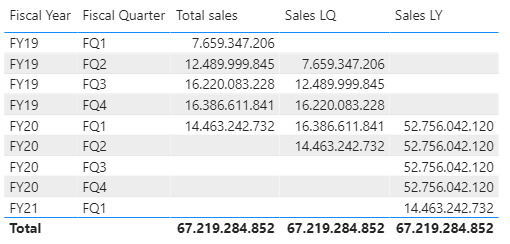
With this result.
image

Here’s my sample file. I hope this is helpful.
eDNA - FY & FQ custom logic.pbix (162.8 KB)

2 Likes

Hello @putturps,

You can create a “Date Table” by loading the given code in the Advanced Editor. This code has been provided by the Enterprise DNA in their Resources.

let fnDateTable = (StartDate as date, EndDate as date, FYStartMonth as number) as table =>
  let
    DayCount = Duration.Days(Duration.From(EndDate - StartDate)),
    Source = List.Dates(StartDate,DayCount,#duration(1,0,0,0)),
    TableFromList = Table.FromList(Source, Splitter.SplitByNothing()),   
    ChangedType = Table.TransformColumnTypes(TableFromList,{{"Column1", type date}}),
    RenamedColumns = Table.RenameColumns(ChangedType,{{"Column1", "Date"}}),
    InsertYear = Table.AddColumn(RenamedColumns, "Year", each Date.Year([Date]),type text),
    InsertYearNumber = Table.AddColumn(RenamedColumns, "YearNumber", each Date.Year([Date])),
    InsertQuarter = Table.AddColumn(InsertYear, "QuarterOfYear", each Date.QuarterOfYear([Date])),
    InsertMonth = Table.AddColumn(InsertQuarter, "MonthOfYear", each Date.Month([Date]), type text),
    InsertDay = Table.AddColumn(InsertMonth, "DayOfMonth", each Date.Day([Date])),
    InsertDayInt = Table.AddColumn(InsertDay, "DateInt", each [Year] * 10000 + [MonthOfYear] * 100 + [DayOfMonth]),
    InsertMonthName = Table.AddColumn(InsertDayInt, "MonthName", each Date.ToText([Date], "MMMM"), type text),
    InsertCalendarMonth = Table.AddColumn(InsertMonthName, "MonthInCalendar", each (try(Text.Range([MonthName],0,3)) otherwise [MonthName]) & " " & Number.ToText([Year])),
    InsertCalendarQtr = Table.AddColumn(InsertCalendarMonth, "QuarterInCalendar", each "Q" & Number.ToText([QuarterOfYear]) & " " & Number.ToText([Year])),
    InsertDayWeek = Table.AddColumn(InsertCalendarQtr, "DayInWeek", each Date.DayOfWeek([Date])),
    InsertDayName = Table.AddColumn(InsertDayWeek, "DayOfWeekName", each Date.ToText([Date], "dddd"), type text),
    InsertWeekEnding = Table.AddColumn(InsertDayName, "WeekEnding", each Date.EndOfWeek([Date]), type date),
    InsertWeekNumber= Table.AddColumn(InsertWeekEnding, "Week Number", each Date.WeekOfYear([Date])),
    InsertMonthnYear = Table.AddColumn(InsertWeekNumber,"MonthnYear", each [Year] * 10000 + [MonthOfYear] * 100),
    InsertQuarternYear = Table.AddColumn(InsertMonthnYear,"QuarternYear", each [Year] * 10000 + [QuarterOfYear] * 100),
    ChangedType1 = Table.TransformColumnTypes(InsertQuarternYear,{{"QuarternYear", Int64.Type},{"Week Number", Int64.Type},{"Year", type text},{"MonthnYear", Int64.Type}, {"DateInt", Int64.Type}, {"DayOfMonth", Int64.Type}, {"MonthOfYear", Int64.Type}, {"QuarterOfYear", Int64.Type}, {"MonthInCalendar", type text}, {"QuarterInCalendar", type text}, {"DayInWeek", Int64.Type}}),
    InsertShortYear = Table.AddColumn(ChangedType1, "ShortYear", each Text.End(Text.From([Year]), 2), type text),
    AddFY = Table.AddColumn(InsertShortYear, "FY", each "FY"&(if [MonthOfYear]>=FYStartMonth then Text.From(Number.From([ShortYear])+1) else [ShortYear]))
in
    AddFY
in
    fnDateTable

After loading the “Date Table” in your data model, you can create a calculated column by writing the following DAX which will ultimately help you to categorize your Quarters as per the Financial Year. In this case, the Financial starts from Nov month. So it will be as follows -

FY Quarters = 
SWITCH( TRUE() , 
     Dates[MonthOfYear] = 11 , "Q1" , 
     Dates[MonthOfYear] = 12 , "Q1" , 
     Dates[MonthOfYear] = 1 , "Q1" , 
     Dates[MonthOfYear] = 2 , "Q2" , 
     Dates[MonthOfYear] = 3 , "Q2" , 
     Dates[MonthOfYear] = 4 , "Q2" , 
     Dates[MonthOfYear] = 5 , "Q3" , 
     Dates[MonthOfYear] = 6 , "Q3" , 
     Dates[MonthOfYear] = 7 , "Q3" , 
     Dates[MonthOfYear] = 8 , "Q4" , 
     Dates[MonthOfYear] = 9 , "Q4" , 
     Dates[MonthOfYear] = 10 , "Q4" , 
BLANK() )

After this you will be able to analyze the numbers as per the Fiscal Year Quarter.

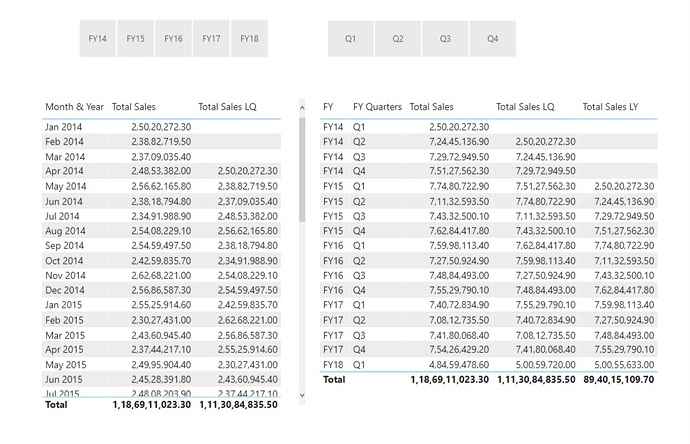
Have also attached the Date and PBIX file the reference alongwith the snapshot of the working.

Hoping this solution will meet your requirements.

Thanks and Regards,
Harsh

Power BI Date Table code.txt (2.8 KB)

Creating Date Table Dimension using only Fiscal Quarter Data.pbix (1.0 MB)

1 Like

Thank you so much, Melissa, It works as expected :smiley: :ok_hand: :handshake:.

Definitely all of you here in this forum are really really experts and any request we have the solution available here.

Thanks Harsh for the solution. Definitely this is an alternative solution when I have the date column.

Appreciate for your help and guidance.

To the contributor of this post. Thank you for sharing your experiences around Power BI, please don’t hesitate to add more discussion or add value to wherever you think you possess the experience or knowledge that can help others in our Ecosystem Group. You can also help us in improving the Support forum further by answering the Enterprise DNA Forum User Experience Survey. We appreciate the initiative and your help in this group!