I’m new to Power BI and I need to learn how to calculate a count of events in one table based on if the event date is before or after a specific date with another table. I thought the E-DNA youtube clip, “Calculate The Occupancy Days Per Month” may work for me (with a couple of alterations using EDate etc), but the problem I have is between two tables with a many to many connection.
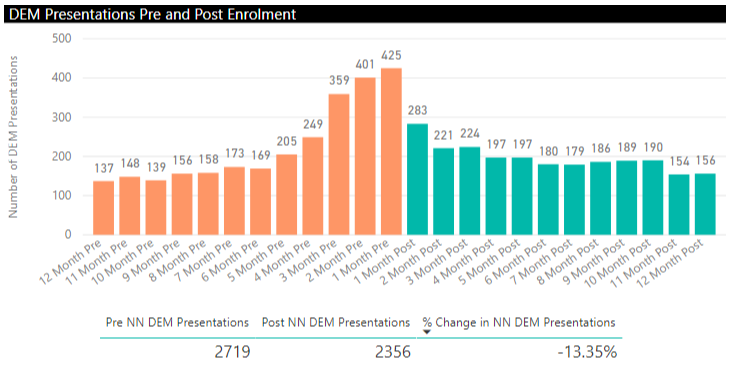
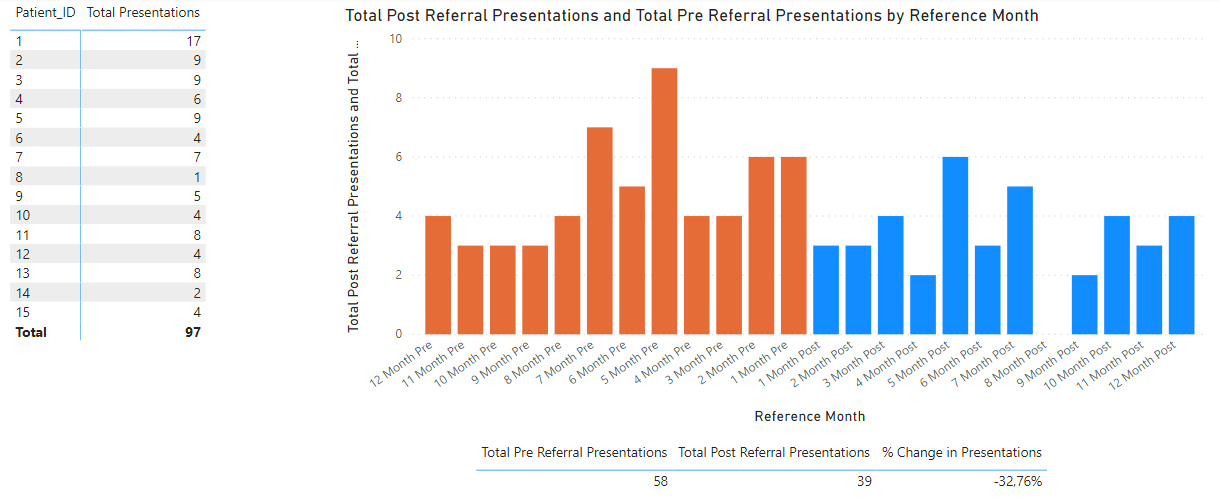
Our service receives referrals and I’m wanting to show the impact of our service by a 12month pre and post comparison of how often our patients present to emergency or are admitted etc. Each referral has its own unique ID and a First Appointment date which is used as the reference date for the pre and post comparison. This information is in the Referrals table. Each referral has a single patient associated to it and each patients has their own unique ID. However, over time we now have multiple referrals for individual patients (i.e. 1 patient can have up to 4 referrals).
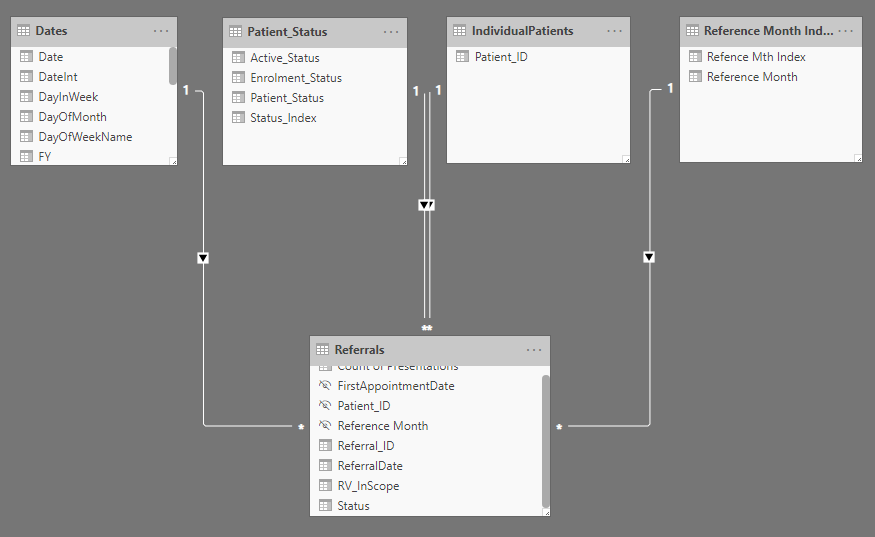
The service events (i.e. emergency presentations) sit in their own table where each event is associated with a single patient ID. The only association between the Referral table and the Service Event table is the patient ID; hence a many to many relationship due to patient’s having multiple referrals.
I have created a patient ID table which contains a distinct set of patient IDs. However, I need to do the comparison on the Referral ID and its associated First Appointment date, not just the distinct patient ID; I’m not sure how to overcome the many to many relationship.
Currently I’m undertaking performing the pre and post calculations in excel and bring in the results to PowerBI, which is a laborious and additional process which I’m hoping to automate in PowerBI, which will also allow for much deeper analysis with associated event specific details.
Thanks for the detailed explanation. Can you provide an example may be of one Referral Id/Patient ID of what you are calculating.
Also, you mentioned “Currently I’m undertaking performing the pre and post calculations in excel”. In attached xlsx, I can’t see those calculations. Can you provide the excel with calculations.
Many to many relationships can make it very difficult for you to achieve the right result. Is there any chance you can reshape the data to create one to many relationships?
Once you fixed that it you could make calculations work much easier.
The Referral IDs are simply a numbered index 1,2,3… and the Patient IDs are 10 digit numbers (each patient gets 1 unique 10 digit number) - their relationship is directly demonstrated in the Referrals table (except the Patient would be 10 digits).
I cannot see a way to reshape the tables to create a 1 to many relationship as both tables contain multiple other fields. The only connection between the 2 Fact tables is the date and Patient IDs. The Patient IDs have been isolated into their own table with only the distinct figures.
I have added the tables to the in the files below of how I’m currently counting the pre and post events in Excel then unpivoted in PowerBI.
I hope I’ve understood your requirement, if not please let me know and provide more context. Thanks.
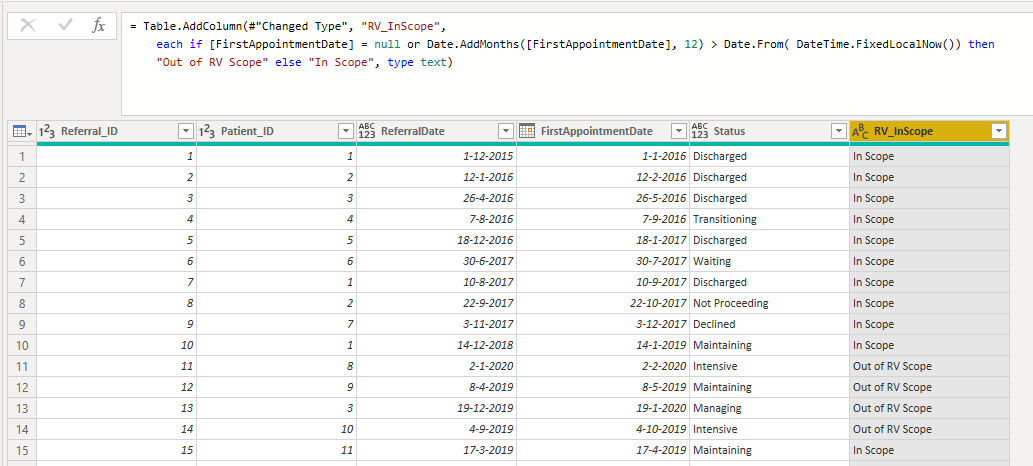
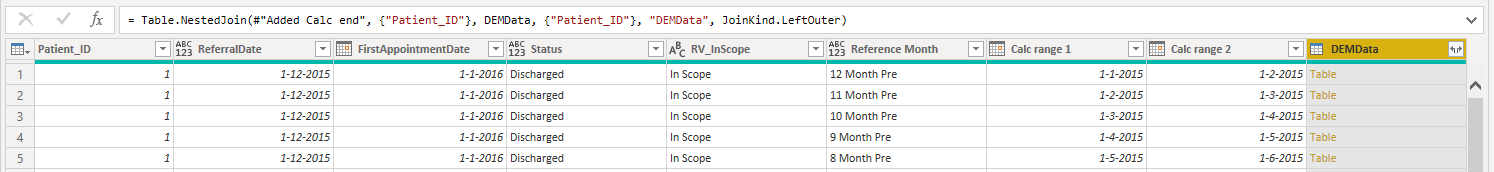
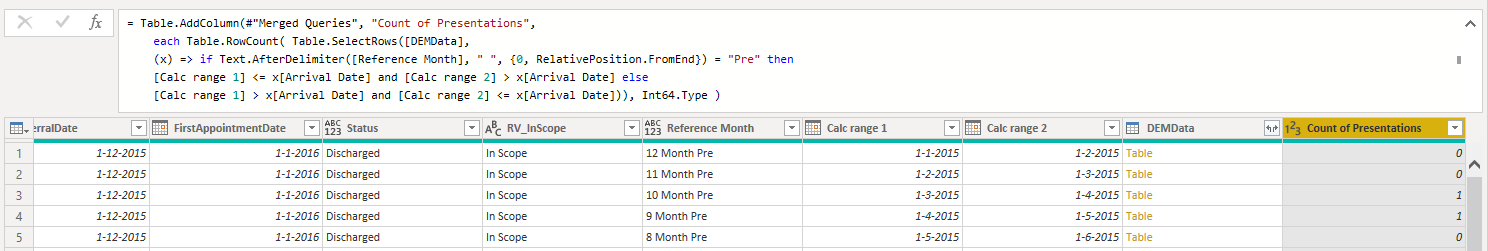
Because what I did was recreate your Excel logic inside Power Query and here’s how:
I started in your Referrals Query and added a Custom Column for RV_InScope
Hi @DougK, a response on this post has been tagged as “Solution”. If you have a follow question or concern related to this topic, please remove the Solution tag first by clicking the three dots beside Reply and then untick the check box. Thanks!
Thank you for this solution @Melissa. I was able to recreate what I was after in my own version of the example files and it worked as hoped. However, when I’ve applied to my real data sets, on Close and Apply it took over 2hrs of “Working on it” and then the entire file froze.
In adding the Reference Months to the live Referrals table, it ends up being of 35,000 rows long, then combined with the real DEM data which is around 20,000 rows long, everything ground to a holt.
I know PowerBI can handle tables with millions of rows of data, so I’m not sure why everything slowed so much. The real file size did jump from ~5.5MB to ~7.5MB, but looking up why my Power BI is so slow the internet suggests PowerBI desktop should be able to handle 1GB files no troubles.
If there’s nothing further I can to do speed things up, I’m happy to mark as solved as you have provided a method.
Thank you very much. Your assistance is greatly appreciated.
I thought I’d try running this solution in a separate PBI file them importing the resulting table - still working on this though as this is just one of 6 similar metrics I need to run (the others are re-presentations, admissions, re-admissions, length of stay, etc, etc). So if I can get this one working I’m sure I can work out the rest with some tweaking.
I can’t share the actual files with you, however I’ve changed the example file to be more representative of the actual table sizes. ExampleTables.xlsx (1.1 MB)
Well @DougK applied several strategies to improve the performance:
Changed the M code a little so to only create “Reference Month” rows for “In Scope” records AND Merged the minimal required number of DEMData columns for the row count.
Load CSV instead of Excel files
Changed this files Data load settings, disabled both Background data and Parallel loading of tables
This reduced the load time to just around 15 minutes on my laptop with the new dataset. So I expect this will improve performance on you end considerably as well.
Hi @DougK, we’ve noticed that no response has been received from you since the 24th of April. We just want to check if you still need further help with this post? In case there won’t be any activity on it in the next few days, we’ll be tagging this post as Solved. If you have a follow question or concern related to this topic, please remove the Solution tag first by clicking the three dots beside Reply and then untick the checkbox. Thanks!