Hi All,
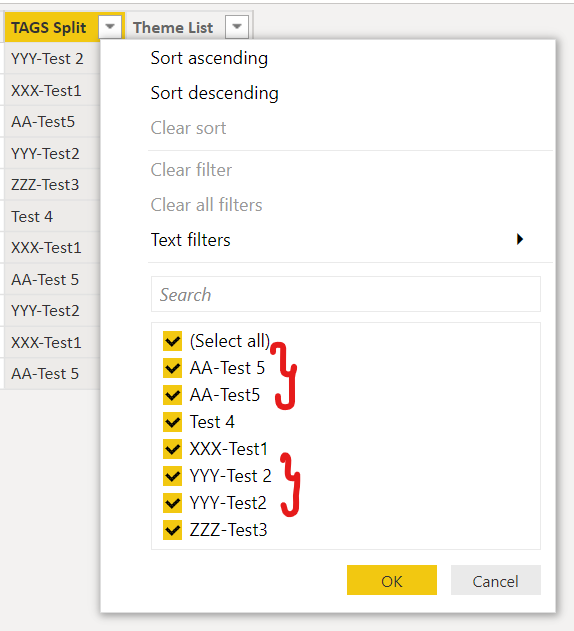
I need your assistance to sort out a little problem I have run into. I have a dataset with ID column and a Themelist column. Each ID could have one or multiple Themelists. Basically, I want to count every single themelist and plot it in a pie chart. Usually in PBI, I would have used a split by parameter, then unpivot the data and I would of got my visual. Also, I need to pick only certain themelists in my counts. The problem I have is, I am accessing a direct query from a data warehouse and I don’t have build permission to modify the dataset. So, is it possible to do this via dax measure instead?
Problem:
- Count all themelists in one column per ID
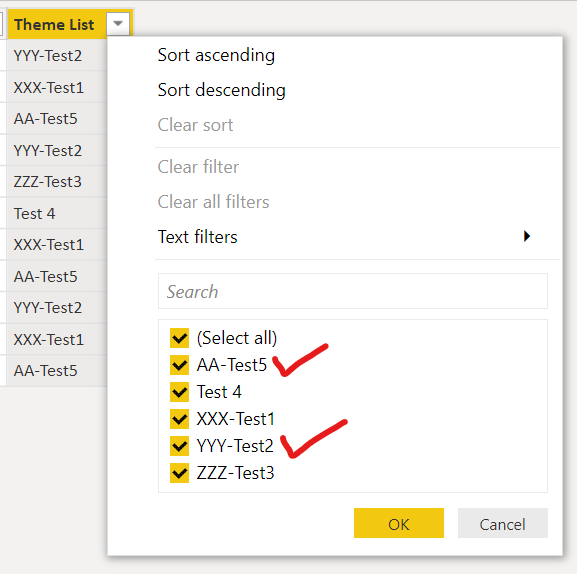
- Count only the themelists that starts with “XXX-” string in front of the themelist description (ie. XXX-Test1, AA-Test5)
- Ignore all other themelist descriptions in the count
Solution:
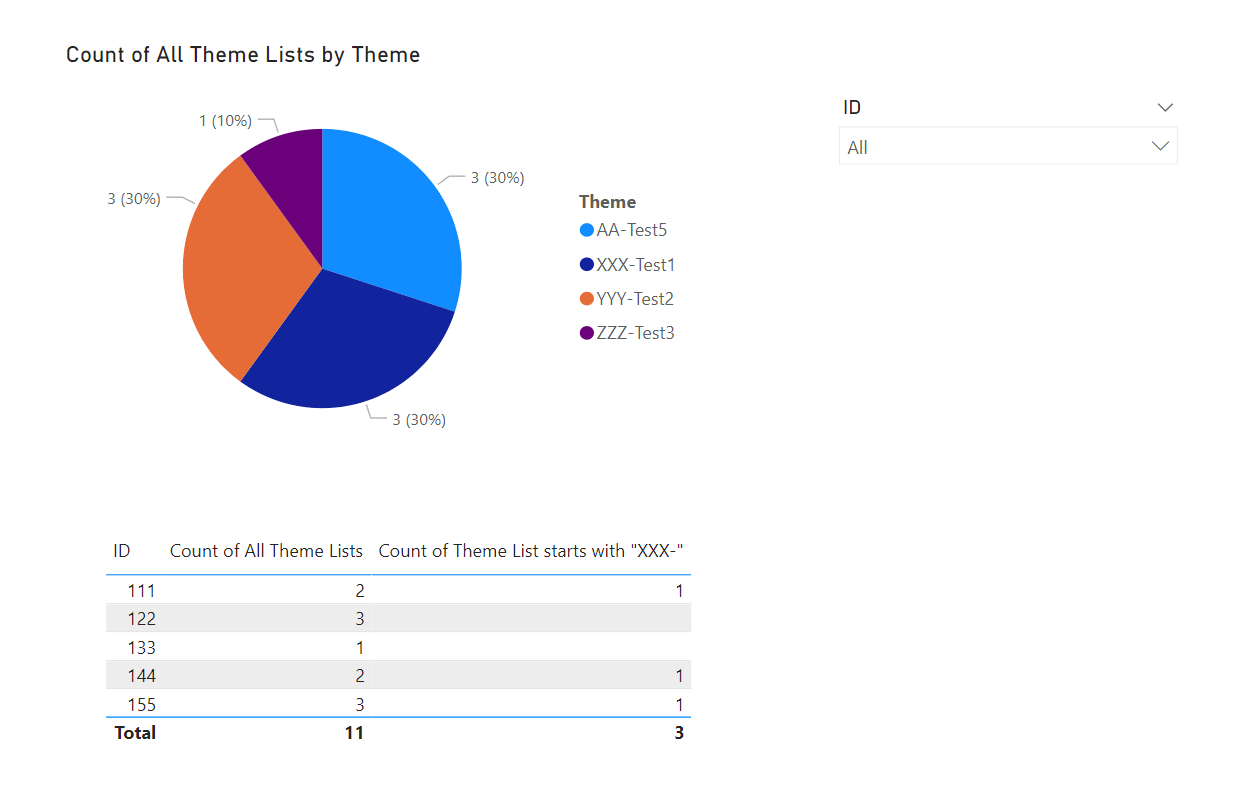
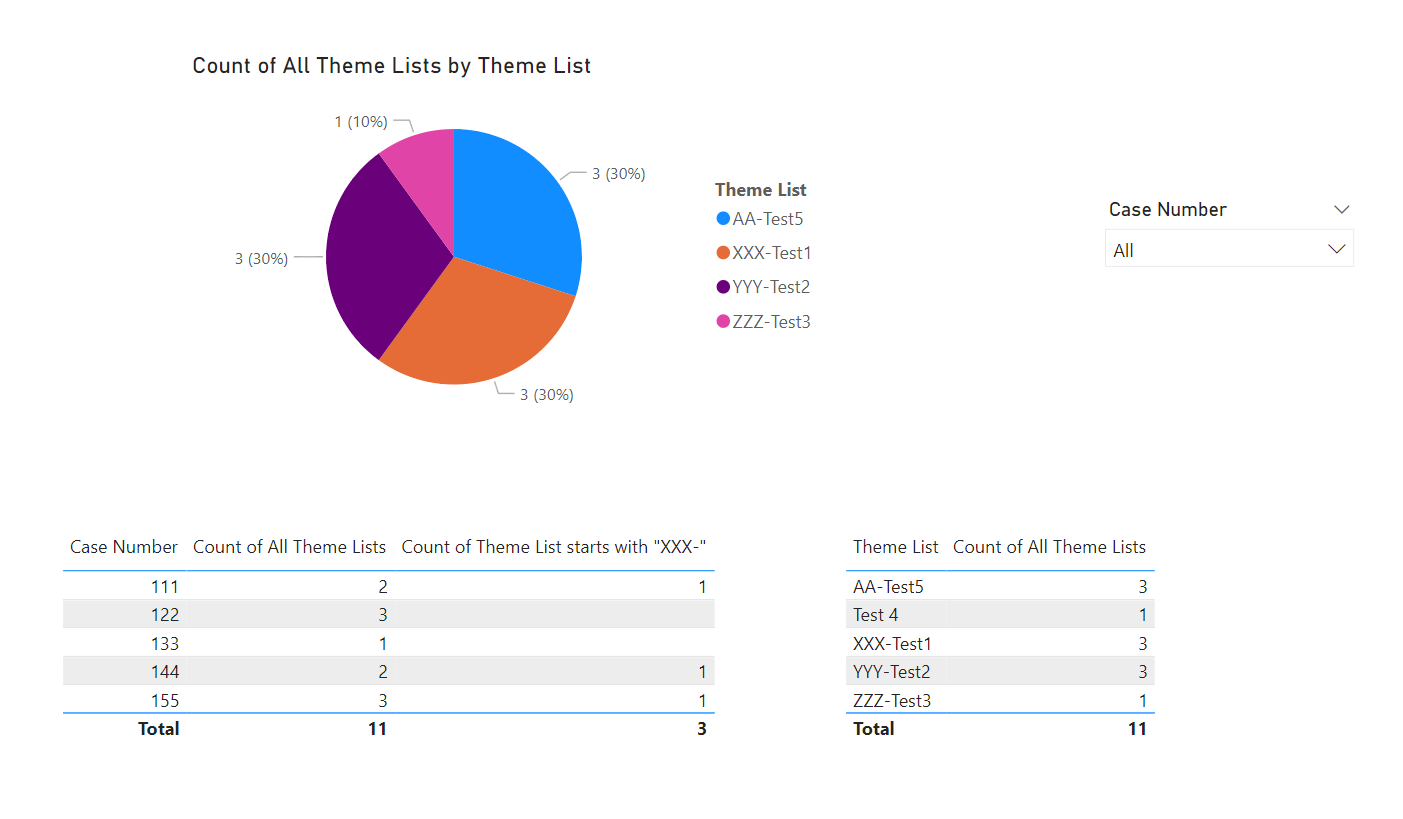
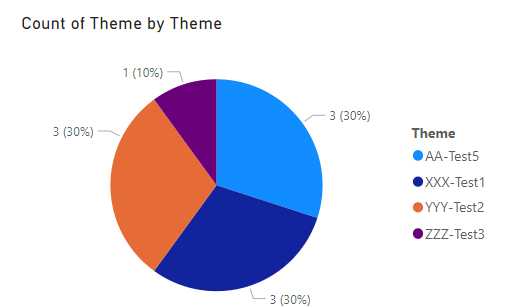
I have attached a test data input file and the pbix file that shows the solution I need. Here is the visual I am trying to create by using dax measure instead.
Themelist.xlsx (15.5 KB)
Themelist.pbix (26.6 KB)
I will greatly appreciate if you can assist me to produce this solution by using a dax measure. Thank you.