Harsh
July 28, 2021, 2:24pm
2
Hello @Harris ,
Thank You for posting your query onto the Forum.
Well the reason why the formatting is not working for the “Conversion ” metric is because you’ve used the “FORMAT() ” function and the only disadvantage of this function is that it converts the value to a “Text ” in a specified format.
Now, since the value is converted into a text format, conditional formatting will not work since it longer retains any numerical value.
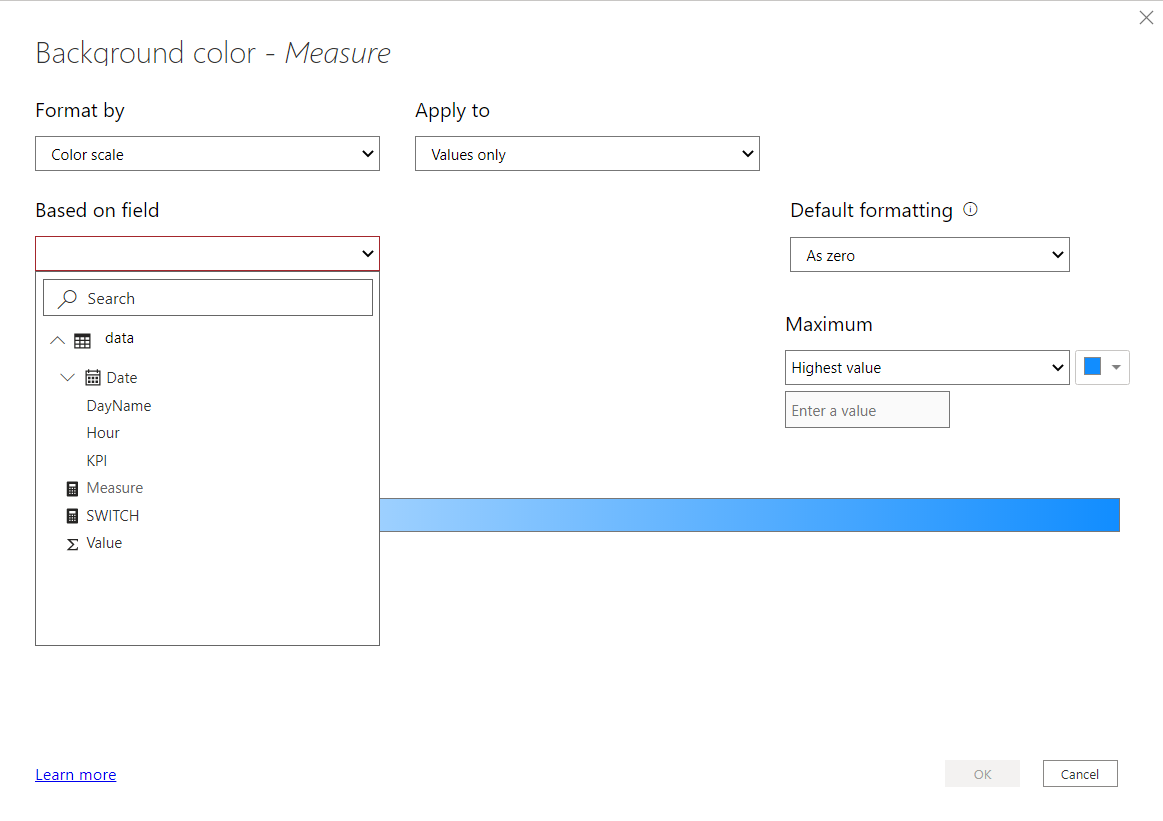
To prove the case, I created a lone measure with “Percentage ” format and see it doesn’t allow to select that measure under the conditional formatting option and goes in “Grey ” color. Screenshot provided below for the reference -
Previously as well similar queries were posted by the members over the forum below is the link provided and you can check out those links.
My apologies but as of now Power BI doesn’t have the option of using formatted text whenever “FORMAT() ” function is used within it.
Hoping you find this helpful.
Note: Please click onto the link and not onto the “Expand/Collapse ” in order to view the entire post.
Thanks and Warm Regards,
Sample heat map.pbix (50.7 KB)
Hello @ammu ,
You can convert your measure to a number by placing VALUE() Function ahead of FORMAT().
But you cannot convert your % Formatting to a Number since it will show an error stating as follows -
"Cannot covert value XX.XX% of type Text to type Number. I’ve also attached the screenshot of the error shown while converting to it. For others, you can definitely convert the Text to a Number.
RLU Act Vs Bud =
VAR Currentitem = SELECTEDVALUE(RLUKeyMeasures[Retirement Living Unit])
RETURN
S…
Hello @YusufGillani ,
Thank You for posting your query onto the Forum.
Well, the formatting part is greyed out because you’ve used the “FORMAT()” function in your measure. Once you use this function it converts the figures into the text format by default and sets that format. Second thing is, within that as well you’ve incorporated two different formats i.e. one for “Number” in terms of “0.00” and one for the “Percentages” in terms of “0.00%”. Due to use of “Characters” as well you won’t be abl…
Hello @Stuart ,
Since your you’ve changed your Number format to the Text format by wrapping it under the “FORMAT()” function it is no longer under the number format because although on the screen it’s seen as % it’s actually converted into the text because the Format of % is mentioned under quotes and anything mentioned under the quotes is regarded as text format.
And please note also you cannot mention it as shown below by removing the quotes -
VAR RemainderPerc = FORMAT(DIVIDE([CY.] - [LY.]…
I managed to get it to work by including an IF function:
CY =
VAR CURRENTITEM = TRIM(SELECTEDVALUE( ‘Summary P&L template’[Income Statement Items] ))
RETURN
SWITCH( TRUE() ,
CURRENTITEM = “Total Revenues”, CALCULATE( [Subject IS], ‘Subject Hotel Summary’[Items (Normalized)] = “Total Revenues”) ,
IF(Metric[Table Data] = “% TORE” , FORMAT(CALCULATE( [Subject IS] , FILTER(‘Subject Hotel Summary’ , ‘Subject Hotel Summary’[Items (Normalized)] = CurrentItem)) , “0.0%”) , CALCULATE( [Subject IS] …
2 Likes