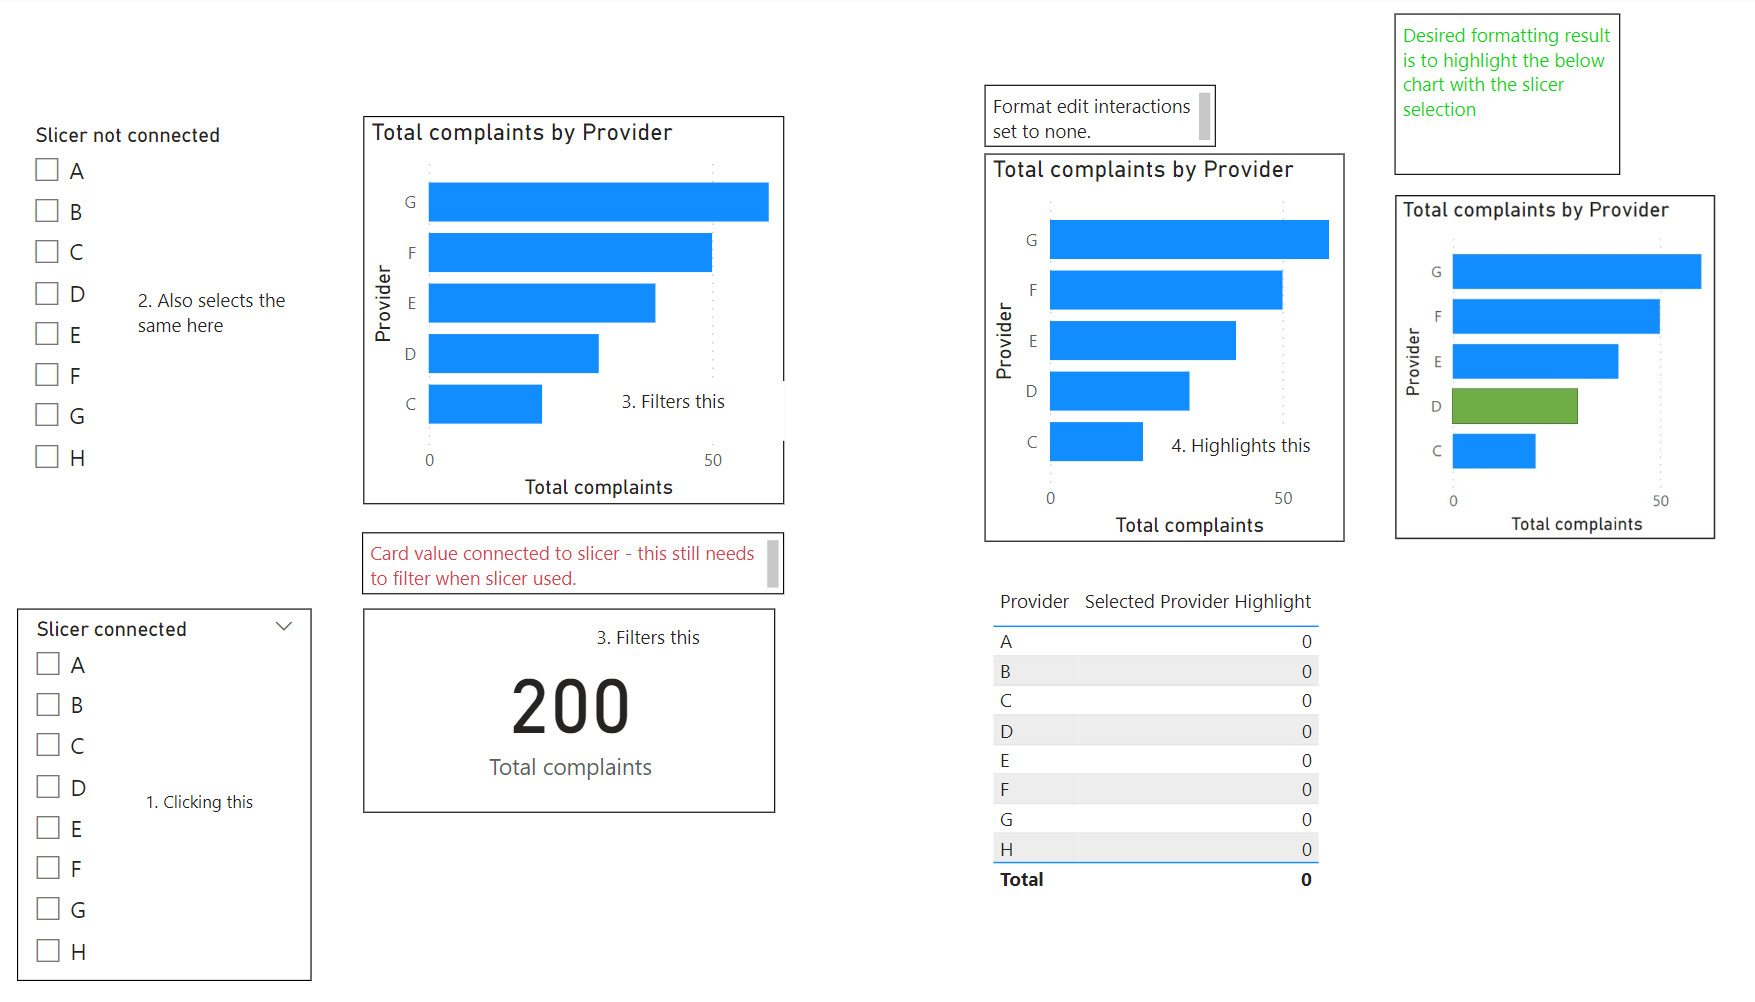
I have the following design, and I want the specific provider’s bar highlighted when selected in the slicer, but I also want to filter other visuals on the same page.
Is there a way to do this? I have tried to conditional format via dax but am failing.
Any assistance greatly appreciated. PBIX file attached.
The solution I am after is one slicer (or two with one hidden), that filters connected visuals, and highlights non-connected visuals.
The highlighting works, if selecting the provider from the disconnected slicer, but the result I am after is a solution where I can use a slicer to filter one visual, and highlight another non-filtered visual, without having two slicers on the page. I have attached the example pbix.
I want to just have one slicer, and it filter some things, and highlight something else.
So selecting one provider in the connected slicer, needs to select the same provider in the disconnected slicer.
I have seen it done where a selection in one slicer selects the same in another slicer.
I’m not sure this is possible - because you need to have the value in the disconnected slicer actually selected, not just filtered.
We can filter the disconnected slicer by the selection in the connected slicer, but not force the value (of the disconnected slicer) to be selected using a DAX measure.
So in summary, you can ignore the model relationships, and filter the disconnected table using a table function ALLSELECTED (or VALUES) in DAX, then use that table to filter another table and calculate a measure.
Everything is TABLES !
Many thanks, I think that was a lightbulb moment in my PBI development.
The use of disconnected tables and slicers to do conditional formatting is a really powerful combo. Here’s a recent post I did demonstrating some other cool twists on that approach that you may find helpful:
@jgriffit - that is a very nice trick - I hadn’t seen anyone sync slicers from different tables before. Thank you for bringing this example to the forum.