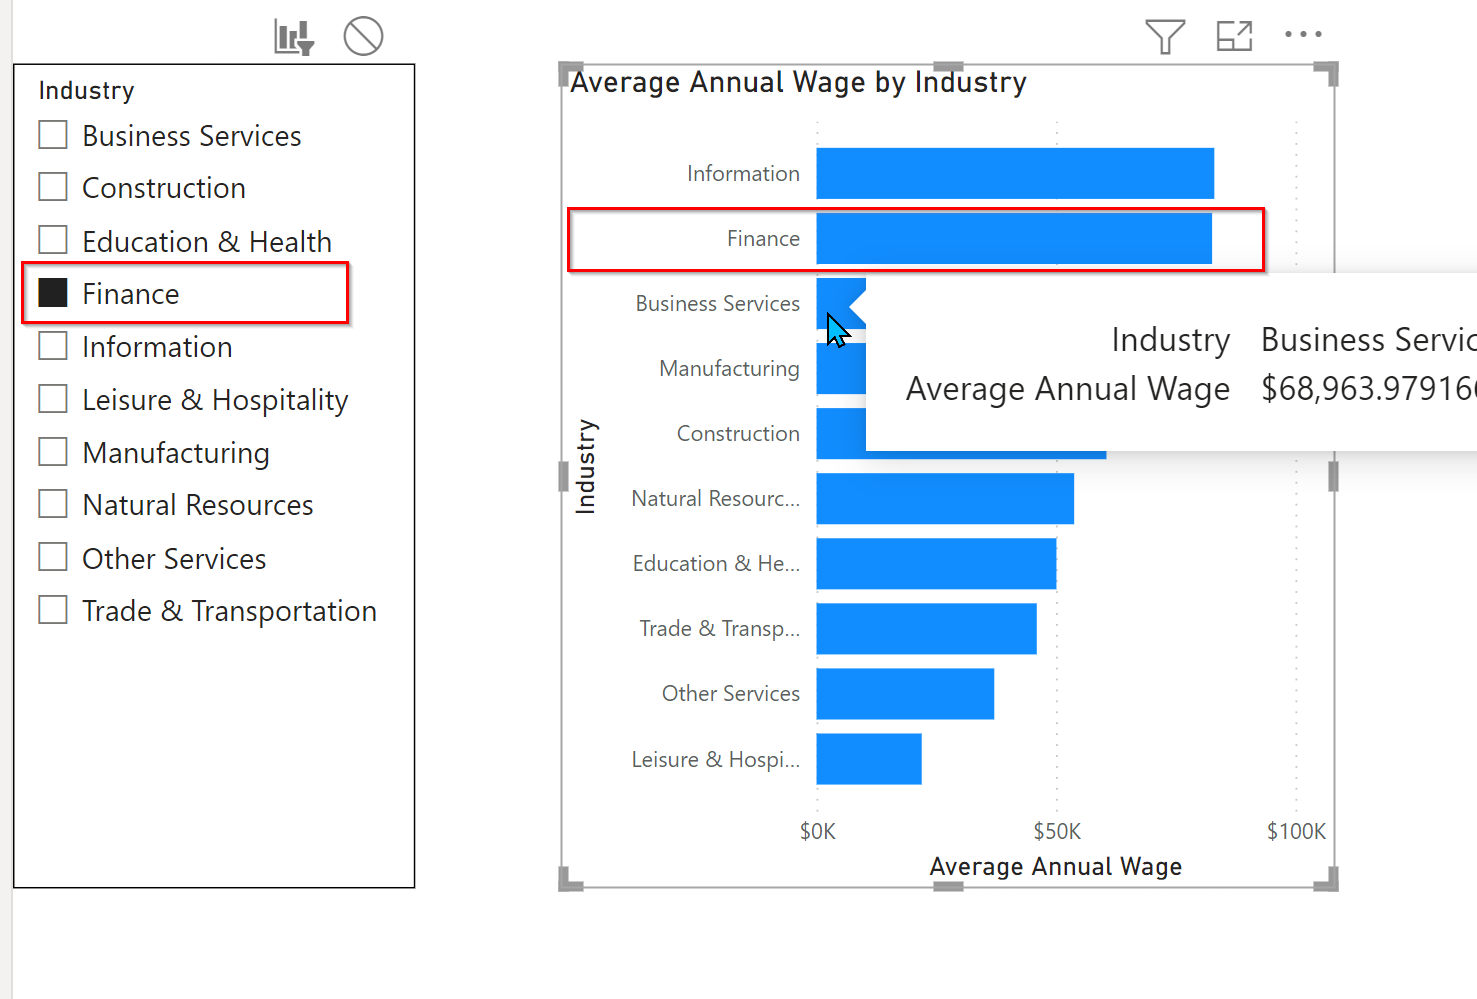
I have a clustered bar chart (as you can see in the picture). I want to HIGHLIGHT the value with a different colored bar when selected from the slicer. I am having a brain-lapse today on how to accomplish this…
Your slicer Industry needs to come from a disconnected table:
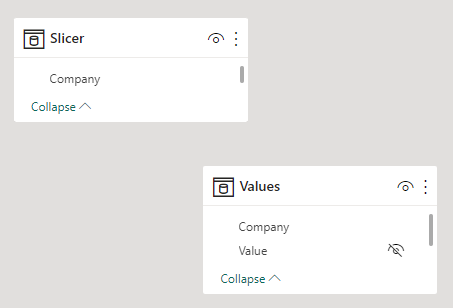
Create a measure to harvest the value from the slicer table, and compare it to the rows in the values table:
Selected Company Highlight =
VAR _Slicer =
    ALLSELECTED ( Slicer[Company] )
RETURN
    IF (
        ISCROSSFILTERED ( Slicer[Company] ),
        IF ( MAX( 'Values'[Company] ) IN _Slicer, 0, 1 ),
        0
    )
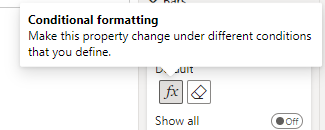
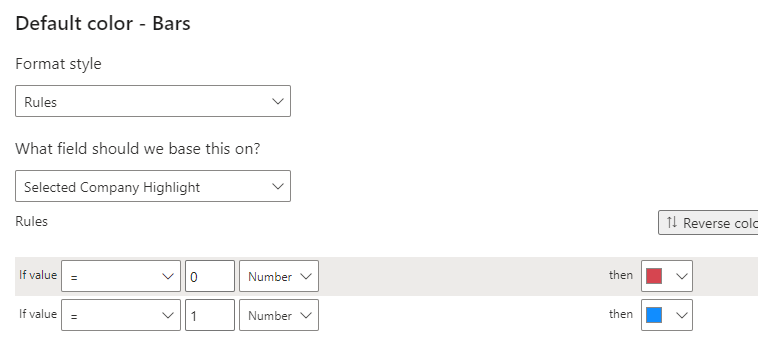
Set the new measure as a conditional format on the bar chart:
see attached file
eDNA Solution - dynamic highlight on bar chart.pbix (20.2 KB)
4 Likes
With the Febraury update does this issue become easier to solve? I have not downloaded the new version.