Comparison code doesn't work?

Hi there,

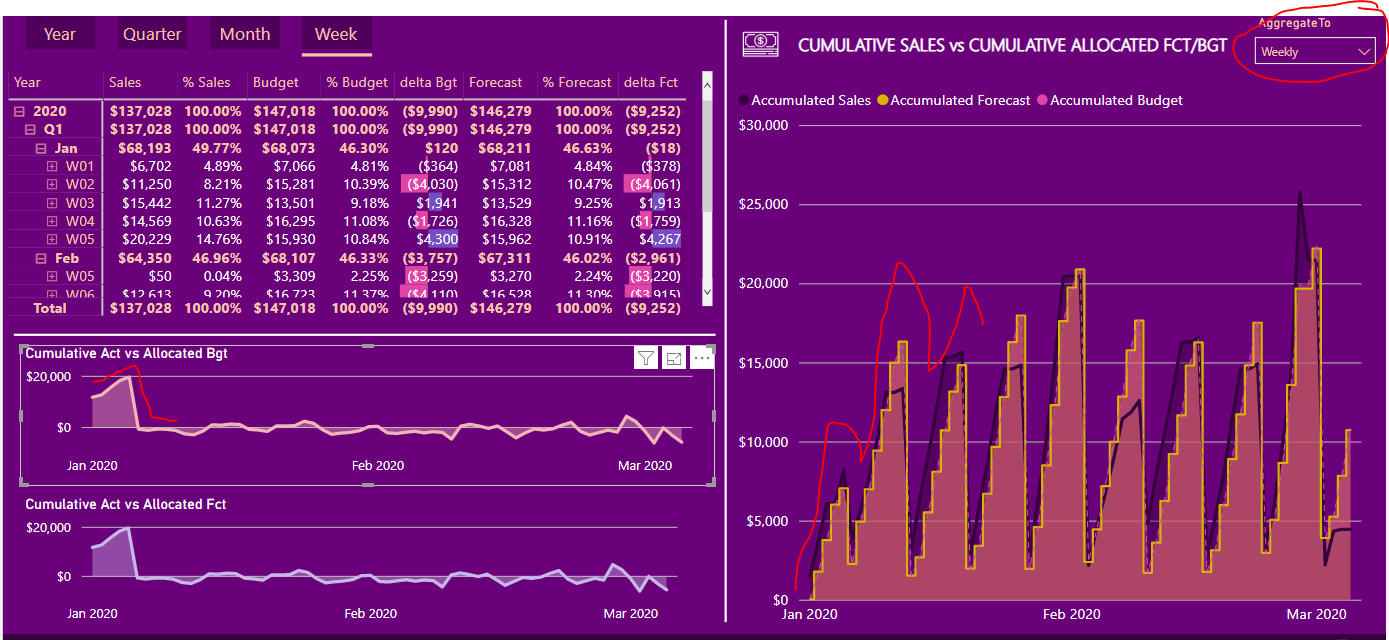
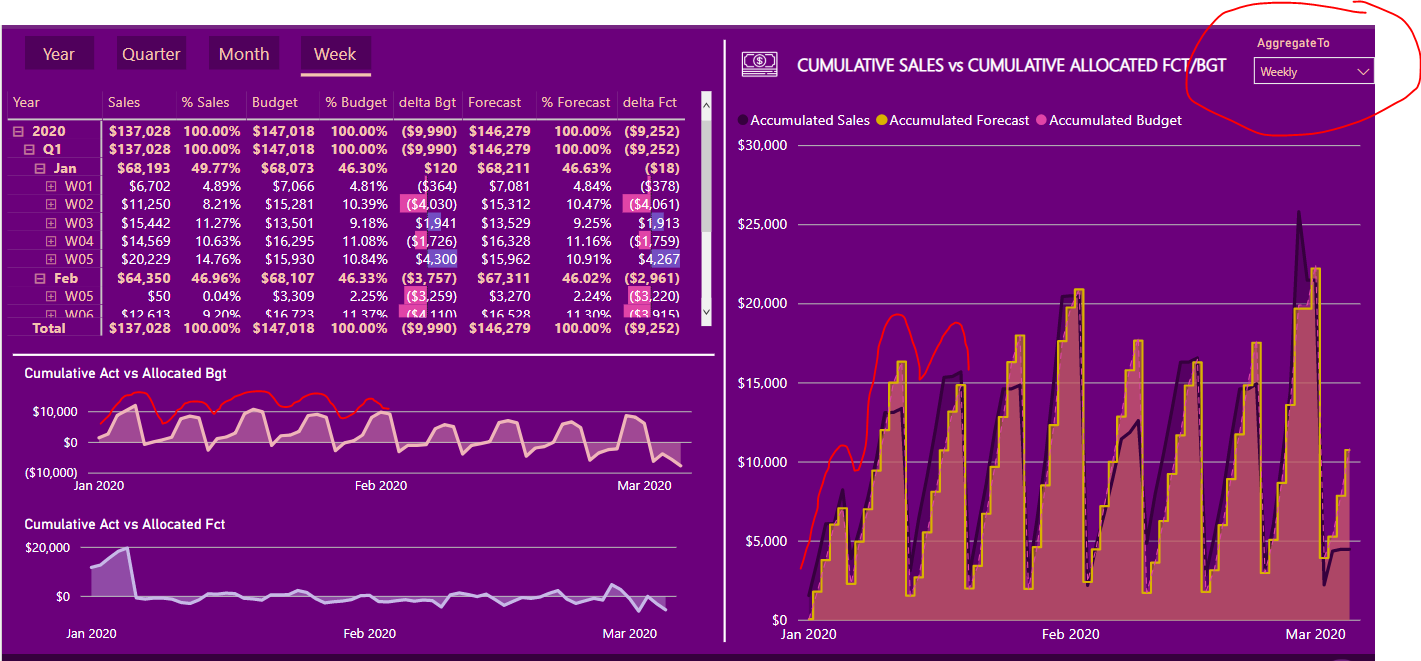
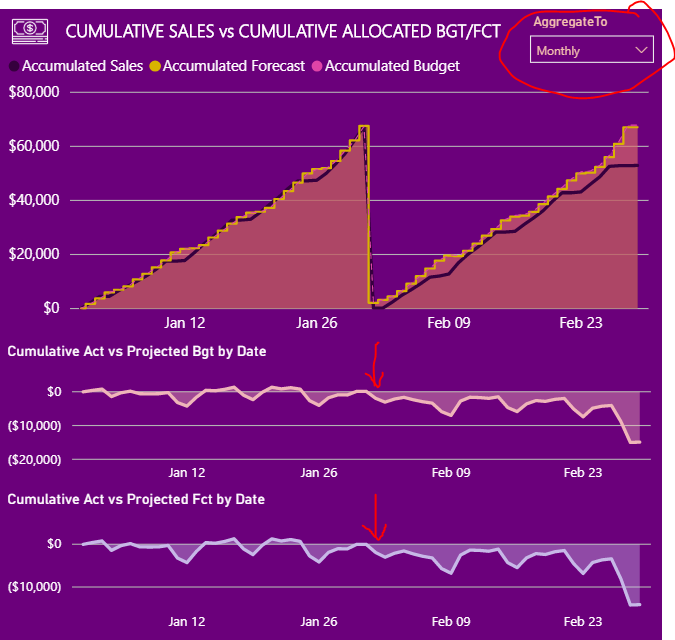
I have got Accumulated Sales, Accumulated Budget and Accumulated Forecast, which when select AggregatTo Monthly they restart well (top visual) but they don’t when attempting to showcase variance (bottom visuals). Essentially they should restart same way.

Steps to get the CumulativeBudgetAllocated

  1. Calculated allocation key based on 2Y cumulative sales performance (Bgt/Fct monthly granualarity only, reason why I needed to create this KEY to allocate them).

Cumulative 2Y Allocation =
VAR SalesPY = CALCULATE( [Sales], DATEADD( ‘Calendar’[Date], -1, YEAR ) )
VAR Sales2Y = CALCULATE( [Sales], DATEADD( ‘Calendar’[Date], -2, YEAR ) )
VAR TotalSalesMonthPY = CALCULATE( [AllDaysMonthSales], DATEADD( ‘Calendar’[Date], -1, YEAR ) )
VAR TotalSalesMonth2Y = CALCULATE( [AllDaysMonthSales], DATEADD( ‘Calendar’[Date], -2, YEAR ) )

RETURN
IF( Sales2Y = 0,
BLANK(),
(SalesPY + Sales2Y) / (TotalSalesMonthPY + TotalSalesMonth2Y)
)

  1. Created helper table for harvester purposes – this will allow to see the data grouped by different time frames
    image
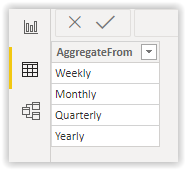
    AggregateStart = SELECTEDVALUE(Aggregation[AggregateFrom])

  2. Needed to repeat Budget (monthly granularity) for every day within the month to allocate it afterwards based on calculated KEY.
    AllDaysCumulatedBudget =
    CALCULATE(
    [Budget],
    DATESBETWEEN(
    ‘Calendar’[Date],
    STARTOFMONTH( ‘Calendar’[Date] ),
    EOMONTH( MAX( ‘Calendar’[Date] ), 0 )
    )
    )

  3. Allocate the repeat total Budget shown per day based on KEY - note I had to ticked this a bit due to 2020 is leap-year (Feb 29th).
    Allocated Budget =
    SUMX(
    VALUES( ‘Calendar’[Date] ),
    [Cumulative 2Y Allocation] * [AllDaysCumulatedBudget] * (‘Calendar’[Date] <> DATE( 2020, 02, 29 ) )
    )

  4. Accumulate Allocated Budget using harvester Aggregation to display data differently based upon selection (M,Q,Y)
    CumulativeBudgetAllocated =
    VAR Monthly = STARTOFMONTH( ‘Calendar’[Date] )
    VAR Quarterly = STARTOFQUARTER( ‘Calendar’[Date] )
    VAR Yearly = STARTOFYEAR( ‘Calendar’[Date] )
    VAR StartDate =
    SWITCH( TRUE(),
    [AggregateStart] = “Monthly”, Monthly,
    [AggregateStart] = " Quarterly", Quarterly,
    Yearly
    )

RETURN
CALCULATE( [Allocated Budget],
FILTER( ALL( ‘Calendar’[Date] ),
‘Calendar’[Date] <= MAX( ‘Calendar’[Date] ) &&
‘Calendar’[Date] >= StartDate
)
)

ISSUE STATEMENT: I created following measures to show comparison Sales to Budget and Sales to Forecast. Tried those 2 but none of them worked:

a) Cumulative Act vs Projected Bgt = [CumulativeSalesAllocated] - [CumulativeBudgetAllocated]

b) Cumulative Act vs Projected Bgt =
VAR Monthly = STARTOFMONTH( ‘Calendar’[Date] )
VAR Quarterly = STARTOFQUARTER( ‘Calendar’[Date] )
VAR Yearly = STARTOFYEAR( ‘Calendar’[Date] )
VAR StartDate =
SWITCH( TRUE(),
[AggregateStart] = “Monthly”, Monthly,
[AggregateStart] = " Quarterly", Quarterly,
Yearly
)

RETURN
CALCULATE( [CumulativeSalesAllocated] - [CumulativeBudgetAllocated],
FILTER( ALL( ‘Calendar’[Date] ),
‘Calendar’[Date] <= MAX( ‘Calendar’[Date] ) &&
‘Calendar’[Date] >= StartDate
)
)

#1 Q: how can I make Cumulative Act vs Projected Bgt behave the same way? restarting every M/Q…

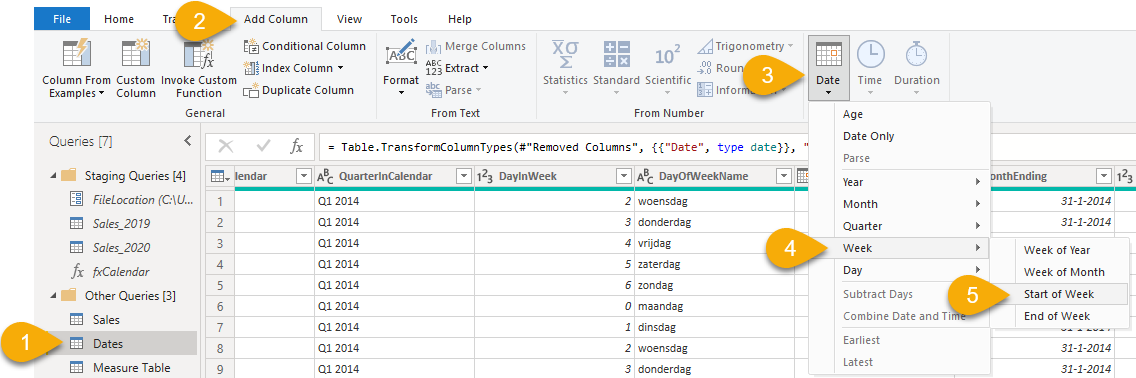
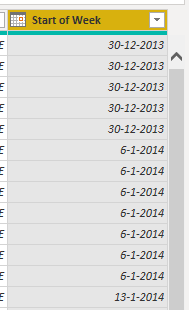
#2 Q: how can I incorporate VAR Weekly aggregation within this code? Anyone has done this before?
CumulativeBudgetAllocated =
VAR Monthly = STARTOFMONTH( ‘Calendar’[Date] )
VAR Quarterly = STARTOFQUARTER( ‘Calendar’[Date] )
VAR Yearly = STARTOFYEAR( ‘Calendar’[Date] )
VAR StartDate =
SWITCH( TRUE(),
[AggregateStart] = “Monthly”, Monthly,
[AggregateStart] = " Quarterly", Quarterly,
Yearly
)

RETURN
CALCULATE( [Allocated Budget],
FILTER( ALL( ‘Calendar’[Date] ),
‘Calendar’[Date] <= MAX( ‘Calendar’[Date] ) &&
‘Calendar’[Date] >= StartDate
)
)

Hi @SamSPAIN, though we appreciate the detailed information you posted, I’m afraid this question is out of the forum’s support boundary. We would like to emphasize that the forum is not a free development service or an on-demand coaching service, asking more than one question in a forum thread and posting questions that could take hours to answer are considered inappropriate. Also, to provide more clarity when using formula in a topic it is necessary to use preformatted text to highlight it.

I’ve highlighted some of the key points from the guide to define posts which are not considered appropriate:

  1. Asking a question you know could take hours of time to answer.
  2. Asking more than one question in any forum thread
  3. Asking question after question in the same forum thread around the same project or piece of development work.

More details can be found here - https://forum.enterprisedna.co/t/asking-questions-on-the-enterprise-dna-support-forum/30

@EnterpriseDNA, I know this isn’t a free-service. I didn’t consider my enquiry to be like this. Apologies if this was out of compliance.

I tried to work out why is that the Cumulative Act vs Projected Bgt difference isn’t behaving the same way in the visual as I would have expected. Therefore I did some research (like I always do) before throwing my Q at the forum.

Last, I thought since my Q were somewhat related, I could ask if anyone here would have any hints on how to calculate best the VAR Weekly aggregation since there’s no such a STARTOFWEEK function to my knowledge

VAR Monthly = STARTOFMONTH( ‘Calendar’[Date] )
VAR Quarterly = STARTOFQUARTER( ‘Calendar’[Date] )
VAR Yearly = STARTOFYEAR( ‘Calendar’[Date] )
VAR StartDate =
SWITCH( TRUE(),
[AggregateStart] = “Monthly”, Monthly,
[AggregateStart] = " Quarterly", Quarterly,
Yearly
)

RETURN
CALCULATE( [CumulativeSalesAllocated] - [CumulativeBudgetAllocated],
FILTER( ALL( ‘Calendar’[Date] ),
‘Calendar’[Date] <= MAX( ‘Calendar’[Date] ) &&
‘Calendar’[Date] >= StartDate
)
)

I thought someone far more skilled in DAX could see something that I missed.

.
You are correct but you can easily add a STARTOFWEEK date to your Dates table, like below.

When you’ve followed these steps, you’ll end up with a new column containing repeating dates for every date in the same week (see below) - you can then use this inside your DAX measures.

image

3 Likes

@Melissa sorry for late reply - been caught lately at work.

Kept searching for the code and I believe I have found it :slight_smile:

CumulativeBudgetAllocated =
VAR Weekly = FIRSTDATE( DATEADD (‘Calendar’[Date], - WEEKDAY( MAX ( ‘Calendar’[Date] ), 2), DAY) )
VAR Monthly = STARTOFMONTH( ‘Calendar’[Date] )
VAR Quarterly = STARTOFQUARTER( ‘Calendar’[Date] )
VAR Yearly = STARTOFYEAR( ‘Calendar’[Date] )
VAR StartDate =
SWITCH( TRUE(),
[AggregateStart] = “Weekly”, Weekly,
[AggregateStart] = “Monthly”, Monthly,
[AggregateStart] = “Quarterly”, Quarterly,
Yearly
)

RETURN
CALCULATE( [Allocated Budget],
FILTER( ALL( ‘Calendar’[Date] ),
‘Calendar’[Date] <= MAX( ‘Calendar’[Date] ) &&
‘Calendar’[Date] >= StartDate
)
)

Nice work.

Just one thing on the formatting of your DAX. Have you considered trying to make it a little bit more formatted? Check out the video tutorial below for ideas

Very valid point, Sam. I have formatted a bit to make it clearer.

Article to accomplish the Week. Credit to Radacad: https://radacad.com/week-to-date-calculation-in-power-bi-with-dax

Would like to take this occasion to raise another point which is puzzling me A LOT.

I want to showcase into another visual the variances Act to Bgt and Act to Fct and not 100% sure whether or not I should use the same logic - see below:

Cumulative Act vs Allocated Bgt =
VAR Weekly = FIRSTDATE(
DATEADD (‘Calendar’[Date],
- WEEKDAY( MAX ( ‘Calendar’[Date] ), 2), DAY) )
VAR Monthly = STARTOFMONTH( ‘Calendar’[Date] )
VAR Quarterly = STARTOFQUARTER( ‘Calendar’[Date] )
VAR Yearly = STARTOFYEAR( ‘Calendar’[Date] )
VAR StartDate =
SWITCH( TRUE(),
[AggregateStart] = “Weekly”, Weekly,
[AggregateStart] = “Monthly”, Monthly,
[AggregateStart] = “Quarterly”, Quarterly,
Yearly
)

RETURN
CALCULATE( [CumulativeSalesAllocated] - [CumulativeBudgetAllocated],
FILTER( ALL( ‘Calendar’[Date] ),
‘Calendar’[Date] <= MAX( ‘Calendar’[Date] ) &&
‘Calendar’[Date] >= StartDate
)
)

If I remove the Weekly VAR it seems that the Act vs Bgt (Act vs Fct unchanged) line restarts from X axis more in sync:

Cumulative Act vs Allocated Bgt =
VAR Monthly = STARTOFMONTH( ‘Calendar’[Date] )
VAR Quarterly = STARTOFQUARTER( ‘Calendar’[Date] )
VAR Yearly = STARTOFYEAR( ‘Calendar’[Date] )
VAR StartDate =
SWITCH( TRUE(),
[AggregateStart] = “Monthly”, Monthly,
[AggregateStart] = “Quarterly”, Quarterly,
Yearly
)

RETURN
CALCULATE( [CumulativeSalesAllocated] - [CumulativeBudgetAllocated],
FILTER( ALL( ‘Calendar’[Date] ),
‘Calendar’[Date] <= MAX( ‘Calendar’[Date] ) &&
‘Calendar’[Date] >= StartDate
)
)

To work this out I would first lay everything out in a table, so you can see all the numbers. It’s quite difficult and confusing sometimes when you only look at visuals. Break down each part of the calculation in a table and then it will make a lot more sense.

Time intelligence calcs don’t work to well with weeks, but I’m sure you know that already. It is likely to be a date mis match in the formula but it’s difficult to say because I can’t see every underlying calculation.

Whenever I get confused around results, I break it down. That is my recommendation here. Then build it back up once you understand every part of the calculation and what it is doing in each context.

thanks
Sam

1 Like

Hi , we’ve noticed that no response has been received from you since the 5th of March. We just want to check if you still need further help with this post? In case there won’t be any activity on it in the next few days, we’ll be tagging this post as Solved. If you have a follow question or concern related to this topic, please remove the Solution tag first by clicking the three dots beside Reply and then untick the checkbox. Thanks!