Hi there,
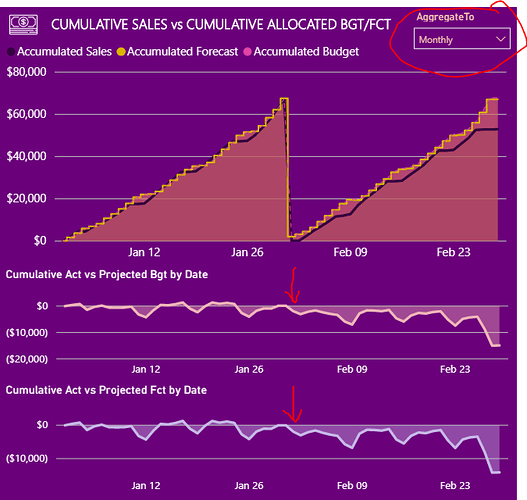
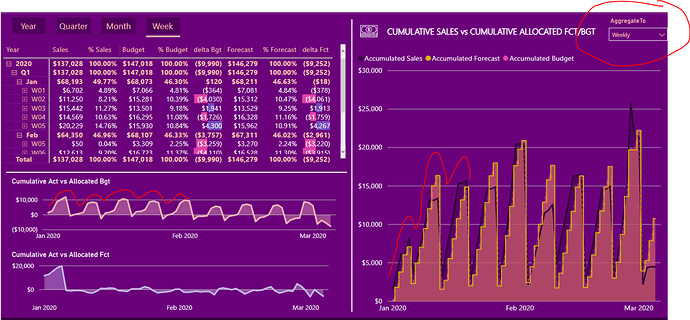
I have got Accumulated Sales, Accumulated Budget and Accumulated Forecast, which when select AggregatTo Monthly they restart well (top visual) but they don’t when attempting to showcase variance (bottom visuals). Essentially they should restart same way.
Steps to get the CumulativeBudgetAllocated
- Calculated allocation key based on 2Y cumulative sales performance (Bgt/Fct monthly granualarity only, reason why I needed to create this KEY to allocate them).
Cumulative 2Y Allocation =
VAR SalesPY = CALCULATE( [Sales], DATEADD( ‘Calendar’[Date], -1, YEAR ) )
VAR Sales2Y = CALCULATE( [Sales], DATEADD( ‘Calendar’[Date], -2, YEAR ) )
VAR TotalSalesMonthPY = CALCULATE( [AllDaysMonthSales], DATEADD( ‘Calendar’[Date], -1, YEAR ) )
VAR TotalSalesMonth2Y = CALCULATE( [AllDaysMonthSales], DATEADD( ‘Calendar’[Date], -2, YEAR ) )
RETURN
IF( Sales2Y = 0,
BLANK(),
(SalesPY + Sales2Y) / (TotalSalesMonthPY + TotalSalesMonth2Y)
)
-
Created helper table for harvester purposes – this will allow to see the data grouped by different time frames
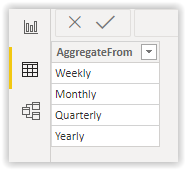
AggregateStart = SELECTEDVALUE(Aggregation[AggregateFrom]) -
Needed to repeat Budget (monthly granularity) for every day within the month to allocate it afterwards based on calculated KEY.
AllDaysCumulatedBudget =
CALCULATE(
[Budget],
DATESBETWEEN(
‘Calendar’[Date],
STARTOFMONTH( ‘Calendar’[Date] ),
EOMONTH( MAX( ‘Calendar’[Date] ), 0 )
)
) -
Allocate the repeat total Budget shown per day based on KEY - note I had to ticked this a bit due to 2020 is leap-year (Feb 29th).
Allocated Budget =
SUMX(
VALUES( ‘Calendar’[Date] ),
[Cumulative 2Y Allocation] * [AllDaysCumulatedBudget] * (‘Calendar’[Date] <> DATE( 2020, 02, 29 ) )
) -
Accumulate Allocated Budget using harvester Aggregation to display data differently based upon selection (M,Q,Y)
CumulativeBudgetAllocated =
VAR Monthly = STARTOFMONTH( ‘Calendar’[Date] )
VAR Quarterly = STARTOFQUARTER( ‘Calendar’[Date] )
VAR Yearly = STARTOFYEAR( ‘Calendar’[Date] )
VAR StartDate =
SWITCH( TRUE(),
[AggregateStart] = “Monthly”, Monthly,
[AggregateStart] = " Quarterly", Quarterly,
Yearly
)
RETURN
CALCULATE( [Allocated Budget],
FILTER( ALL( ‘Calendar’[Date] ),
‘Calendar’[Date] <= MAX( ‘Calendar’[Date] ) &&
‘Calendar’[Date] >= StartDate
)
)
ISSUE STATEMENT: I created following measures to show comparison Sales to Budget and Sales to Forecast. Tried those 2 but none of them worked:
a) Cumulative Act vs Projected Bgt = [CumulativeSalesAllocated] - [CumulativeBudgetAllocated]
b) Cumulative Act vs Projected Bgt =
VAR Monthly = STARTOFMONTH( ‘Calendar’[Date] )
VAR Quarterly = STARTOFQUARTER( ‘Calendar’[Date] )
VAR Yearly = STARTOFYEAR( ‘Calendar’[Date] )
VAR StartDate =
SWITCH( TRUE(),
[AggregateStart] = “Monthly”, Monthly,
[AggregateStart] = " Quarterly", Quarterly,
Yearly
)

RETURN
CALCULATE( [CumulativeSalesAllocated] - [CumulativeBudgetAllocated],
FILTER( ALL( ‘Calendar’[Date] ),
‘Calendar’[Date] <= MAX( ‘Calendar’[Date] ) &&
‘Calendar’[Date] >= StartDate
)
)
#1 Q: how can I make Cumulative Act vs Projected Bgt behave the same way? restarting every M/Q…
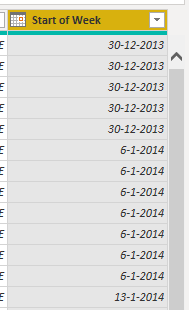
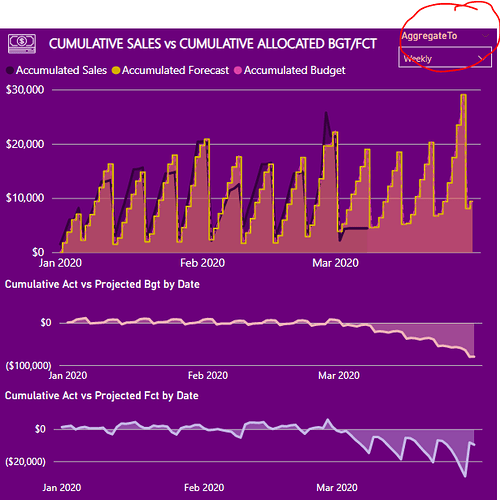
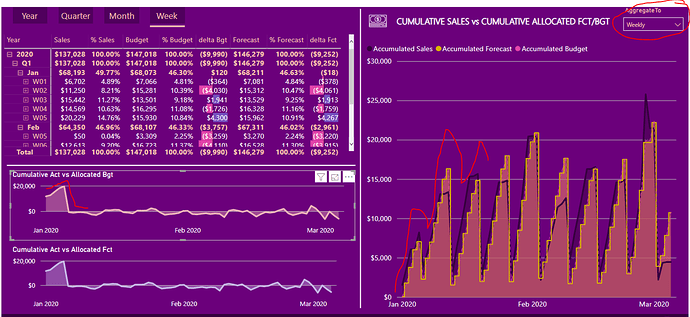
#2 Q: how can I incorporate VAR Weekly aggregation within this code? Anyone has done this before?
CumulativeBudgetAllocated =
VAR Monthly = STARTOFMONTH( ‘Calendar’[Date] )
VAR Quarterly = STARTOFQUARTER( ‘Calendar’[Date] )
VAR Yearly = STARTOFYEAR( ‘Calendar’[Date] )
VAR StartDate =
SWITCH( TRUE(),
[AggregateStart] = “Monthly”, Monthly,
[AggregateStart] = " Quarterly", Quarterly,
Yearly
)
RETURN
CALCULATE( [Allocated Budget],
FILTER( ALL( ‘Calendar’[Date] ),
‘Calendar’[Date] <= MAX( ‘Calendar’[Date] ) &&
‘Calendar’[Date] >= StartDate
)
)
