I have a two lightweight tables, one (Target table) containing records of non-financial goals for business units and when they should be met in the year. The other table (Goal Table) records what actually happened.
So far, so simple
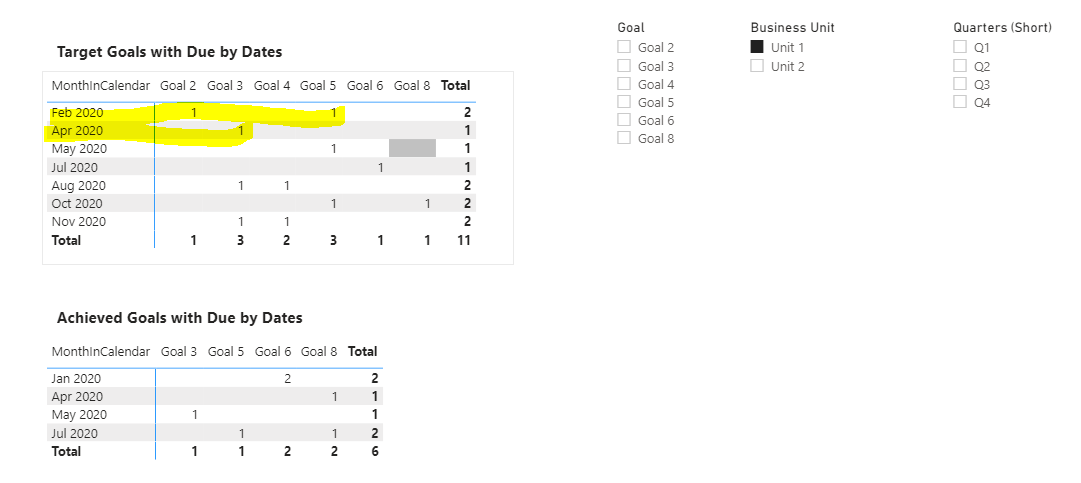
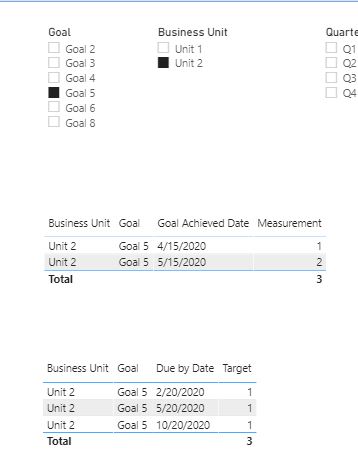
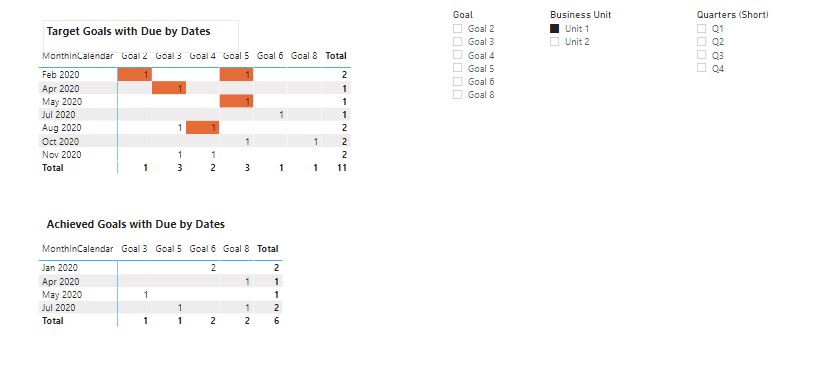
I would like to find a way of highlighting goals that have not been met within the time they were meant to be met.
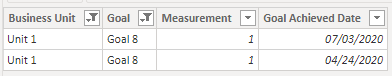
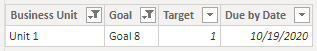
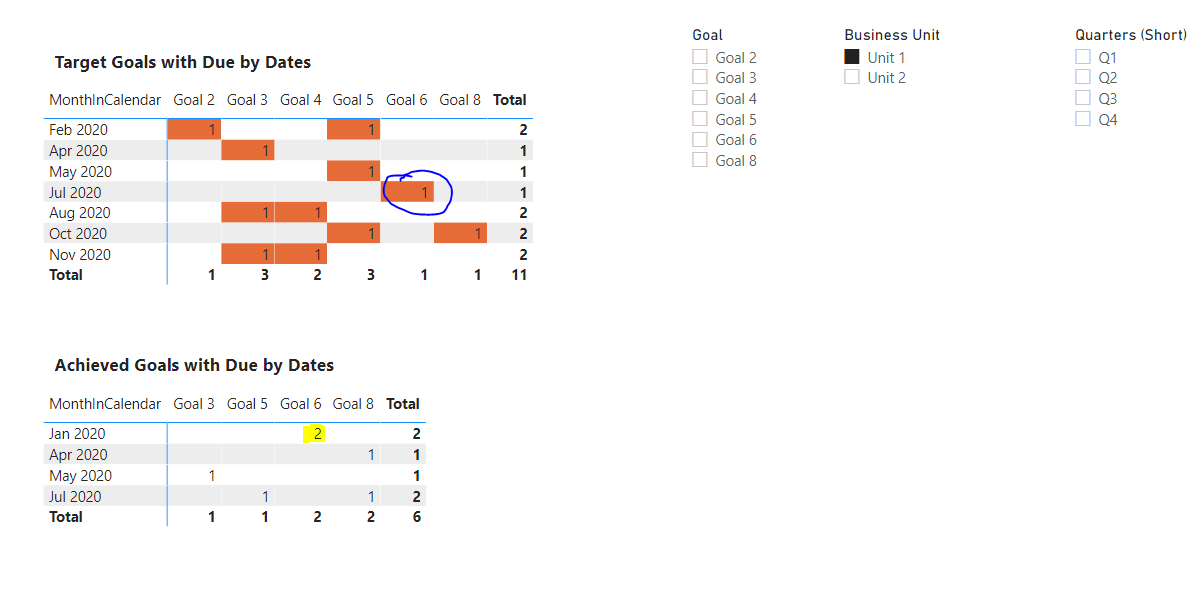
E.g. (please refer to image) when Unit 1, is selected, they are supposed to have achieved Goal 2 and Goal 5 in February and Goal 3 in April but did not.
Is it possible to produce a table, or some other visual, that highlights targets that have been missed in a particular Date range?
I think this is possible but have no idea how how to start going about this so would very much appreciate the guidance or videos that can help achieve this.
Sample data model attached below.
This is one problem where data modeling is 90% of the battle. If we structure the fact table optimally, the DAX to do the visual will be really simple. If you can post the text.xls file, I’ll restructure this in PQ and get you a proposed solution back soon.
I’m taking a very different approach to this than @Rajesh, in that my solution is almost entirely in Power Query, which always makes for interesting discussion.
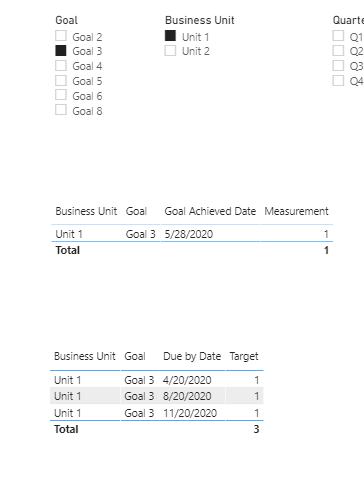
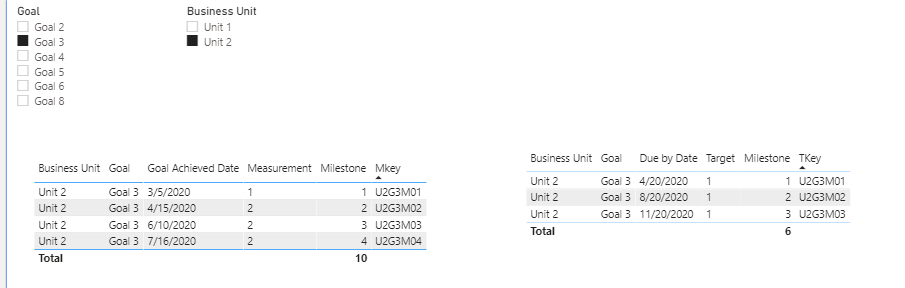
However I’m having a really hard time understanding the underlying business logic. If we look at unit one, goal three and then unit two, goal five, I can’t figure out which target dates correspond to which actual dates and vice versa. Sometimes the relationship seems to be !:M, other times M: 1 and other times M: M.
How should the two examples provided above be interpreted?
That one actually almost makes sense to me, if it the relationship between actual and target were consistently M:1, but then look at this case and try to figure out what corresponds to what:
My original approach was to group by unit and goal and then add an index counter that resets at each group to develop granularity at the milestone level and then bring the target date into the fact table using a composite key of unit, goal and milestone. However, given the relationship ambiguity discussed above, that approach did not work…
We’ll definitely need additional guidance from @Mo.jo.jo.
Oh wow. That was prompt.
Thank you all for the input.
@Rajesh Thanks for the sample code. I will play with that now and come back with an update if it works for what I am trying to show. I wanted to get some input to @BrianJ and @AntrikshSharma.
@BrianJ and @AntrikshSharma the thinking/goal behind the goals/logic is quite simple. At least in my head it is
One goal/target might be to nominate one person to give a presentation on a topic by a certain date. Another goal might be to have arranged a client feedback meeting by a particular date.
Let’s say Unit 1 nominates two people to give the presentation before the due target date. That is counted as two separate counts and thus having exceeded the target. To simplify things, although it is two separate counts, I take the latest date in that month that the goal was achieved as the date the count was achieved.
Both Units have the same target due by date. Both could meet the target by that date by carrying out the activity just once, or multiple times, in which case it is counted as “multiple” entries. The ultimate goal being to try and encourage these practices/behaviour within the business units.
I am not sure which is considered one or many in those cases. It seems it can change.
My main target, with the DAX request is to try and highlight where a business unit has missed a target. Even if they are overachieving some targets they may be neglecting others that are due by a particular window. And to try and show which ones have been missed for a particular month in an easy to see way.
Following on from looking at Rajesh’s proposed solution I must add that it would be ideal if when a goal has been met (in an earlier month before it is due) then it is accounted for in the month when due. I had not thought of that, but that is important and perhaps complicates the requirement a bit.
I hope that clarifies things for you both. But if not, kindly let me know.
I appreciate your time spent on this and would be interested in the approaches that you would both would use to show this as I can learn/apply this in other scenarios I have in mind for using these simple targets.
@BrianJ. Please find the Excel file attached if it helps.
Also, I put this anonymous sample data together before coming across your really handy Enterprise DNA video on Anonymising Data Will use your approach as I get more problems I need advice on in here. But Power BI is something I currently only dabble in part time at work. Trying to show/demo more use cases so I can get more full time work on it.
Thanks for taking time to look at the issue and send the code. I would not have thought to try going about showing the missed targets that way.
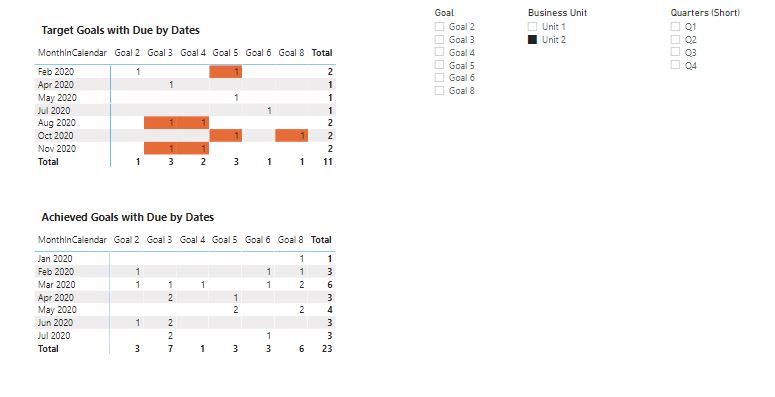
Slight issue though. If I look at Unit 1, Goal 6 as an example. They achieved Goal 6 in January, so in theory they have met the target, but it still highlights as they have missed it.
Would there be a way to amend the code to account for goals that have been met early? Otherwise there might be a lot of protests Please see image attached.
That is so clever. It looks simple, but it took me a while to understand how it works.
I think I get it.
Thanks so much for looking into this
@BrianJ and @AntrikshSharma
I think Rajesh’s solution will help me visualise what I am looking to do and I will proceed with trying to implement it on the data I putting together for the scenario example.
If you have the time and are still interested in showing me how you might approach this from alternative approaches, I would still be interested in learning about that and discussing. But I understand if you have other issues to work through.
@Rajesh
Sorry. One more question.
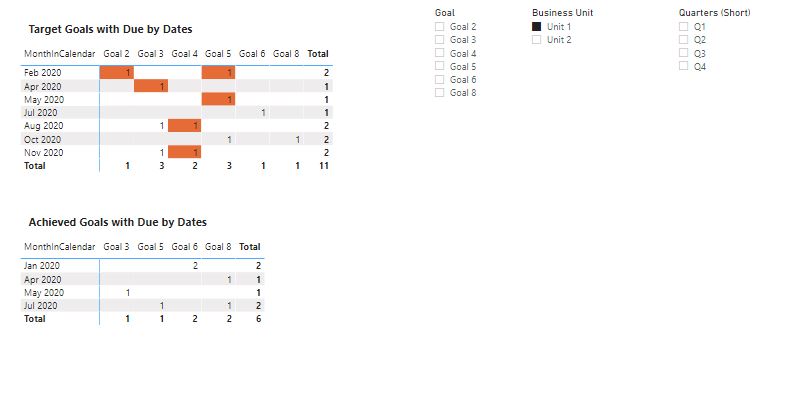
I am trying to hide the background colours for months that have not happened yet e.g. anything from September - Dec 2020 has not happened yet and should not have a background fill to say the target has been missed.
Is there a way to edit the code to achieve that?
This is a great discussion, because it illustrates a lot of important points about both DAX and data modeling. First, hats off to @Rajesh - very clever solution and a nice bit of efficient DAX coding.
I think you hit on the key point of data modeling in your message above – does my data model support not only the analysis I’m trying to do now, but additional analyses I may want to do in the future? A secondary question then becomes not only will the model support that future analysis, but how difficult will it be to implement in DAX (and/or Power Query)?
In your case, I would look to a more flexible and robust data model along the following lines:
ideally, you want to avoid many-to-many relationships in your model. Because both your actual and target measurements are at a daily granularity, this is definitely doable within your data model.
the next step is figuring out what the finest granularity will be that uniquely defines a target date and a target number of widgets. Will different business units have different target dates for the same activity? Will unit and goal uniquely define a target date and amount, or will you need to go to the milestone level within a given unit and goal? Will target dates and amounts be set by employee, or can any employee from a given unit (or across units) meet the target?
once the questions in 2) are answered, we can go about setting up the actual measurement fact table at the proper level of granularity and the right structure to correspond to the target table. While we are doing that, we can also be thinking about what the DAX will look like applied to that structure in order to answer the key questions in your analysis plan.
Let me know what you think, particularly about the questions in 2) above, and if you’d like I’d be glad to work with you in revising the data model.
@BrianJ
It is also interesting because my data modelling is of a freestyling self taught nature. Thus I think I try and keep it simple by aiming for 1 to many all the time. I have read that many-to-many can be a performance and mindbendingly confusing model to decipher for the beginner/intermediate Power BI user.
I did not really think I was creating a many to many situation
My thinking/proposal was that all business units would have the same number of targets over the year, due on the same day. I tried to also get round any many-to-many issues by suggesting that the latest day that a target/goal was met in a particular month was when all measurements relating to that specific target were recorded. To me that meant, we had one date in the measured/actual month and one date in the target month to compare for each business unit.
In answer to question 2, at the moment I am putting the concept and dummy data together to show how it might work, whilst trying to predict how it might evolve over time, with no experience having created something like this before. So I am happy to dive in further to see what an flexible model might look like.
Only limitation might be that I said I would get something together for Monday so I will proceed with the code I have from Rajesh and work on this practical testing on the side and can implement it if the idea is approved … even though I could change the model
I have honestly no idea how else I could set this up and still understand how the DAX might look like to get accurate values but I am game to try and set up a more future-proof/considered model if you are happy to coach
I think the framework above i.e. all business units measured to the same monthly deadline will be acceptable to the parties involved as everyone gets measured for progress at the same time and using the same metrics.
Targets are set at the beginning of the year, with targets are spread over the year. And the suggestion is to measure the actuals for each business unit at the end of every month to tally up what was achieved for that month.
Any employee can meet the target i.e. there is nothing to stop the same employee being put forward for another presentation (but on a different innovation topic - one example), but the business units are separate so employees do not transfer across. For that reason I think unit, goal and amount uniquely defines each unit.
Good suggestion about milestone points. To start I have suggested that to be when the minimum number of required goals (over the whole year) has been achieved. There is of course nothing stopping each unit from exceeding that, which is to be encourages, and I plan to highlight that within the visuals used (by conditional formatting).
Please let me know if you have any thoughts about how the model could be improved based on the above.
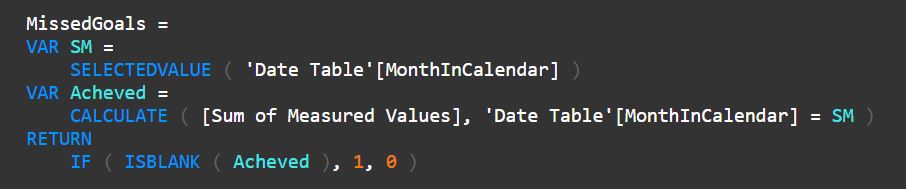
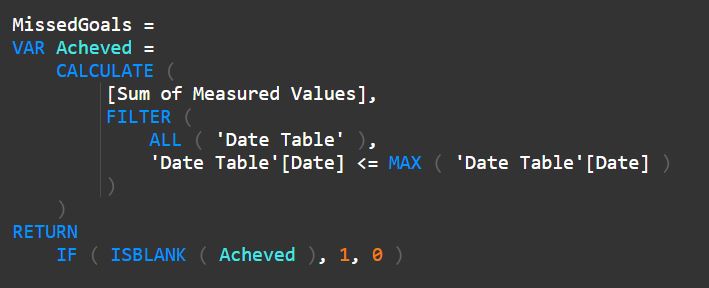
This DAX problem is too simple for you
There I was trying to figure out some complicated condition to add to the FILTER statement and which was not working. And one answer was to look at the IF part.
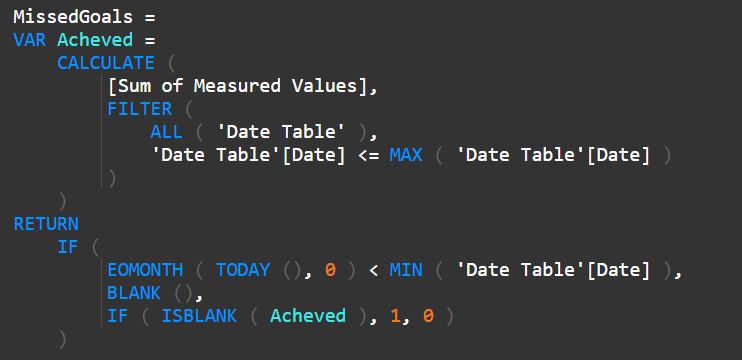
Really nice solution and introduced me to the EOMONTH function too.
Ermm, I hope I am not back about this code again .
I think this should do the trick.
Thanks once again.
I tried to also get round any many-to-many issues by suggesting that the latest day that a target/goal was met in a particular month was when all measurements relating to that specific target were recorded. To me that meant, we had one date in the measured/actual month and one date in the target month to compare for each business unit.
I see two significant problems with that approach of using unit, goal and date to uniquely identify a record in your actual measurement table, even if you standardize that date to be the latest date when a measurement was achieved:
before any work is completed on that goal, the field values that feed into the composite key will be unit #, goal #, and null (no date provided since the work on that goal is not started and/or complete). If you have two goals in the same work unit on which work is still in process, you will by default end up in a many-to-many situation
similarly, even if work on those two goals is completed, if it happens to complete on the same date, you still have a many-to-many situation (this will also be a problem if you have multiple targets within the same unit in goal that have the same target date)
To me, the simplest solution is just to create a third level on your composite key - call it subgoal, or task, or milestone, or whatever is meaningful within your planning hierarchy as the next level of granularity below goal. The number of rows here in both the actual and the target table will be equal to the number of unique targets for a given unit and goal. This avoids the many-to-many problems, and still gives you the flexibility to add subgoal/tasks on the fly (since when you add a row to your target table, you also make corresponding additions to your actual table).
I hope that’s helpful food for thought once you get past your immediate deadline.
@BrianJ
That is a great point. And one I had not thought about.
The workflow I am proposing is to try and collect this information using Power Automate connected to a SharePoint list (there won’t be more than a 100 entries a year I expect) & then Power BI.
The table set up for this to happen in within SharePoint already looks quite wide, hence the search for simplification.
But, as mentioned, great point. I would not have thought about implementing your suggestion, until I was probably up the notorious “creek without a paddle”.
Thanks a lot. Will look to think through things and set things up to better allow this extra granularity, if things get approved.
Catch you another time and thank you for your time.


 .
.