Looking for DAX formula to compare total services of a selected week(s) with last year same period. For example, I like to be able to compare total services (count) of service Week 1 January 2018 with Week 1 January of 2017. Week starts with first of the month + 7. So, week 1=1 thru 7, week 2 = 8 thru 14, week 3 = 15 thru 21, week 4 = 22 thru 28 and week 5 = the rest. I will use the week variable in filter along with service year and month.
I have looked at comparing current year or even current month with same period last year but figures don’t match with the data.
Hi Sam,
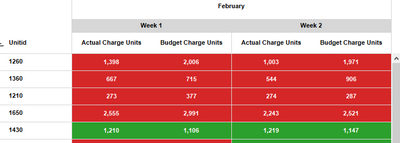
The video really helped and thank you. Now that I got my measures down, I want to create a so called HeatMap, KPI visual, or conditional formatting based on few criteria. I have tried using many of the custom visuals and one conditional formatting but none came close to what was developed in Tableau. Here is an Excel file https://drive.google.com/file/d/1ETKndS-2WeboNzhYgh0m6sGB1FdTuNiY/view?usp=sharing
that includes the following:
Sample Data: This tab includes raw data for one Unit (Unit ID=1260) for week1 and week2 of October 2016 and 2017
Summary & Desired Output: This table includes a simple Pivot of the sample data. It also includes a snapshot of Tableau report (desired outcome) followed by KPI definitions and rules. I tried to explain everything in this tab.
I appreciate any help/guidance.
The ones I thought it will mimic the Tableau version such as stacked column/bar chart, Table HeatMap, Power KPI Matrix (not completely relevant but), Brick Chart, Table sorter (I am a fan of this), and few others. I couldn’t quiet get what is presented in Tableau visualization which is fairly simple and intuitive.
Sam,
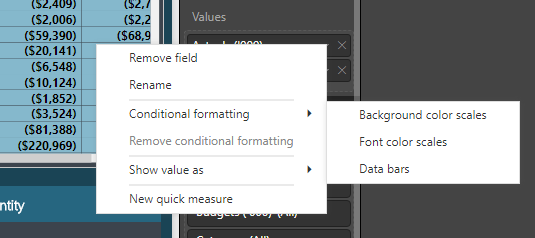
Thank you again. I started on Matrix visual yesterday and tried conditional formatting (CF). So far, I can see that CF only applies to one measure at the time, correct? another words, I can’t say in CF that if this year services (Actual) < Last Year services (Budget) then Red other wise Green. As I did some research, this is a feature that Microsoft Power BI developer team are currently working on . Alternatively, I can create a KPI set with the above logic and then do CF. This will work except that it’s not the same as is presented in Tableau where It shows Both Actual and Budget and then applies the color where appropriate. I am sure there should be a work around util CF on multiple measures be available in future updates.
By the way, the image you provided for Q1, are Actual and Budget constructed as one or two measures? if former I like to know how you build it. If the latter, how CF will work with two measures?