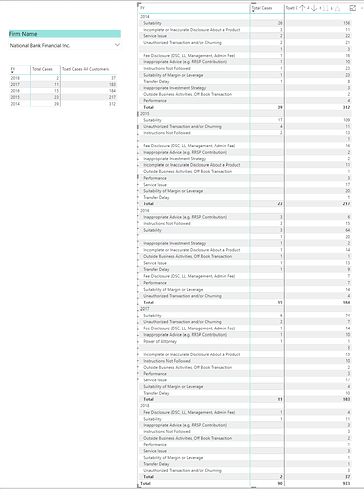
Hello,
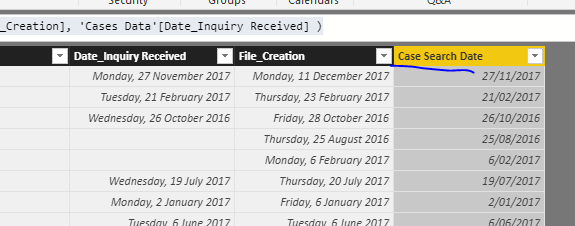
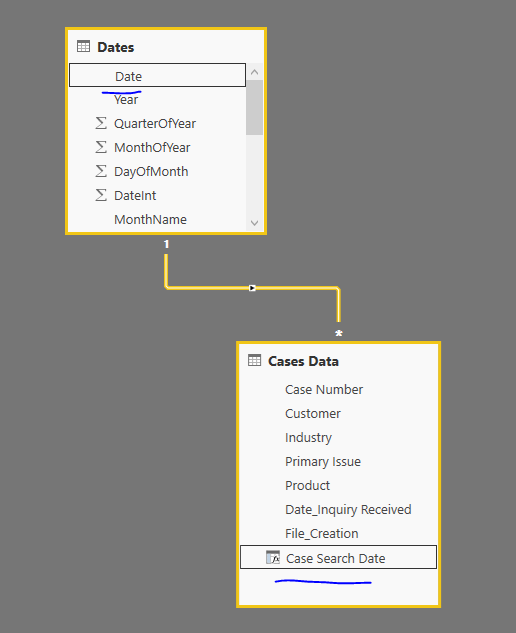
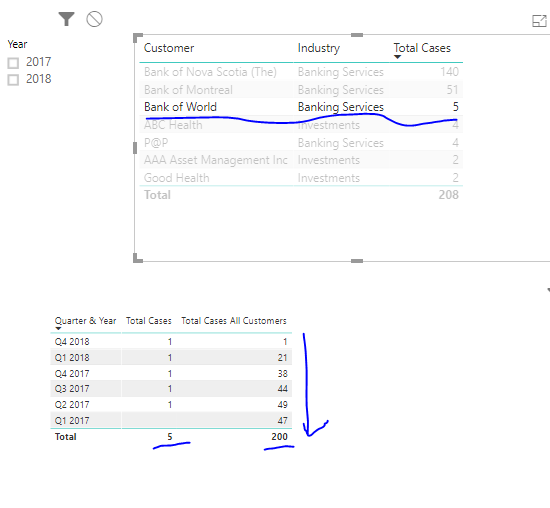
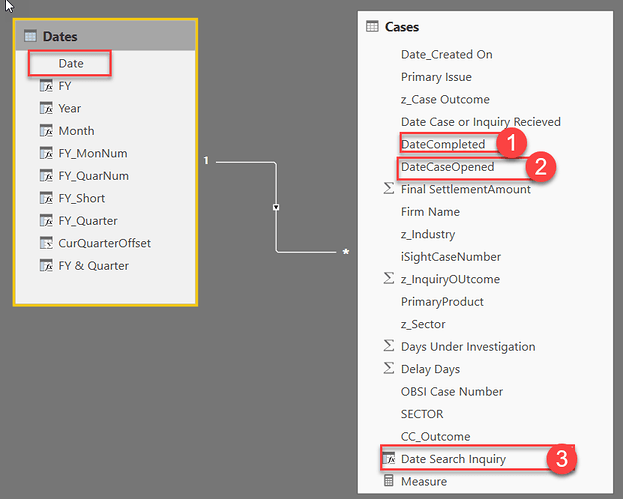
My ‘Case’ query has Case Number, Customer, Industry, Date Inquiry Received, Date Case Created.
I created below DAX first:
1. Search Date = if('Case'[Date_Inquiry Received]=blank(), 'Case'[File_Creation],'Case'[Date_Inquiry Received]);
2. Quarter = CONCATENATE("Q",ROUNDUP(MONTH([Search Date])/3,0)& " "& ('Case'[Year]))
3. 1_CaseCountByCustomer = CALCULATE (
COUNTROWS('Case'),   ALLEXCEPT('Case', 'Case'[Customer],'Case'[Quarter])
)
4.2_CaseCountByIndustry =
    CALCULATE (
COUNTROWS('Case'),
   ALLEXCEPT('Case', 'Case'[Industry],'Case'[Quarter])
)
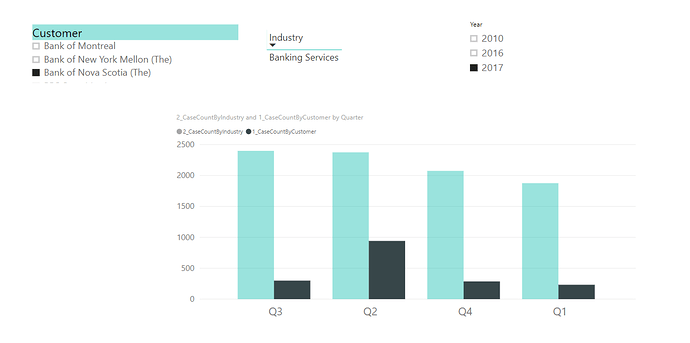
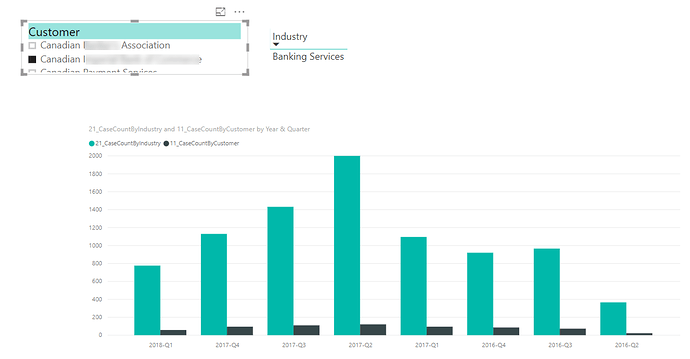
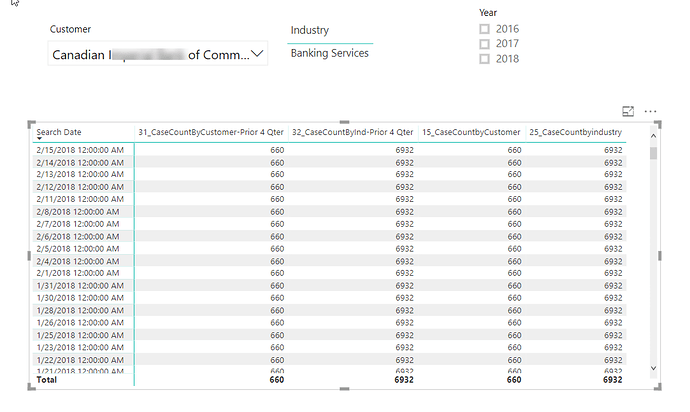
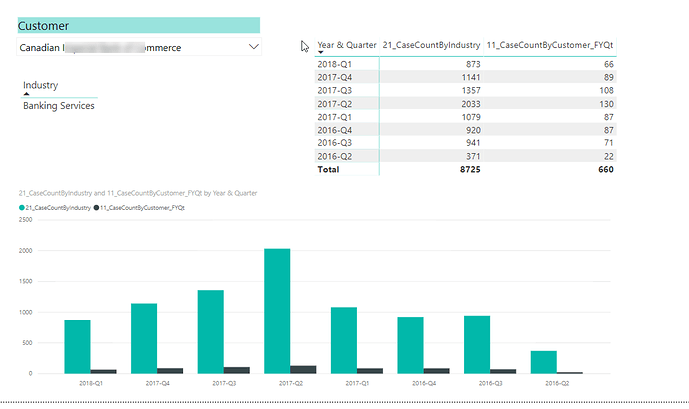
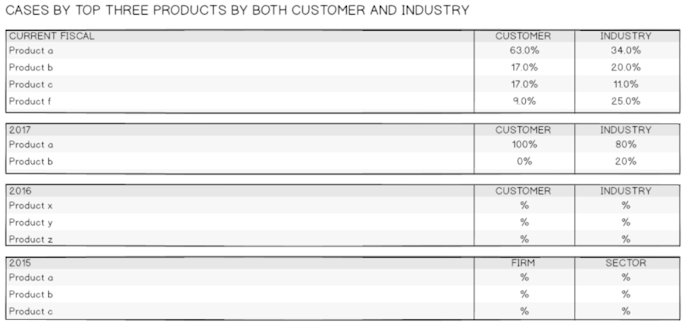
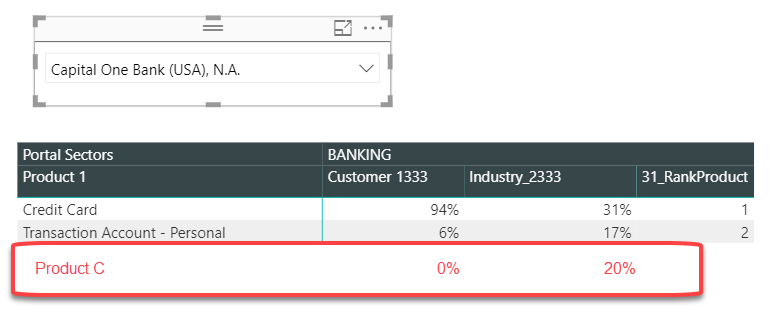
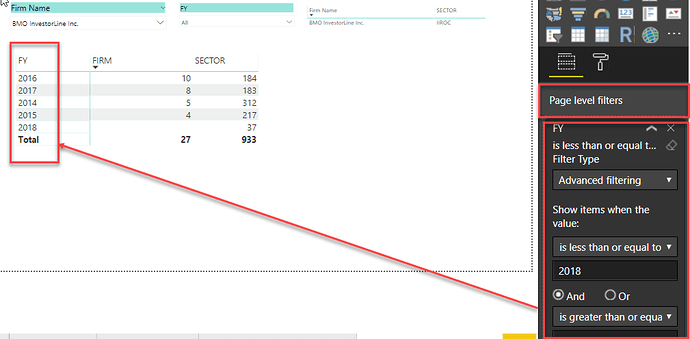
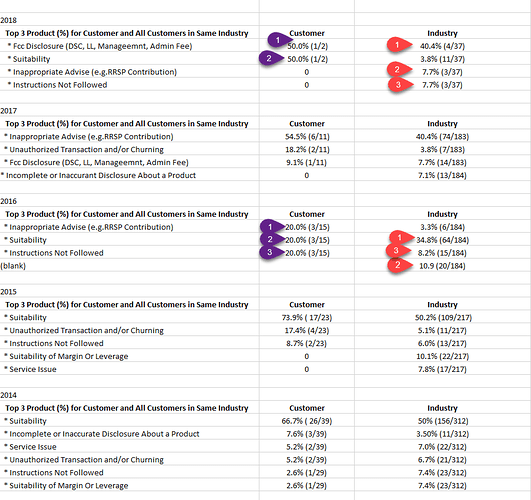
Questions: I would like to display the number of cases by customer Vs Number of Cases by Customer’s industry of Current QuarterTD + 4 previous Quarters. How to achieve in bar chart dynamically?

