Combining Bi-Monthly reports to month wise (SAP -ME2J)

  1. We run “ME2J” T-code in SAP ERP system to extract Purchase order history.

  2. This report provides purchase order details upto the date of extract.

  3. We need to prepare month wise Purchase order history details based on these reports.

  4. We have planned to extract this report bi-weekly and paste it in a single sheet.

  5. The expected month wise output is as per “Purchase Order History” Sheet.

Following are conditions to calculate Purchase Order History.

  1. Months columns shall be as per Project Start & Finish date. e.g. Project Start date is 31-Jan-23 and Finish date is 31-Dec-23.

  2. In the 15-Jan-23 & 31-Jan-23 reports, there was only a single PO (7500012345). Therefore , PO amount will be the product of quantity and unit price of that single PO.

  3. In the 15-Feb-23 report, a new PO was placed (7500003456). In the 28-Feb-23 report, the quantity of line item 1 of that PO changed from 30 to 45 and there is no change in earlier PO (7500012345). Therefore, only PO value of 7500003456 as on will be shown in Feb-23 column.

  4. On 15-Mar-23 , there is deletion mark “L” on PO 7500012345 Item Number 3 and quantity of line item 3 of PO 7500003456 changed from 87 to 1200. Further, line item 2 of PO 7500003456 changed from 67 to 100.

Therefore, line item 3 of PO 7500012345 will show negative value & line item 2 & 3 will show PO value as per 31-Mar-23 report.

  1. On Apr-23, only one report was extracted.

I have highlighted these changes in each sheet with an orange color.

PO Amount = Quantity x Unit Rate
SAP ME2J.xlsx (29.1 KB)
Hi Prafulla,
with SAP downloads you easily have lots(!) of rows, which can slow down your processing.
=> if you only track the monthly status changes, go for the last available download of the month [you will have to process only half the data]
=> dump the results of your data processing and use it as base for the next processing [you do not have to process all the previous months again and again]

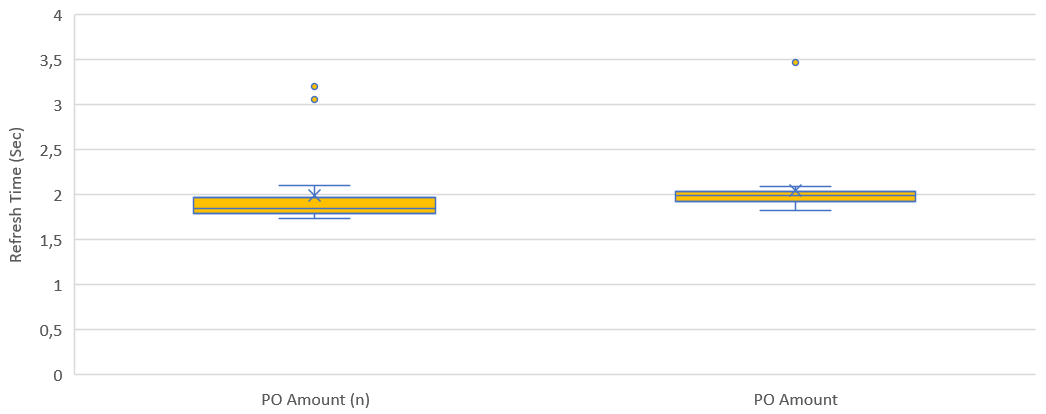
This slightly altered code is for the example data minimal quicker than your original code. Perhaps it is noticeable with bigger data sets.

let
    Source = Excel.CurrentWorkbook(),
    #"Filtered Rows1" = Table.SelectRows(Source, each ([Name] <> "_KeyDates")),
    ExtractedTextAfterDelimiter = Table.TransformColumns(#"Filtered Rows1", {{"Name", each Text.AfterDelimiter(_, "_"), type text}}),
    RenamedColumns = Table.RenameColumns(ExtractedTextAfterDelimiter,{{"Name", "Cut-Off"}}),
    ExpandedContent = Table.ExpandTableColumn(RenamedColumns, "Content", {"PO No", "PO Item", "Description", "Quantity", "Unit Rate", "Deletion Indicator"}, {"PO No", "PO Item", "Description", "Quantity", "Unit Rate", "Deletion Indicator"}),
    FindPoAmountQTYxUR = Table.AddColumn(ExpandedContent, "Amount", each if [Deletion Indicator]="L" then 0 else [Quantity] * [Unit Rate], type number),
    #"Grouped Rows" = Table.Group(FindPoAmountQTYxUR, {"PO No", "PO Item"}, {{"FullTable", each Table.AddIndexColumn(_,"Index")}})[[FullTable]],
    #"Added Custom" = Table.AddColumn(#"Grouped Rows", "Custom", each let 
        AllDataTable=[FullTable],
        PreRowValue=
        Table.AddColumn (
            AllDataTable, "PrevValue",
            each try AllDataTable [Amount] {[Index]-1}
            otherwise 0 ) in PreRowValue)[[Custom]],
    #"Expanded Custom" = Table.ExpandTableColumn(#"Added Custom", "Custom", {"PO No", "PO Item", "Description", "Quantity", "Unit Rate", "Deletion Indicator", "Cut-Off", "Amount", "PrevValue"}),
    #"Changed Type" = Table.TransformColumnTypes(#"Expanded Custom",{{"PO No", type text}, {"PO Item", type number}, {"Description", type text}, {"Quantity", type number}, {"Unit Rate", type number}, {"Deletion Indicator", type text}, {"Cut-Off", type date}, {"Amount", type number}, {"PrevValue", type number}}),
    #"Inserted Subtraction" = Table.AddColumn(#"Changed Type", "PO Amount", each [Amount] - [PrevValue], type number),
    #"Removed Columns1" = Table.RemoveColumns(#"Inserted Subtraction",{"Amount", "PrevValue"}),
    #"Filtered Rows" = Table.SelectRows(#"Removed Columns1", each [PO Amount] <> 0)
in
    #"Filtered Rows"