Hi,
It is me once again
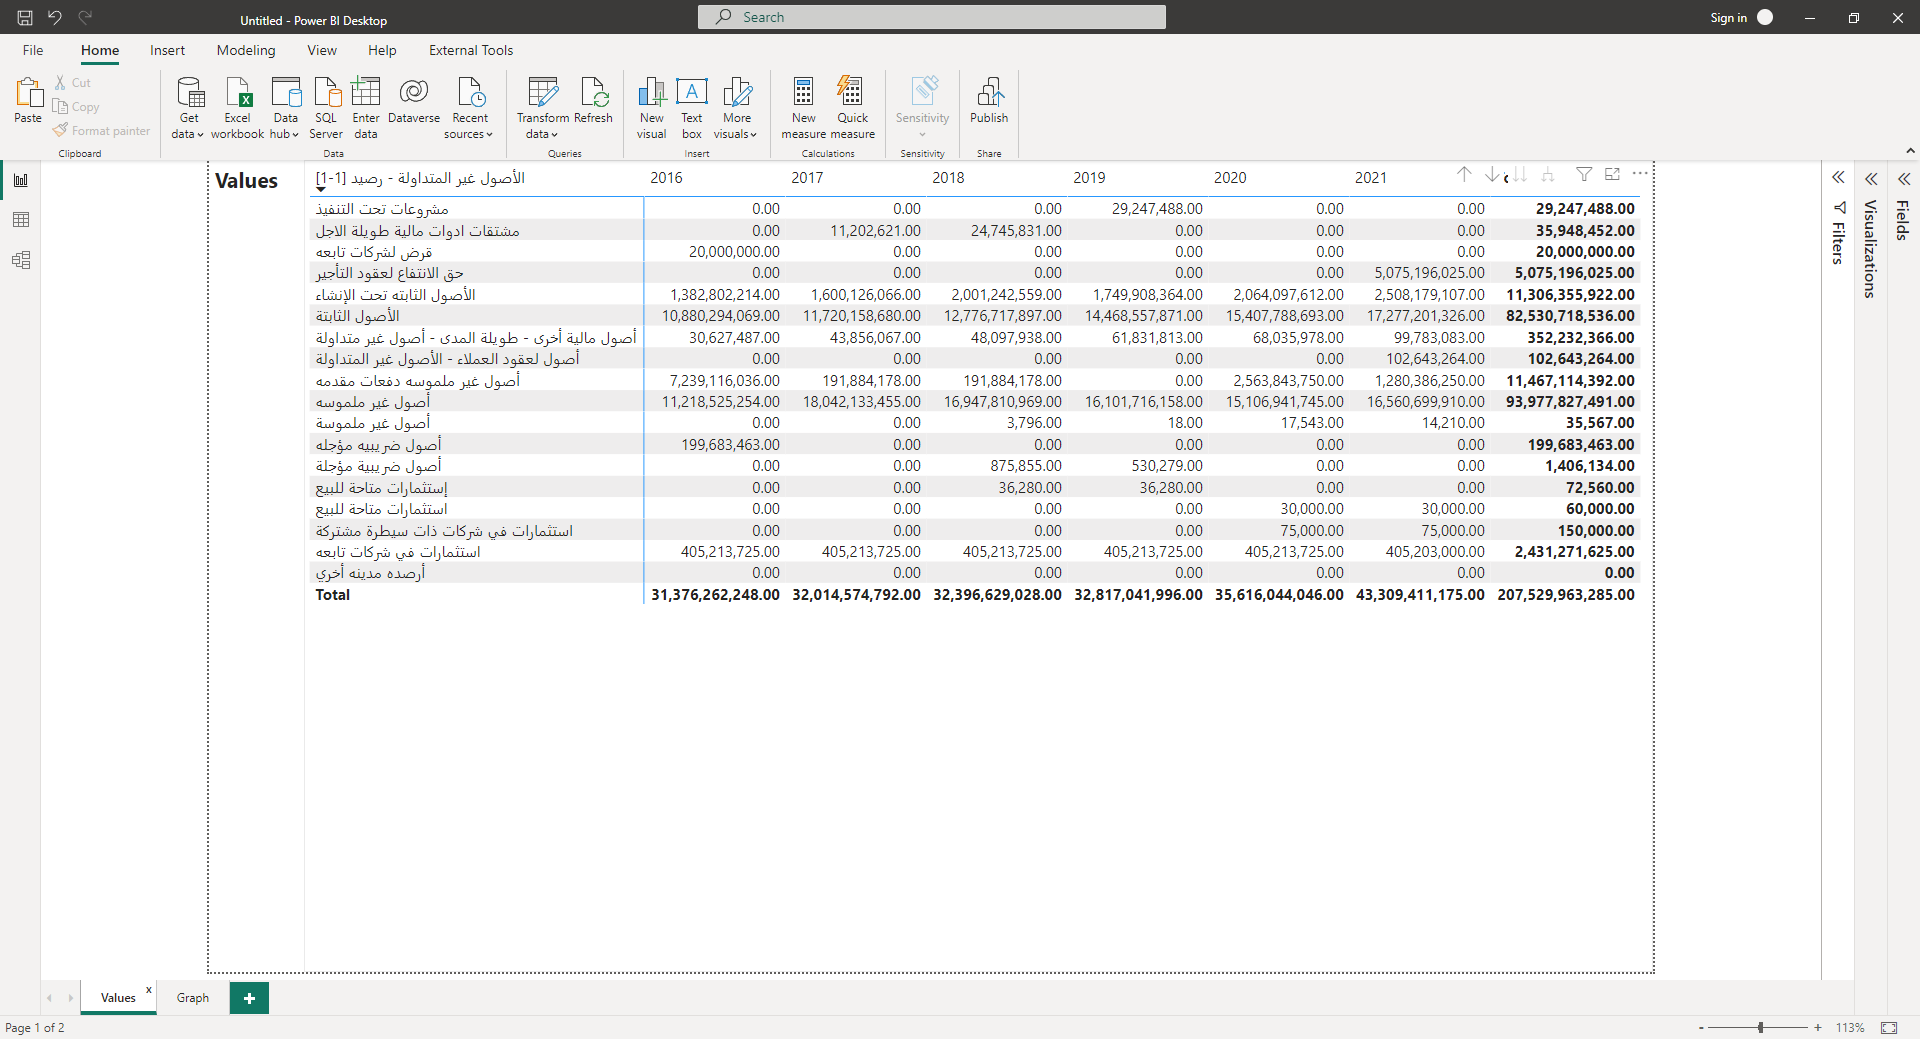
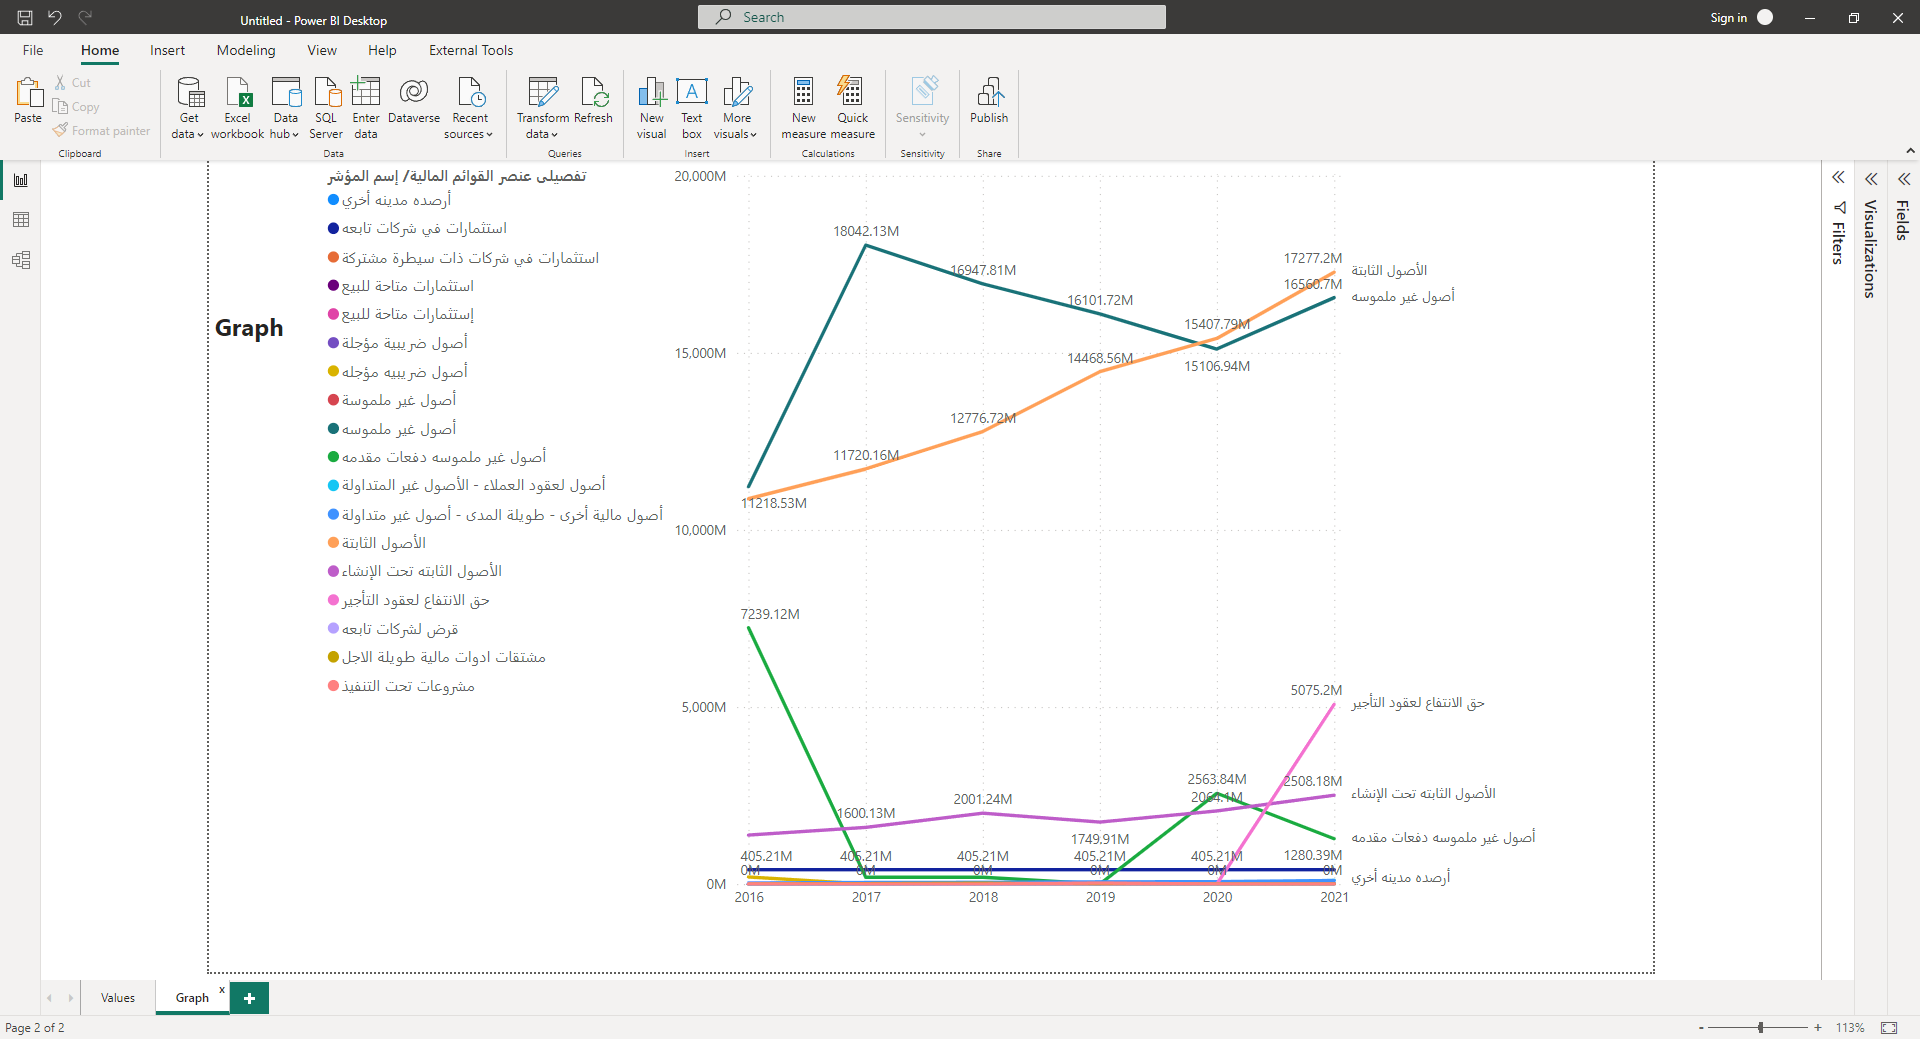
Please, I’ve two pages in Power BI
Both are the same data except that one is viewed as a matrix and the other is viewed as a line chart.
is it possible to view them on
one single page, one above the other?
And when to click on the word Values to view the matrix, and when to click on the word Graph to view the line chart.
Is it possible?
1st:
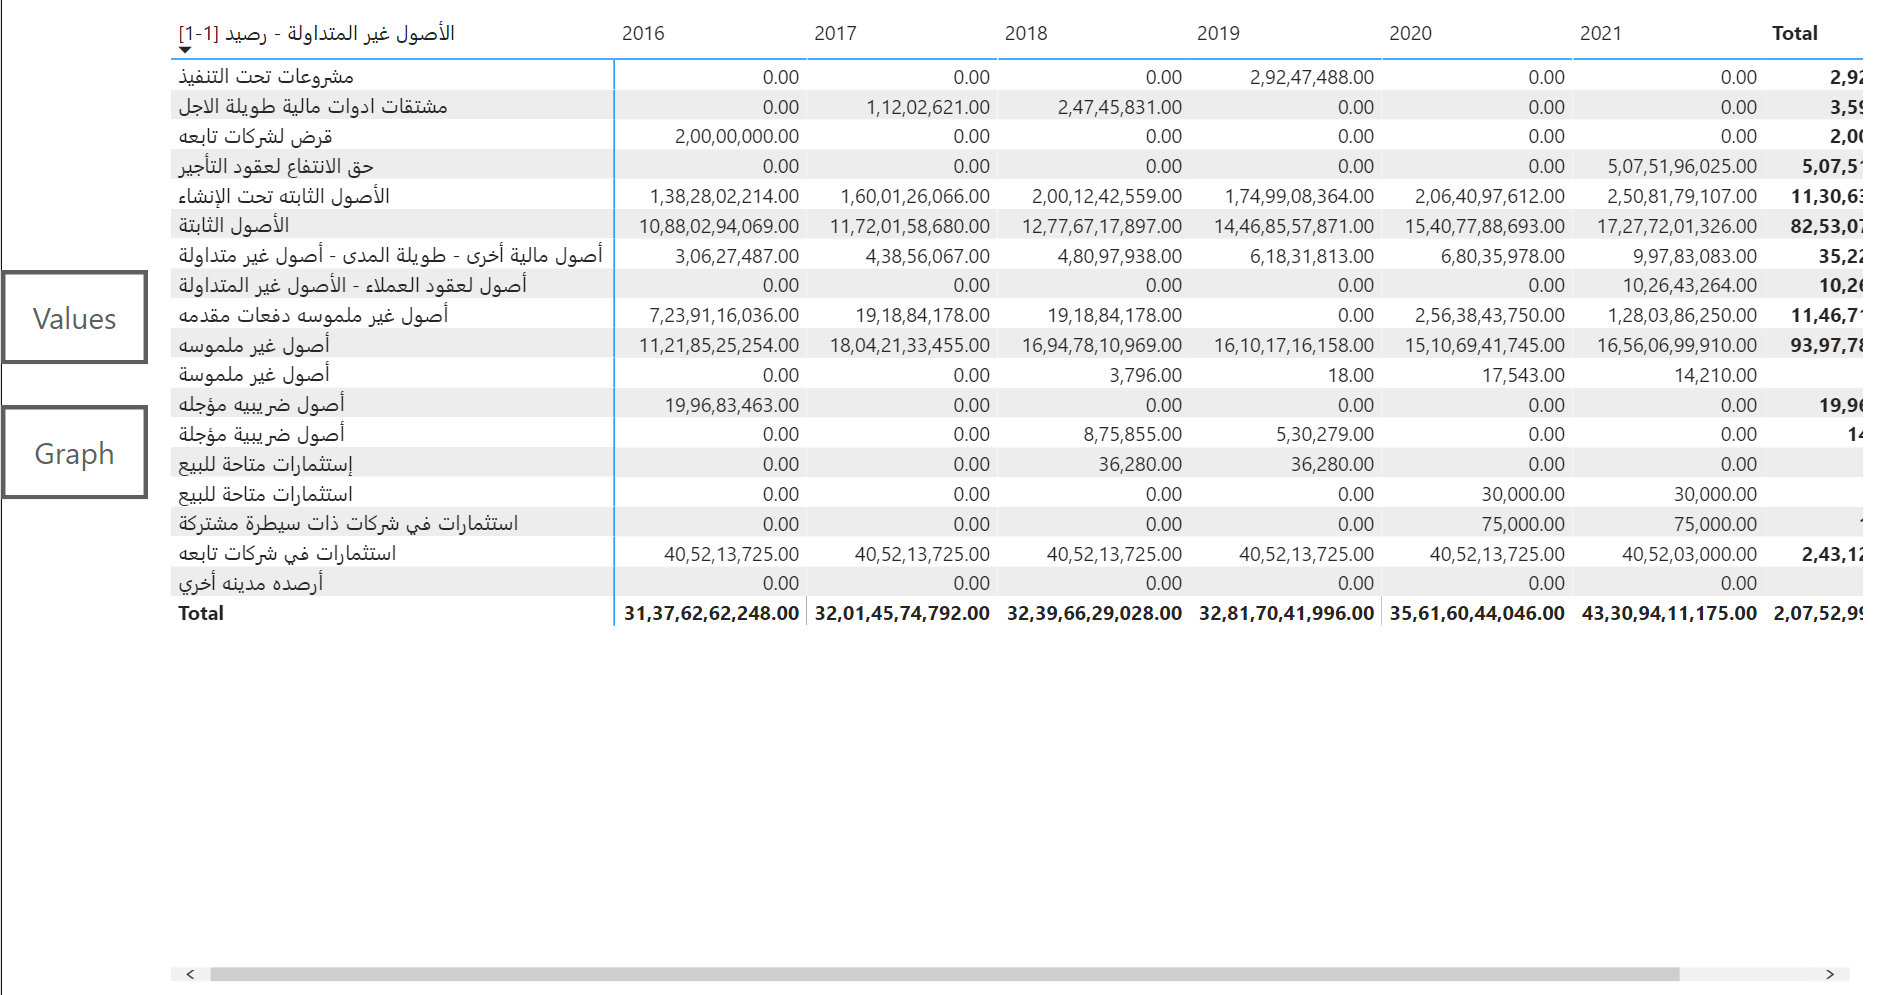
You can use the bookmarks technique to swap between the layouts on the same page. Below is the screenshot of the final results provided for the reference -
Hi,
I do not know why, but for some reason, the buttons in the file you thankfully attached earlier are not working.
I’ve even deleted it and created them all over once again, but still not working. Test (1).pbix (126.4 KB)
Upon downloading the provided PBIX file, I don’t see any problems with the buttons whatsoever. They’re working all fine. When I’m clicking on Values it’s showing “Matrix” visual and when Graph button is clicked it’s showing “Line Chart” as expected. Below is the screen recording provided for the reference -
Are you simply clicking on the buttons? If so then it’ll not work, please refer the note which I’ve written above -
In Power BI Desktop, you’ll have to press “Ctrl + Click” to change the layouts whereas in Power BI Service, just press click.
Please create a new thread for the new scenario’s. The solution provided onto this thread is based on the original query which was posted in the initial post. Please refer the Forum guidelines for the reference purposes.


")

")