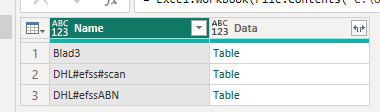
I am about to put together our customer lists that are currently lying on a series of spreadsheets. I will attach one of those sheets as an example below.
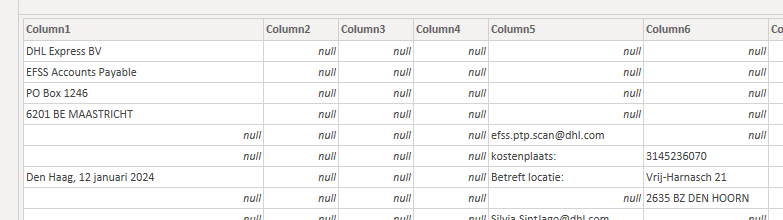
The addresses are always starting from row number 8 and is always four rows. However, there are other email addresses and notes that could be on column E, F and G.
To make this worse, every customer is in a single excel sheet and it is possible that there are more than one excel sheet for each customer.
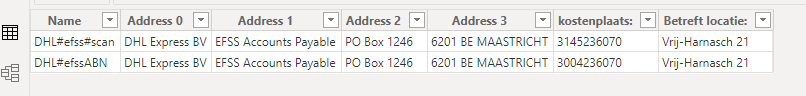
What I would like to do is to pull them all together using power query so that it will show one customer per row with all other information such as address, postcode, emails, phone, etc, in each column.
I would be grateful if someone can help me with sorting them out.
Get the data - using the normal “Get Data” experience, select one of your sheets from the workbook (doesn’t matter which one)
Delete the “Navigation” step - this is the step where you picked the sheet. So now you have all of the worksheets in separate tables, and the name of the tab they are on.
if you hover over the table, you’ll see the data, and because there is nothing above row 8, that is where your data should start for each of the tables.
Next, you need to start shaping this data, the address is easy, because it is all in the first column, and with no spaces. I’ve added a new column with
= Table.AddColumn(Source, “Address”, each Table.SelectColumns([Data],“Column1”)
to delete the extra rows (assuming that none of those are needed), we can add in Table.FirstN to keep a certain number of rows:
= Table.AddColumn(Source, “Address”, each Table.FirstN(Table.SelectColumns([Data], “Column1”),4))
adding a new column, with an Index field (so we can later name the columns appropriately for the address fields)
= Table.AddColumn(#"Add Address", "Address with Index", each Table.AddIndexColumn([Address], "Index", 0, 1, Int64.Type))
Isolating the data in the other columns might be a bit harder, depending on how much they vary from the examples you provided, I’m not going to lay out all the steps here, but I they are included in my attached example.
Once I had isolated both sets of data, I removed a bunch of helper columns (see example) and Unpivoted the two “with Index” columns (you need to keep the unique tab names column for this part).
Next, expand the tables in the value column, and begin cleaning your data.
You’ll want to use the index columns to create proper names for each of your pieces of data, and then re-pivot the columns (see example)
NOTE - this does create an error for the email, because you have more than one on both of your examples - you’ll need to work out which one you want to keep if you’re going to have unique values. For my example, I removed that column for now.