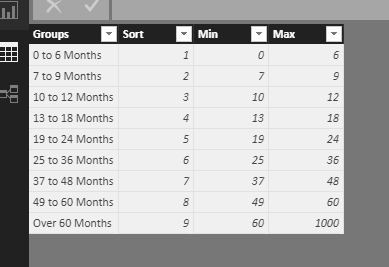
So to get going on this I built out the grouping table by adding some min and max values

Now that we have these you can use DAX formulas to run logic over this particular table.
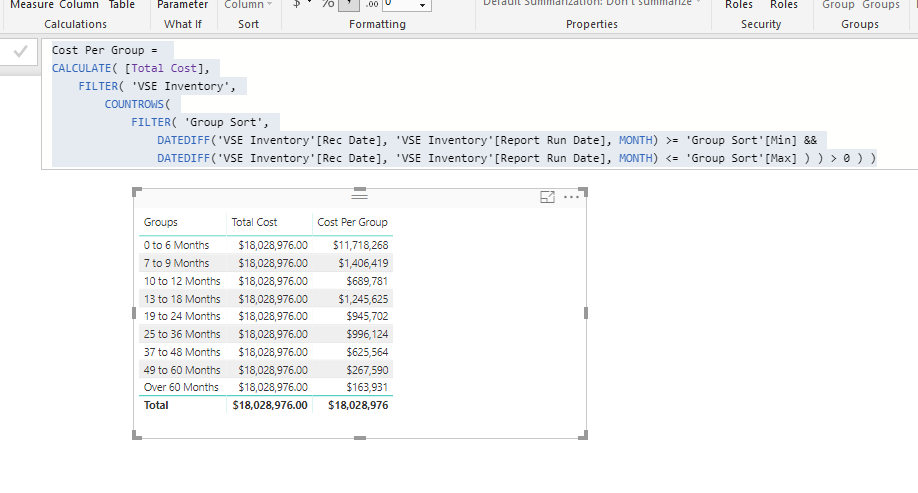
This is the formula I use. You’ll see that you don’t even need any calculated columns at all (you rarely ever do in fact table - I don’t recommend it)
Cost Per Group =
CALCULATE( [Total Cost],
    FILTER( 'VSE Inventory',
        COUNTROWS(
            FILTER( 'Group Sort',
                DATEDIFF('VSE Inventory'[Rec Date], 'VSE Inventory'[Report Run Date], MONTH) >= 'Group Sort'[Min] &&
                DATEDIFF('VSE Inventory'[Rec Date], 'VSE Inventory'[Report Run Date], MONTH) <= 'Group Sort'[Max] ) ) > 0 ) )
You’ll see here I’m comparing it to just using the total cost measure which is obviously incorrect.
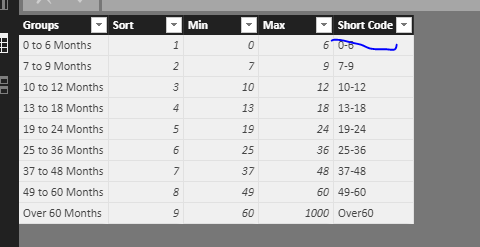
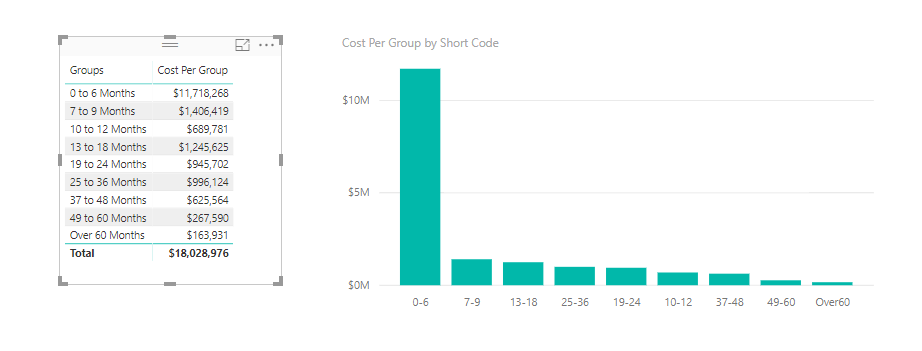
Maybe you actually want to add a short code for the visual as well

Now the hard part is building out the future forecasts. I’ll have to complete some more testing on this
Attached
E&O Reserves.pbix (1020.0 KB)

