Aged Debtors by Selected Date

Hi All,

I have a dataset that contains 3.2m rows of accounts receiveable data. My users would like a slicer/filter that allows them to select the date they’d like to run the report and the result would something similar to below.

2018-08-31_13-52-25

Each row in my dataset contains (amongst other columns) the due date, the clearing date (ie. date settled), the customer number and the value of the invoice. The data to be displayed would be all invoices with a due date prior to the date selected that have no clearing date or a clearing date after the date selected. I’ve managed to achieve this with a series of measures and filters but having issues with the report taking a long time to refresh and when running from the service we get an “out of memory” error if not enough fields are filtered. I’ve attached an example file with data in question and our current methodology. Anyone know how I can achieve the same result in a more efficient manner?

Aged Trial Balance Example Data.pbix (113.8 KB)

Thanks,

Marcus

Check out this solution here, it’s almost identical to what you require.

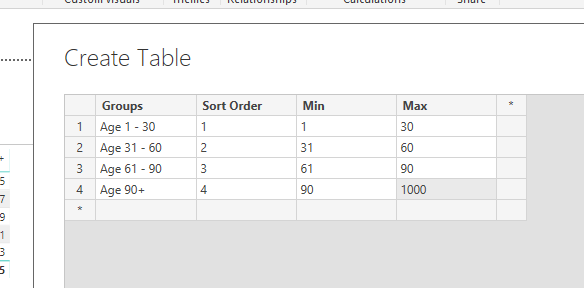
The key is to create a secondary table and iterate through it.

It is actually exactly the same. You can just copy it completely.

Here’s something I quickly wiped up

image

Cost Per Group = 
CALCULATE( [Total Value],
    FILTER( 'Transaction Table',
        COUNTROWS(
            FILTER( 'Aged Debtors Group',
                DATEDIFF('Transaction Table'[Due Date], 'Transaction Table'[Clearing Date], DAY) >= 'Aged Debtors Group'[Min] &&
                DATEDIFF('Transaction Table'[Due Date],'Transaction Table'[Clearing Date], DAY) <= 'Aged Debtors Group'[Max] ) ) > 0 ) )

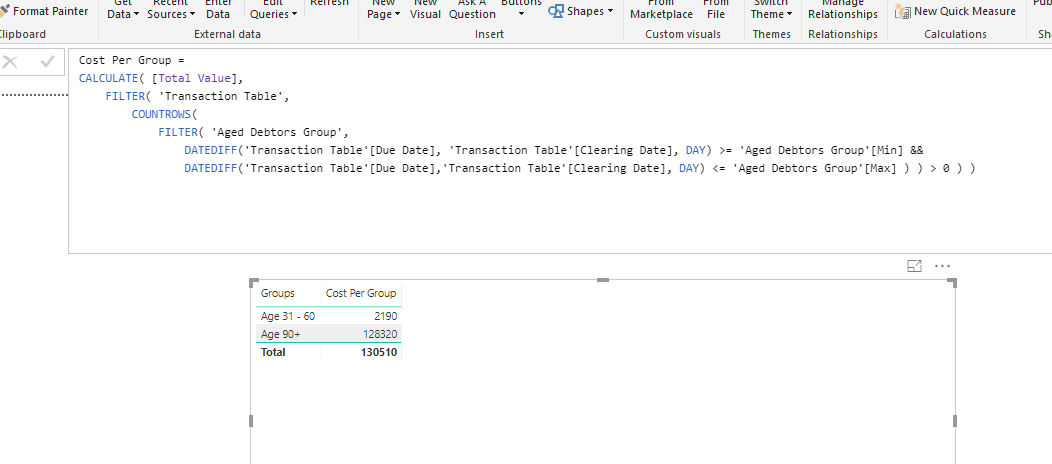
Let me know if this is what you were targeting. Maybe you might have to have a play around with the concept to get it exactly right.

Attached
Aged Trial Balance Example Data.pbix (125.4 KB)

Thanks Sam. This is a massive help and works in my dummy data so will now try and implement in my live data to see if it rectifies the issue.

Still very confused by this formula. Can you point me in the direction to read up a bit more about this? Am I right in saying it is iterating through the transaction table to see which lines match to the filters in the grouping table? How is countrows working in the above? I assume it returns a number so aren’t we just filtering the transaction table by a number?

Here’s a few link to review. I cover this one a lot as it’s a really powerful combination of formulas that can be used in many situations.

Thanks Sam. Think it’s starting to make sense. Great method!