Circular Dependency detected - Inventory analysis

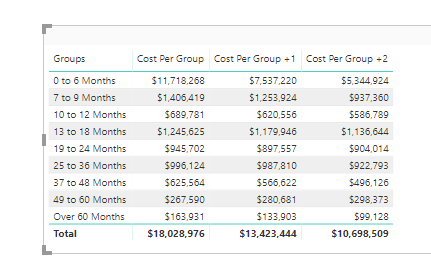
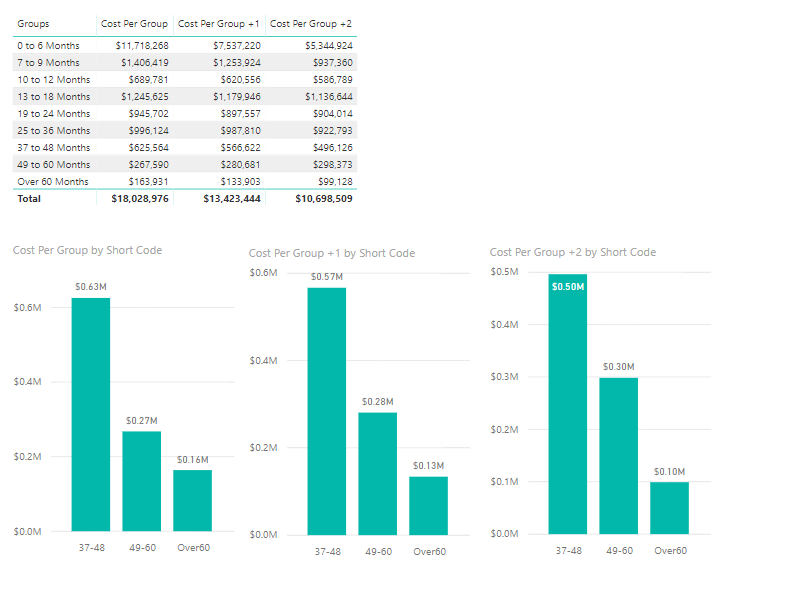
Here is what I’m trying to accomplish. We have inventory with different month ages. If it is 0-6 months old, we reserve 10% of total cost, if it’s 7-12 months old, we reserve 20% of total cost, and 50% of total cost above 12 months age.

I can get this total easily with the calculated columns below. My issue is I want to predict what our reserves will total next month, if we don’t sell anything. So I create another calculated column that adds 1 month to the current months aged calculated column and group that new column into my month groups…long story short, I get a circular dependency error. After research, it has to do with multiple calculated columns in the same table. I tried to create a measure “datediff” but I have to use Min, Max, or Sum and none of these work with my table due to different issues. How can I accomplish this?

I have a table:
partnumber, qty, cost, receive date, report run date
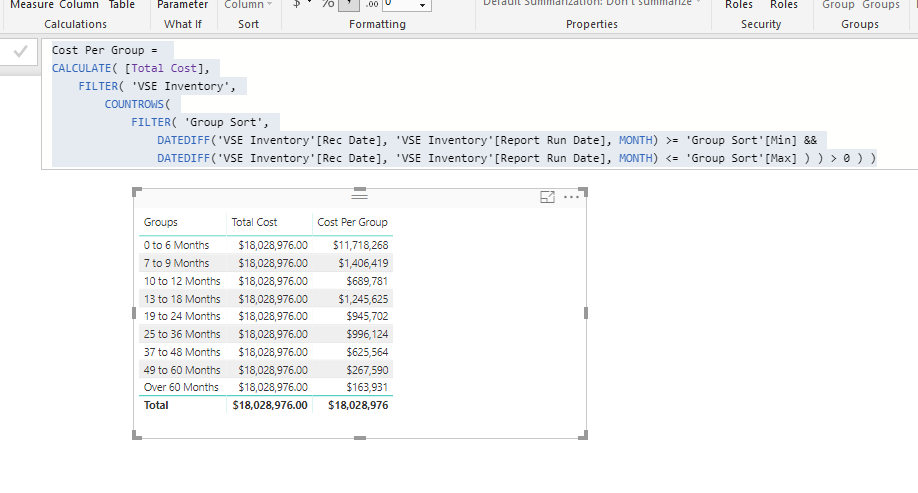
Measure:

Total Cost = SUMX(Table1, Table1[Qty]*Table1[Cost]

I created a calculated column:

Months Aged =
DATEDIFF('Table1’Receive Date], 'Table1’[Run Date], MONTH)

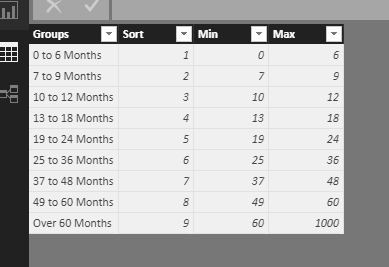
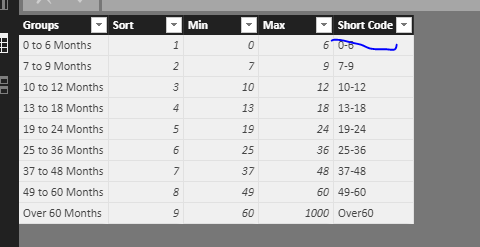
I grouped the “Months Aged” column in 0-6 Months, 7-12 Months, Over 12 Months

Created a calculated column:

E&O Reserves =
IF(Table1[Months Aged (groups)] = "0-6 Months", [Total Cost] *.1,
IF(Table1[Months Aged (groups)] = "7-12 Months", [Total Cost] *.2,,
IF(Table1[Months Aged (groups)] = "Over 12 Months", [Total Cost] *.5,0)))

This all works great. I want to predict what our E&O Reserves are going to be next month if we don’t sell a single item.

I created a calculated column:
Months Aged +1 =
‘Table1’[Months Aged] + 1

I grouped the “Months Aged +1” column in 0-6 Months, 7-12 Months, Over 12 Months

Created a calculated column:

E&O Reserves +1 =
IF(Table1[Months Aged (groups) +1] = "0-6 Months", [Total Cost] *.1,
IF(Table1[Months Aged (groups) +1] = "7-12 Months", [Total Cost] *.2,,
IF(Table1[Months Aged (groups) +1] = "Over 12 Months", [Total Cost] *.5,0)))

I get a circular error with the E&O Reserves +1 column.

I can fix all of this by just adding a column to my table through the query editor but then I would have to write the datediff function in m language because I need it to convert to two dates down to month difference. I can’t find how to use datediff in the m language.

Circular dependencies usually arise from relationships not being correct. Is that what is happening here you think?

Can you post an image of the model and everything your describing? It’s quite difficult to imagine every variable at play here.

If you can create a demo example as well that could be helpful.

Usually I find with circular dependencies it’s all about the model. Getting the model right. There does seem to be a lot of calculated columns here, can you push any of the calculations and logic to measures?

I feel you probably could here but would likely have to see more to understand the scenario better and maybe test some things.

I would always prefer here to use measure and make it dynamic in some way. With calculated column you can do this and they will only update on a refresh of your model

E&O Reserves.pbix (1010.5 KB)
Here is the file. I included an image on the page of what I’m trying to display. I got it to work in another file but that file is way to complicated and I wanted to come up with a simpler way of getting the data. I have issues with this file attached already so I need help.

Here is what I’m trying to accomplish. We group our inventory into age groups. If inventory is between “37 to 48 Months” old, we reserve 10% of the total cost. If inventory is between "49 to 60 Months, we reserve 20% of the total cost. If over 60 Months old, we reserve 50% of total cost. We ignore all inventory below 37 months from reserves.

I want to display what we currently need to reserve, and project out over the next 6 months, what we will have to reserve if we don’t sell anything in these groups. With each passing month, some inventory will move from one bucket to the next, and inventory currently only 36 months, which we ignore this month, will be added to the “37 to 48 Month” bucket next month…

As a business, we want to look at this and say: Currently, we have $103,702 in reserves for our inventory today, but over the next 6 months, if we don’t sell anything, our reserves will increase to $153,464. So we have a $50k liability if we do nothing and sell nothing.

I don’t care how we come to display this information and clearly the way I’m trying to do it is not working.

Right, very interesting use case. A bit to this. I’m reviewing the file and will likely have to test numerous things and come back.

The very key concept here which simplifies this immensely is learning about segmentation and grouping techniques.

The model looks good and you were close with the grouping table, but working it back in via formula is the important step.

Here’s some videos reviewing these techniques. (I’m sure you will go aha when you watch some of these )

I’ll come back and show you the results shortly.

So to get going on this I built out the grouping table by adding some min and max values

image

Now that we have these you can use DAX formulas to run logic over this particular table.

This is the formula I use. You’ll see that you don’t even need any calculated columns at all (you rarely ever do in fact table - I don’t recommend it)

Cost Per Group = 
CALCULATE( [Total Cost],
    FILTER( 'VSE Inventory',
        COUNTROWS(
            FILTER( 'Group Sort',
                DATEDIFF('VSE Inventory'[Rec Date], 'VSE Inventory'[Report Run Date], MONTH) >= 'Group Sort'[Min] &&
                DATEDIFF('VSE Inventory'[Rec Date], 'VSE Inventory'[Report Run Date], MONTH) <= 'Group Sort'[Max] ) ) > 0 ) )

You’ll see here I’m comparing it to just using the total cost measure which is obviously incorrect.

Maybe you actually want to add a short code for the visual as well

image

Now the hard part is building out the future forecasts. I’ll have to complete some more testing on this

Attached
E&O Reserves.pbix (1020.0 KB)

Maybe not as difficult as first though. You’ll have to check the logic to make sure this is correct though.

According to the explanation though I feel you could just adjust the formula slightly to forecast what it would look like in one month.

See below

Cost Per Group +1 = 
CALCULATE( [Total Cost],
    FILTER( 'VSE Inventory',
        COUNTROWS(
            FILTER( 'Group Sort',
                DATEDIFF('VSE Inventory'[Rec Date], 'VSE Inventory'[Report Run Date], MONTH) - 1 >= 'Group Sort'[Min] &&
                DATEDIFF('VSE Inventory'[Rec Date], 'VSE Inventory'[Report Run Date], MONTH) - 1 <= 'Group Sort'[Max] ) ) > 0 ) )

image

Then you can just do the same for each future forecast

See below for result on visuals

Updates attached
E&O Reserves.pbix (1000.2 KB)

This is a very elegant solution for something quite complex. Anythings possible by utilizing DAX to the fullest.

Hopefully this cover what you need.

1 Like

You sir, are amazing. I’ve learned so much from you. Thank you for helping me out with this.