I have what seems a very simple requirement to group the results of a measure into a chart whilst in direct query mode (client requirement as part of embedding).
I created a measure that groups my data into three sections based on if a project is ahead, on track or behind its target margin.
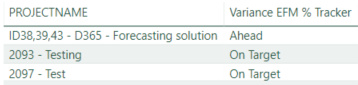
I can easily show my results by project in a table as below but then cannot simply drop a chart (donut) over this as you cant put the “variance” measure into the values field well.
If I wasn’t in direct query mode I would simply spin up a new table and create a custom column to store the variance results per project but I cannot do this as unable to use calculate as part of a calculated column in Direct Query mode.
Seems a simple ask but can’t see the simple solution?
Just trying to understand this entirely. I think I mostly get it.
Is the measure - Variance EFM % Tracker?
If this is then yes it can’t become an axis on a chart.
This was another post with a similar request to this
The example contain in here is certainly not an efficient way to solve this but an example nonetheless
What I think you really want to be doing here is using supporting (or secondary tables) to group this results.
This is how you can get a physical column that can be used as an axis. It does require create these extra tables but I believe it’s the most efficient way to solve this.
Having discussed the needs of the client in more detail we have now agreed that we will create a new table within their ERP system that stores the historical data about a project. A sort of snapshot in time being taken at each project review / month end which I will then easily be able to report against in the way I was struggling - plus quite a few others.
The real need for this new table is that some of the data is only stored once in the system (for example projected project end date) so without snapshotting what this is each month we would be unable to track how it has evolved during the project lifecycle. Capturing a few fields of data in this way will make my life a whole lot easier and simpler for the client to understand