Returning Distinct Values in Dax

Does anyone know a way to return all of the distinct values in a column via a slicer selection. I understand how to do this using measures e.g if “Revenue” is selected then return revenue. However, what I am wondering is if the user selects from a slicer “Paint” or “Style” it will return all the different styles that are in my table, e.g. if paint is picked it will return:

red
green
blue
Yellow… anything that is in my data table.

I am trying a few methods but I keep receiving “multiple values returned when one value is expected error”

Any Ideas how I might implement this?

Are you using the DISTINCTCOUNT function? That should do it easily.

You can also use a technique of:

COUNTROWS(VALUES( ColumnName))

Both will work out the same.

Well i wasnt actually trying to return the count of it, i want the actual raw values?

e.g not 3 different colours but the actual colours themselves stored in my data

here is a photo of what i am trying to do

i am trying to return a metric selected and then visualising it against the category selected. e.g paint by profit will give me a graph/ table of all my paint colours present and its relating profit. That way i can have a dynamic chart based on 2 dynamic axis.

Or is this impossible as you cant have a measure as an axis?

Ok, I would have thought this would be quite easy, just place the colour column into a chart?

Am I missing something here?

If there is a profit for a particular colour in the current context then that would just automatically show in the visual wouldn’t it?

Maybe place some pictures of the tables and model as to me this should just be very easy…so I’m likely not understanding what you have in your model.

Yes that is correct i could easily place all of the columns into the visual and then let the user drill down, However, I was wondering if there was a way i could minimize the training/ increase the usability of it by instead of needing them to learn how to drill, I would let them choose from a slicer what they would see.

So instead of this
image

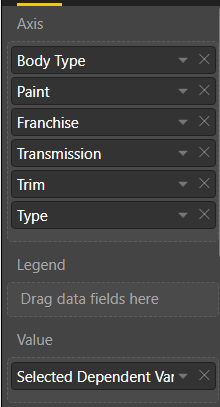
I could just have selected value of slicer in the axis instead which dynamically provides one of the selected options and all of its distinct values in the chart.


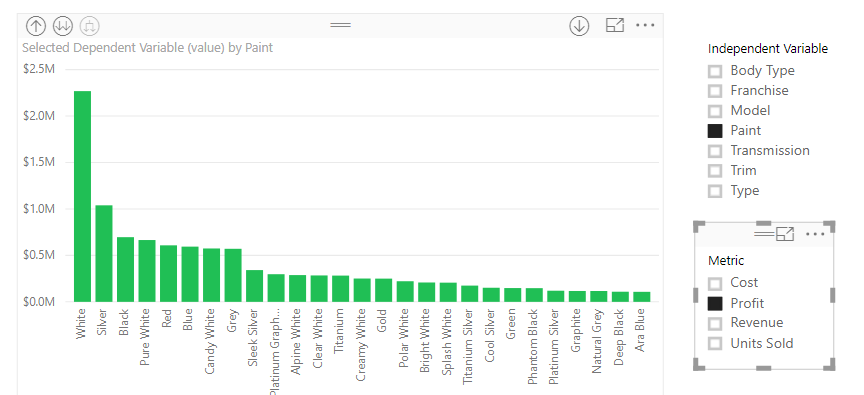
Note* the slicer names independent variable isnt doing anything but i placed it there to show example.

Ok I get it now. Sorry I just wasn’t understanding the requirement.

I actually haven’t done anything on this (but will, because I like it).

I’ve found a link that shows you how to do it.

I would think carefully around if there is maybe a better way to showcase this in your report as the work around is quite a bit and can make you model more complex that it may need to be.

Thanks Sam, I tried looking around for answers but couldn’t find anything.
This solution seems like a lot of overhead. Multiplying my unique entries by the number of columns i wish to slice by puts my table size out to hundreds of thousands for just a change in functionality.

Cheers, Ill keep thinking about it.

Yes certainly not simple, so requires some thought around the visualizations. If this is in a bigger model I wouldn’t really go for it, too complex

Sam, I have the same requirement and eagerly waiting for simplified solution