Here’s my writeup 
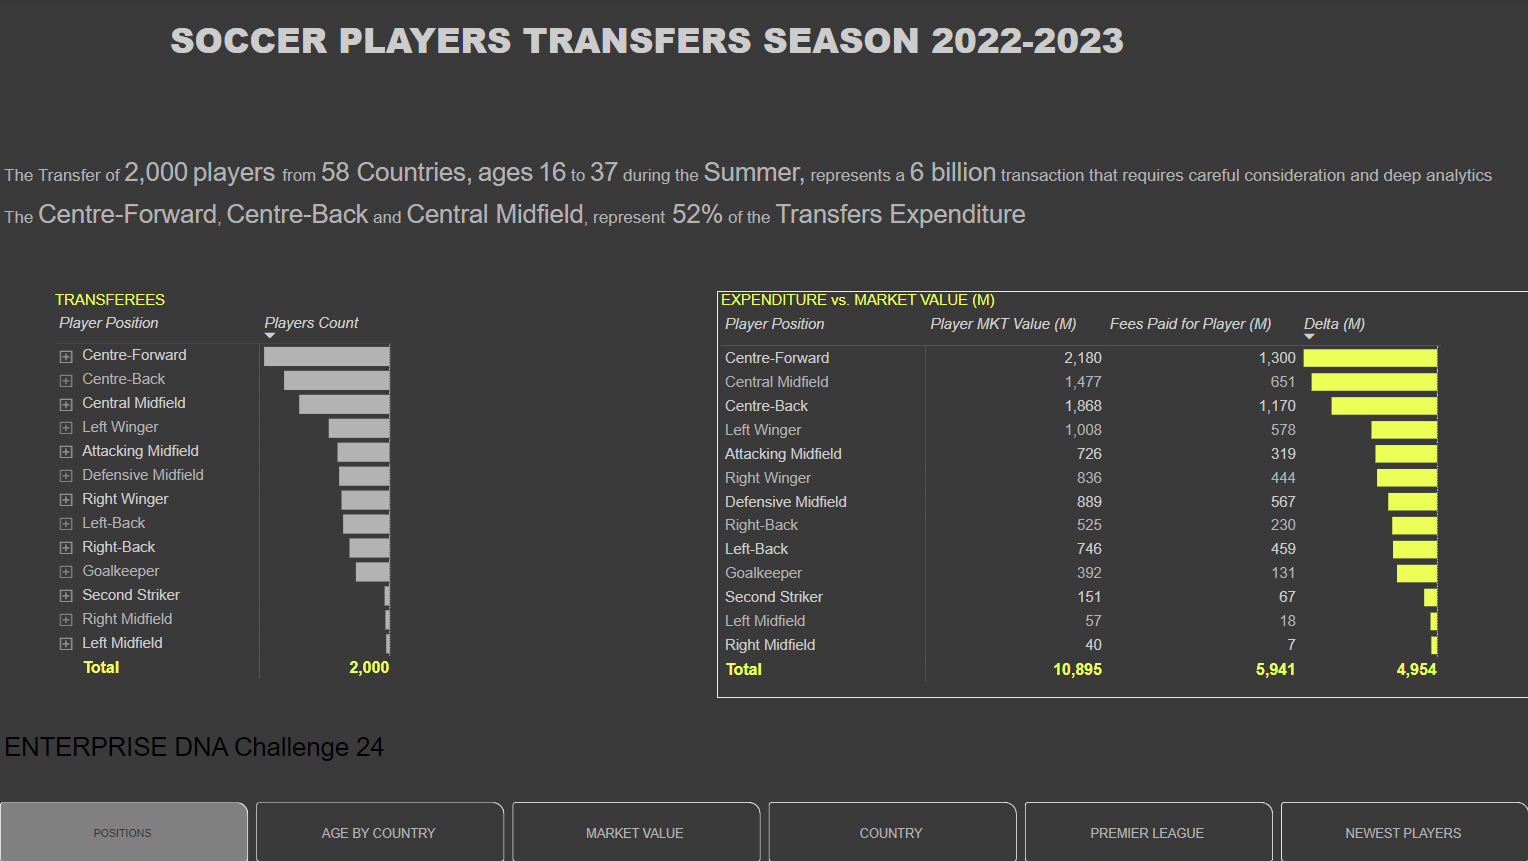
OVERVIEW
First of all, thanks to EDNA Team for providing this challenge. It’s been a great opportunity for me to continue my learning process, and I was happy to join you as a first-timer
I’ve started with BI in September, less than three months ago. That is only third report I’ve done and the final one i’ve planed for my portfolio, which has so far consisted of slide deck style report and something closer to web-app style. For third I wanted to create a completely webapp-like report, using advanced bookmarks (which I’ve barely used before), high quality layout and displaying selfmade custom charts.
As you may guess, it didn’t really fit too well with this challenge, since basic requirement was slidedeck. But I really wanted to take an opportunity to challenge myself and compare vs other BI devs, so I’ve decided to participate and create a hybrid, combining web-app style with advanced design and depth together with an easily navigable slide deck style. This way it can be used as slide-show for meeting, preseting main points, while allowing deeper analysis if you’d like to send it to your coworkers afterwards.
Major points of my plan:
- use advanced bookmarks to enable friendly navigation
- learn Charticulator and use it to prepare effective custom charts
- prepare hybrid navigation, fullfilling both challenge and my portfolio requirements
I’m looking forward to any criticism, I’ve learned a lot doing it and I hope to learn more!
DATA PREPARATION
In my first data preparation step I wanted to understand data provided as well as possible. Since we’ve been using real-life data of football transfer market, I’ve done some quick research to establish two important points:
-
Fees Paid for Player (M) was a transfer fee paid by new club to an old club, not a fee paid to a player. This way it seemed pretty important to analyze clubs in terms of transfer fees paid and received and establish which of clubs have made a significant profit or loss in this year’s transfer market.
-
Fees = 0 meant a free transfer (player’s contract ending in old club, allowing new club to sign him for free) and many known and high-valued players have been transferred this way, so clearly I needed to account for that.
I’ve also done some quick data cleaning:
-
Fees Paid and Market Value got multiplied by a million to allow easier display of currency type values formatted as “€ 10M” in visualisations
- replaced two cases of “attack” and “defence” player positions with more precise positions
- in cases of clubs playing in different country league, I’ve changed their country to reflect league’s. League country dominates over club’s actual country when it comes to football (for example AS Monaco gets their Champions League spot from French pool, Cardiff City would’ve got it from English instead of Welsh etc), so I thought it makes more sense.
DATA MODELLING
My model:
Clubs
First of all I wanted to create two major lookup tables - clubs and players. For clubs, I’ve done the following:
- referenced source data into TWO new queries
- first one, I’ve narrowed down to three columns: country playing in / current league / club
- second one, down to country moving to / new league / club
- appended second to the first one
- removed duplicates
- added index
This way I’ve got a table of 702 clubs from 67 countries.
Players
This one was way easier, as there was no risk of missing any clubs, as there was only one column for each players’ data type, compared to two (old club / new club) for clubs. What I did was:
- referenced source data
- narrowed it down to Player Name / Player Position (luckily there weren’t two players with the same name AND position in dataset - all such cases were the same player making couple of moves in transfer market)
- removed duplicates
- added a simple conditional column sorting 13 player positions in more logical order (GK, RB, CB … CF)
- built a custom column with only player’s last name; it required some digging in players’ data, and figuring out which part of longer names is first name and which is the last name; eventually I came up with following:
    #"Split Column by Delimiter" = Table.SplitColumn(#"Duplicated Column", "Player Name - Copy", Splitter.SplitTextByDelimiter(" ", QuoteStyle.Csv), {"Player Name.1", "Player Name.2", "Player Name.3","Player Name.4"}),
    #"Added Custom" = Table.AddColumn(#"Split Column by Delimiter", "Player Last Name", each if [Player Name.2] = null and [Player Name.3] = null then [Player Name.1]
else if [Player Name.3] = null then [Player Name.2]
else if [Player Name.4] <> null then [Player Name.2] & " " & [Player Name.3] & " " & [Player Name.4]
else if List.Contains({"de","van","da","De","Da","San","La","Le","del","Di","St.","Lo","El","Del","Delle",
"Zambo","Kolo","Issouf","Kofod","Dina","Akpa","Funes","Dybvik"},[Player Name.2]) then [Player Name.2] & " " & [Player Name.3]
else [Player Name.3]),
    #"Removed Columns" = Table.RemoveColumns(#"Added Custom",{"Player Name.1", "Player Name.2", "Player Name.3", "Player Name.4"}),
Transfers
Early on I’ve found out that it’s somewhat complicated to access single club incoming and outgoing transfers at the same time. I decided to model my data a bit differently, and I’ve doubled all entries in my Transfers table, basically going from this:
to this:
It required following steps:
- referenced source, then appended source table once again
- added Transfer ID (so with 2000 rows in source data, Erling Haaland was now ID=1 and ID=2001, Antony was ID=2 and ID=2002 and so on)
- merged with Players to assign Player ID
- merged with Clubs TWICE to assign Old Club ID and New Club ID
- added custom columns, basically filtering data of old club when ID <= 2000 and data of new club when ID > 2000:
#"Added Custom" = Table.AddColumn(#"Reordered Columns", "ID Club", each if [Index] > Table.RowCount(#"Source Data") then [ID Club Selling] else [ID Club Buying]), #"Added Custom2" = Table.AddColumn(#"Added Custom", "Direction", each if [Index ] > Table.RowCount(#"Source Data") then "Out" else "In"), #"Added Custom3" = Table.AddColumn(#"Added Custom2", "ID Club To/From", each if [Index] > Table.RowCount(#"Source Data") then [ID Club Buying] else [ID Club Selling]),
- substracted 2000 from all Transfer ID’s, so now both Haaland’s records are ID=1, Antony’s ID=2 etc
This way I came up with model which:
- allows me to easily browse incoming and outgoing transfers
- allows me to calculate clubs’ transfer market balance
- forces me to pay attention to filtering my visuals or measures, to avoid doubling transfer data
I ended up using Direction=IN filter a lot, but as a reward filtering clubs’ transfers became a trivial task.
Extra Tables
Later on I’ve decided to include three extra tables, all of which were disconnected from the model:
- LeagueTable
Here I’ve manually entered recent league tables (only position/club) of TOP5 leagues. Quick job for one useful visualization in each page of the TOP5.
- Tactics
Here I’ve prepared a sheet of 12 most common football tactics, with same position names as dataset and X/Y positioning of players in scatterchart I’ve plotted over football pitch in couple of pages.
- Countries
Table of unique country:country pairs, with a total of fees paid from first to second country. It was created by joining tables of unique country names and their Country ID’s with source data, converting country names to ID’s and grouping rows by ID-ID combinations and Fees Paid aggregation.
- FinanceMode
Tiny table with just two cells - “Market Value” and “Transfer Fee”, allowing user to select displayed financial data in couple pages.
LAYOUT
I’ve created my whole layout in Power Point, trying to move as many graphics as possible away from Power BI to improve performance of my report. All of graphical elements (pitch, club icons, photos, panels, navigation buttons) are part of a background exported from Power Point.
NAVIGATION
In report, I’ve had to build a couple of navigation panels, in order to keep up with hybrid idea of my project:
- Bottom bar navigation - Built with an idea of slide deck style. Whenever double arrow shows up, presenter can jump to previous/next of the key slides: Home, World, Age, Positions, Leagues, Best 11, presenting raport with only six slides containing most important information.
- Left-side panel and top bar sub-page navigation - Built with an idea of deep-dive analysis in form of web-app. Each of pages linked is a separate hidden page of a report. For TOP5 leagues I might’ve used a hidden slicer, but I wanted to include various clubs/leagues’ graphics in the background, so ended up duplicating them into 5 pages with different backgrounds.
-
Positions page - both slicer-like navigations are actually bookmark navigators. I’ve used this technique in couple pages here. Main/Details are two grouped bookmarks, changing only the drill level of positions chart. Market Value/Transfer Fee are in different bookmarks’ group, changing filter on a hidden FinanceMode slicer.
-
Leagues page - same technique as previously, which makes drilling through a chart much more user-friendly.
-
Leagues-Details page - same techniques, this time with two hidden slicers (mv/fee and leagues grouping: TOP5/Europe/Non-Europe etc) and top10/bottom10 filtering through a simple RANKX function which I’ll describe later
you can see the two sliders here - they’re so ugly I had to hide them right away and use more visually appealing bookmarks navigation!
-
Five League-specific pages - I’ve built a tactics popup here, using simple trick I’ve learned in one of EDNA youtube videos. It’s just three elements with two bookmarks, creating following visibility states:
tactics closed, but there’s an invisible button on top of everything, which you can click to open tactics selection
tactics open, so our previous invisible button is hidden now, and we can see slicer with tactics instead; right beneath slicer, there’s a huge invisible button taking up entire screen, leading us back to initial bookmark - whenever user clicks outside of tactics slicer, he actually clicks an invisible “return” button
PS: layer order is the key here, popup and the screen-wide button have to be on top of everything else
CUSTOM CHARTS - CHARTICULATOR
multi-label centered barchart
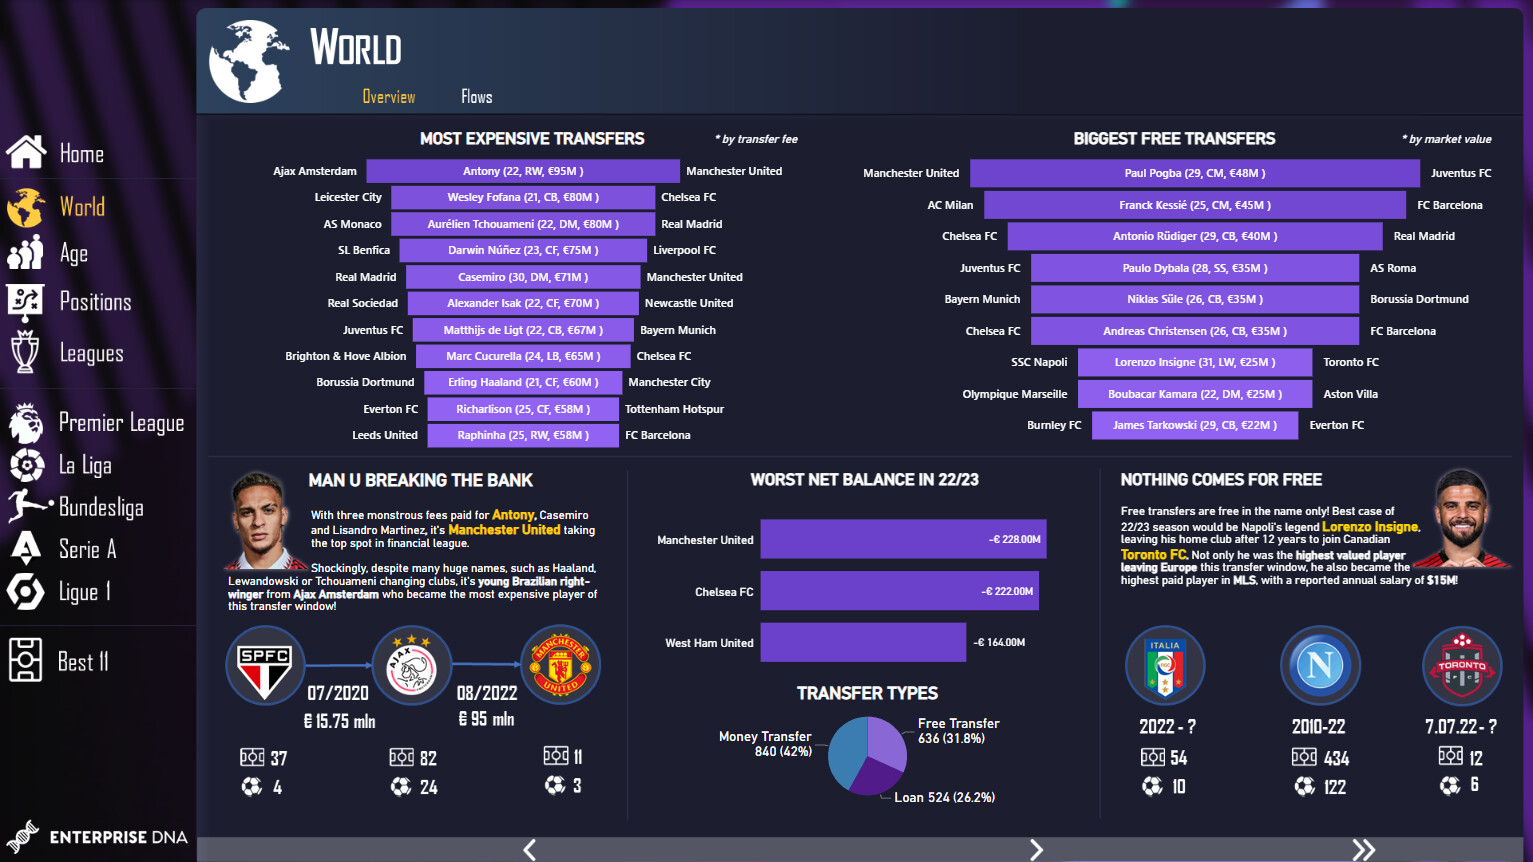
With every transfer being done between two clubs, I thought it’s a good idea to present biggest transfer on a barchart (allowing visual comparison of transfer fees or market values) with both clubs presented as labels. It would’ve been possible with data bar conditional formatting in a table, but I wanted something more attractive, so I went for my first Charticulator visual.
It’s been a pretty simple one:
- centered rectangular glyph
- three text labels - old club on the left, new club on the right, and concatenation of four data fields in the middle
- TOP10 by transfer fee filter, with conditional formatting on fee to create slight gradient effect
Pretty cool how easily we can make slight adjusts and improvements to a standard barchart with Charticulator.
two-way barchart
For TOP5 leagues pages I wanted to create single visualisation combining all crucial financial data, allowing enduser to find out whether club earned or lost money or transfers, and how each of clubs performed in comparison to opponents.
This one was slightly more difficult, but with cool tutorials (Mastering Charticulator course on EDNA + Charticulator’s own sample videos) I learned how to use data axis to present more than one value. On screen you can see my glyph, with two opposite axis, glyph elements (including two shapes, one for each axis, with either fees paid or received binded) and attributes of one of axis.
I’ve also used Charticulator to use shirt icon as a marker for scatterchart displayed over football pitch graphic. I’m not sure whether it’s an optimal solution (looking forward to hear about better options!), but I don’t know how to handle .svg’s yet 
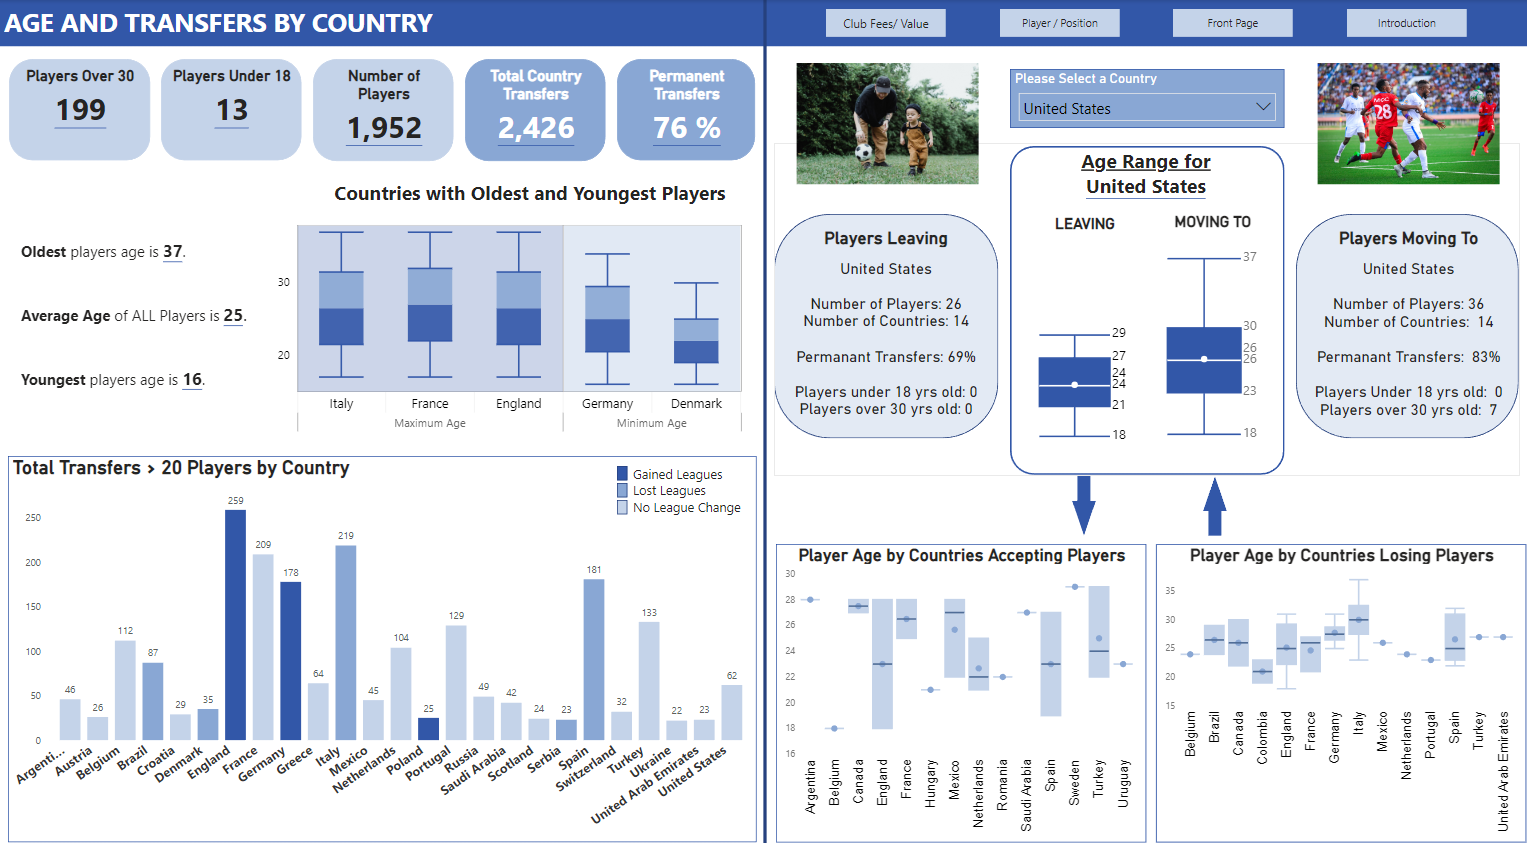
For map chart displaying flow of transfer fees I’ve used custom visual called Flow Map from AppSource. Very easy to set up, it just needed a proper table of pairs of countries and fees flowing from country A to country B.
DAX / MEASURES
Since dataset was pretty simple, I haven’t done too much fancy stuff when it comes to measures. Let’s try to go through couple of most interesting ones:
Two financial modes - market value / transfer fee - for dynamic chart titles and combo measures
One of DAX patterns I’ve commonly used was creating bi-optional measures, returning different values based on end-user’s selection of financial mode slicer:
Combo Rank by Position in Selected Finance Mode =
IF(
    HASONEVALUE(FinanceMode[Mode]),
    SWITCH(TRUE(),
        SELECTEDVALUE(FinanceMode[Mode]) = "Transfer Fee", [Rank per Position - Inc Players by Transfer Fee],
        SELECTEDVALUE(FinanceMode[Mode]) = "Market Value", [Rank per Position - Inc Players by Market Value],
       "error"
    ),
    [Rank per Position - Inc Players by Market Value] // if there is no mode selected, assume MARKET VALUE as default mode
)
Looking at code I guess I might’ve just used IF instead of SWITCH, but I like to make sure I’ll see errors immediately when I add “error” option, in case something goes unexpectedly wrong.
I’ve also used the same code pattern to build chart titles for charts changing information based on user’s selection.
RANKX - top10 / bottom10
In charts where extremes of both positive and negative values are relevant, I think it’s a good idea to display top X and bottom X rows in the same chart. To do so, I’ve created a simple modification of classic RANKX measure:
TOP10 or BOT10 Combo Net Balance =
    VAR clubRank = RANKX ( ALLSELECTED (Clubs), [Combo Net Balances MarketValue/TransferFee], , DESC)
    VAR clubsCount = COUNTROWS(ALLSELECTED(Clubs))
RETURN
    IF( clubRank <= 10 || clubRank > clubsCount-10, 1 , BLANK() )
Picking best tactic and generating pitch scatterchart
Two weeks ago I didn’t know how to use DAX Studio, so creating more complex DAX measures wasn’t easy and I’m fairly sure I could’ve done better with this one. Still I’m gonna try to explain my process, maybe someone will point out where I should’ve used different technique.
First step was ranking players by position:
Rank per Position - Inc Players by Transfer Fee = // ranks all players by transfer fee in context of INCOMING transfers (eg. if filtered by league, it will return rank of players transfered INTO league)

VAR myPosition = SELECTEDVALUE(Players[Player Position])
VAR allPlayers = ALL(Players)
VAR filterbyposition = FILTER(allPlayers,[Player Position]=myPosition)
VAR _result = IF(
    CALCULATE(COUNTROWS(Transfers),Transfers[Direction]="IN") <> 0,
    RANKX(
        filterbyposition,
        [Total Transfers Fees IN Tiebreaker],
        , DESC
    ),
    BLANK()
)
RETURN _result
[Total Transfers Fees IN Tiebreaker] is just a SUM over all transfer fees (I had to add Direction=IN, as I’ve doubled each row in my Transfers table, distinguishing between IN and OUT transfers), with tiebreaker value added. As tiebreaker I’ve used:
RankX Tiebreaker = 1 - MIN(Players[ID Player])/COUNTROWS(ALL(Players))
I’ve built same measures for market values too, to let enduser choose between both financial values when displaying best 11’s by league. For tactics, I’ve created following table, with X/Y positioning of players on the pitch (pitch axis scaled from 0 to 1000):
Then I’ve created a measure returning X/Y only for players who should be in displayed Best 11:
Player Placement on Pitch X =

VAR selectedTactic = IF(HASONEVALUE(Tactics[Tactics]),SELECTEDVALUE(Tactics[Tactics]),MIN(Clubs[BestTact]))

RETURN CALCULATE(
    MIN(Tactics[X]),
    FILTER(
        Tactics,
        Tactics[Tactics] = selectedTactic &&
        Tactics[Position] = SELECTEDVALUE(Players[Player Position]) &&
        Tactics[Nr] = [Combo Rank by Position in Selected Finance Mode]
    )
)
At beginning measure checks whether user has selected any tactic from slicer. If he didn’t, I want to display best tactic possible.
Then my tactics table gets filtered by comparing Tactics[Nr] with player’s rank by position. This way measure will return, for example, X=0 for 3rd best Centre-Forward in tactics where only 2 Centre-Forwards are required, and X>0 for 1st and 2nd best. In the end, since I was using Charticulator, I just had to make sure all players with (X,Y)=(0,0) won’t be displayed by setting visibility:
Finally, for automatically picking best tactic for selected league:
Combo Best Tactic by Transfer Fee / Market Value =

VAR _allTactics = SUMMARIZE(ALL(Tactics),Tactics[Tactics])
VAR _max = MAXX(_allTactics,[Combo Squad - Market Value / Transfer Fee For Tactic])
VAR _filterBestTactic = FILTER(_allTactics,[Combo Squad - Market Value / Transfer Fee For Tactic] = _max)
RETURN FIRSTNONBLANK(_filterBestTactic,TRUE())
Transfer Fee for Tactic is just a sum of transfer fee’s for all players getting selected for squad in tactic being currently in context.
As I said, far from perfect, but in the end it does work smoothly in league/club context.
SUMMARY
This challenge has been really fun learning experience! Key lessons/skills I got out of challenge:
- my first contact with PowerPoint since 10 years - very surprising how advanced graphical effects are possible so easily!
- learned basics of Charticulator - I was already advised to learn Deneb as well, but there’s still a lot of potential in Charticulator I think
- got the hang of bookmarks - it turned out to be a tool much more powerful than I thought once I’ve discovered ‘selected visual’ option
-
flaticon.com - amazing <3
However, it’s now almost two weeks since I’ve finished my project and I’ve learned many new things in the meantime. Especially on DAX level I could have done better:
- I’ve just learned about USERELATIONSHIP few days ago - when building report I found a workaround by doubling transfers entries, but it would’ve been so much easier and more efficient with USERELATIONSHIP
- I didn’t know how to use DAX Studio efficiently, now my tactic creation / visualisation functions would’ve likely been more efficient
- I should’ve separated leagues from clubs table (and clubs country from league country) so I wouldn’t offend Canadians by marking Toronto as American club

Overall I’m quite happy with final result and looking forward for next challenges!